

“Are we on track to deliver XYZ feature by the deadline?”
For software development leaders, this is the question we get most.
We get it from the CEO.
We get it from the other VPs.
We get it over Slack from the project managers and site reliability engineers.
We get it from our technical support leads when we see them in a Zoom call.
We get it by text message early in the morning from a sales rep who has a demo scheduled with a big prospect.
As a VP of Engineering, I never thought much about it. I accepted this question as part of my job. Part of my life.

Then one day I did think about it. And I realized this question was a symbol representing a lot of big challenges I was battling on a day-to-day basis:
- My boss (our CEO) didn’t understand what we really do, or how to help.
- My peers (the other VPs) thought of me and my org as more tactical than strategic.
- My team (our devs) didn’t feel appreciated enough.
- Our company (all of the people) only measured us by our output, not our process.
You want to know the biggest problem of all? I wasn’t actually good at answering the question!
Forecasting is hard. Sometimes we delivered right on time. Half of the time we missed our date. Sometimes we missed it by a lot. I had a good team, and we always had legitimate reasons for missing the mark. But the business didn’t understand the complexities of predicting delivery dates, and I always felt like I lost a tiny bit of credibility with them every time I had to push back a deadline.
Our business and our engineering team didn’t share a common language, so important information was getting lost in translation.
I realized they only asked me about feature delivery dates because they didn’t know what else to ask. I was actually encouraging this behavior because I never took the time to teach them the right questions to ask.
Think about it…
The CEO doesn’t ask the VP of Sales, “Are we going to hit our number?” because they already know the answer. Every week in the executive staff meeting the VP of Sales pulls up their Salesforce dashboard and shows something like this for the current quarter:
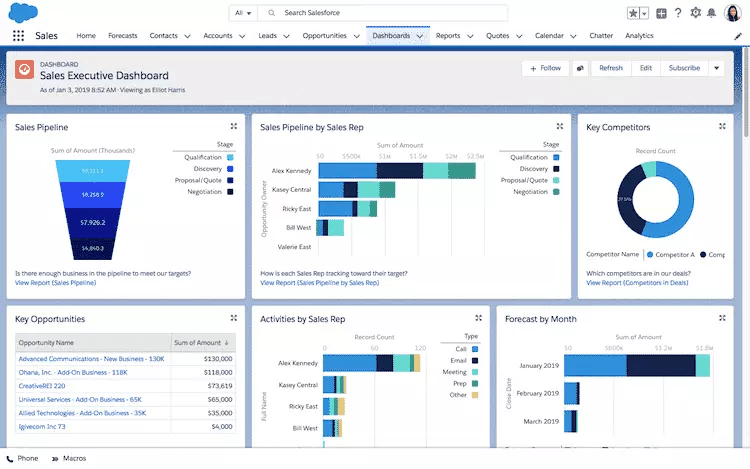
All of these metrics are leading indicators of sales performance for the quarter. The CEO doesn’t wait until after the quarter is over to measure the performance of the sales team. They want to know ahead of time if there are any problems. If there are, they want to know how they can help.
If the CEO doesn’t fully understand how the current quarter leading indicators will translate to the bottom line at quarter-end, they ask insightful questions like:
- “We’re at 85% of quota with 17 days to go. How does that compare to previous quarters?”
- “I see we have more high-risk big deals than normal. Do you need me to visit any of those customers?”
This is a constructive conversation and the type I wanted to be having with the CEO.
Engineering leaders need to communicate their business with data. So I decided every week I would bring some kind of data to the CEO’s weekly meeting.
Unfortunately, the business doesn’t care about commits, active days, or story points. They care about new features, happier customers, and getting more without spending more. The key to effectively communicating progress to the business is to speak the same language and that means translating engineering to business.
To do that, I focused on three engineering-specific metrics that were most closely related to what the business cared about and were leading indicators of success for my organization: investment profile, project allocation, and planning accuracy.
Investment Profile
Investment profile answers the question, “Is the engineering team investing in the right types of work?”
By correlating your Git and Jira data, you can show the types of work your team is executing on. It is commonly broken down by stories, non-functional story work (like paying down tech debt or optimizing existing functionality), bugs, support, customer demands, and hotfixes. You may have additional categories specific to your business. Some examples include:
- Security: Some companies like to see the work they are doing to improve security and compliance.
- Cost reduction: I worked with a CFO once who wanted to see engineering projects that were designed to reduce our infrastructure hosting costs.
- Innovation: One CEO I worked for wanted to see how much we were investing in forward-looking, innovative projects, in other words, big ideas.
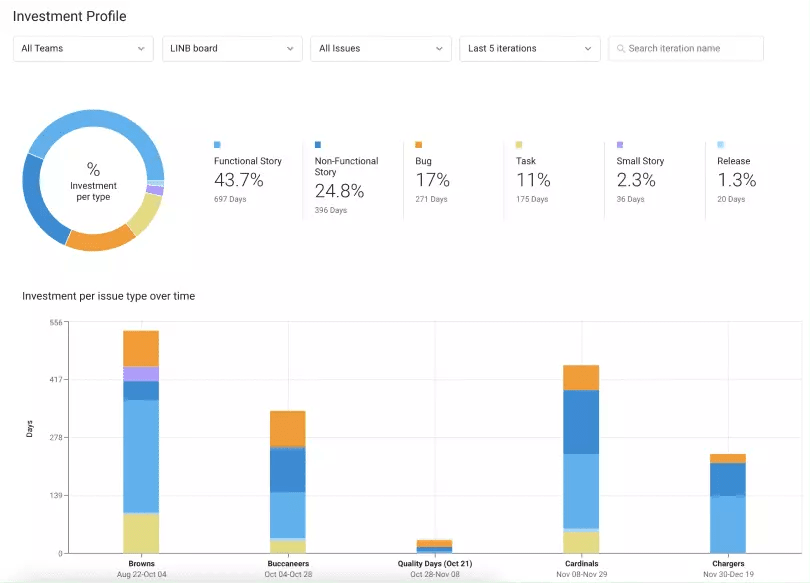 Investment profile measures how much time is spent on each type of task
How to Use Investment Profile in the CEO’s Staff Meeting
Once the execs know what all of your categories mean (i.e. non-functional work is stuff that is important to the backend of how our product runs but that customers don’t really see like scaling infrastructure), they get this right away.
Different execs will care for different reasons.
Your VP of Product will first applaud and then have your back when needed.
Your VPs of Marketing and Sales will probably want to know how much time was spent delivering new features.
Your VP of Customer Success might be more focused on time spent on bug fixes and site reliability.
And this is exactly the conversation you want to encourage–one based on a shared language and context. So the question is no longer “When will feature X be ready?” Now the question is “How do we balance between competing priorities to drive the best result for our customers and the company?” The latter is much more productive.
Show investment profile from week to week or iteration to iteration to explain why more or fewer features were delivered in any given period of time. It will be easier for them to swallow the decision to scale back the functionality of a new feature in order to ensure the reliability and uptime of your product.
Show the ratio of sales requests to innovation tasks to highlight how responsive you are to sales needs. Some parts of the business will view this as a positive signal that you are responsive to customers. Others will see the need to scale back the number of ad-hoc requests in order to free up resources to work on forward-looking, innovative ideas. The most important thing is that you are now having a positive, data-focused, strategic conversation, owned and led by you!
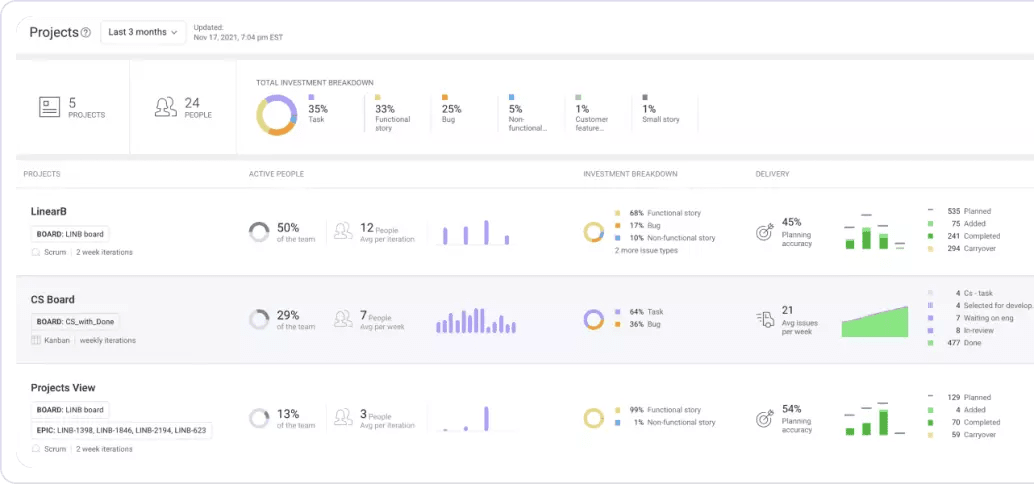
Project Allocation
Project Allocation answers the question “what % of our team is working on each of our projects?”
There are two other values relevant to Project Allocation:
- Dev resources contributing to the project over the selected timespan.
- The total number of people contributing to the project in each iteration.
This metric brings data to discussions about how much work your team can handle.
![]()
Your CEO will love this metric because it quickly shows if engineering is giving enough attention to the things that are the most important to the business. Remember, even if you’re delivering more features, it doesn’t matter if they’re the “wrong” ones.
How to Use Project Allocation in the CEO’s Staff Meeting
Just like investment profile, project allocation provides the necessary context to promote healthy discussion around how to balance competing priorities and finite resources.
If you get asked to take on a new project, you can refer to the project allocation report and counter with, “Absolutely. Which of these existing projects should we invest less in?”
It might just even give you the justification/evidence you need for more headcount. 🤔
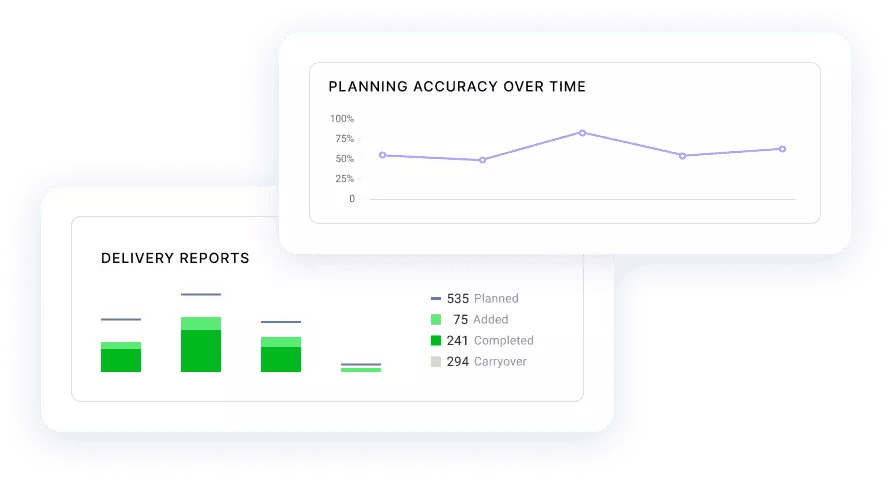
Project Planning Accuracy
Project Planning Accuracy answers the question, “Are we going to deliver features on time for this project?”
Our LinearB Labs research study found that the average sprint planning accuracy across 1,900 teams running Scrum in 2021 was less than 50%. That means your delivery timelines aren’t met more often than they are.
And you’re never going to deliver the features you promised the business this quarter if the teams contributing are delivering less than half of what was planned every 2-3 weeks.
LinearB correlates data across your tools to identify the things that can affect delivering on your promises, like unplanned work or carryover work.
Project Planning Accuracy offers a look at project trends (iteration to iteration) so teams can better estimate what they’re capable of, adjust expectations accordingly, and better predict if they will deliver on promises.
 Using LinearB’s Project Delivery Tracker can help you visualize unplanned work your team is doing each sprint and improve your planning accuracy. Book a demo today!
How to Use Project Planning Accuracy in the CEO’s Staff Meeting
Cross-reference planning accuracy with investment profile. Investment profile is an important leading indicator of planning accuracy, so viewing them together adds additional context about trends in your delivery.
For example, if you see that your team is continuously investing in issue types related to bugs or technical debt, you may realize you’re overplanning each sprint and not allocating for the inevitable unplanned work.
Or if you have low planning accuracy and identify a trend of added work being a large portion of what is delivered each iteration, you should have a conversation with your product teams about scope creep.
The holy grail is when your CEO understands these engineering “woes,” sees the team as predictable, and encourages you to invest more in bugs or technical debt now so you can improve your planning accuracy and speed up your delivery over time. After consistently showing planning accuracy and investment profile in the exec meeting, this happened to me!

I know what you’re thinking: “What about velocity?”
Some teams use this metric to answer the question, “Are we moving faster or slower on project XYZ?”
Be careful. Not all issues and story points are equal, and velocity can be abused if not used carefully.
 Find out why agile velocity is the most dangerous metric for software developers. Look at 12 alternative metrics instead.
All of the Objections
I know what some of you are thinking:
My CEO only cares about the bottom line.
This could be true. And it actually doesn’t matter either way. The data that you are bringing to your executive meetings drives the bottom line. That’s the point. CEOs care about leading metrics that drive the bottom line, and arguably, the best CEOs care more about these leading indicators than the bottom line. Trust me, your CEO will feel good about understanding the process more and knowing how to help when needed.
We are going through a transition. I’ll start measuring after.
I’ve heard this one a few times. “We are forming new teams. I’ll start once everything gets settled.” Or “We are working on a new CI/CD initiative. I’ll start measuring a few months after.” It’s natural to feel that starting to be data-driven while things are in transition is not the right time. The fact is, any transition period is actually the best time to start. It allows you to track your improvement throughout the transition.
The data right now won’t make my team look very good.
This is interesting. What does your team look like now without data? Invisible. The truth is it’s not about “good” and “bad.” It’s about baselining for improvement and being proactive with the health of your software team. Being data-driven in your executive meeting will make you look good and will allow your peers to help your organization improve in areas of need.
Are You Ready for Your Next CEO Staff Meeting?
Sharing this data every week in the CEO’s staff meeting will get your peers away from only asking you if the feature is on time and get you away from constantly being on the defensive. Forecasting delivery dates will always be difficult, but focusing on the leading data indicators will actually help you hit more deadlines while improving the conversation at your executive table.
Your CEO and peers will gain an understanding of what actually drives performance in your organization. Your team will feel more appreciated because you’re emphasizing measuring the process and not just the output (when the thing is going to be delivered).
Bringing data to your executive table will allow you to be more strategic to the business and not just a tactical execution machine. Starting with investment profile, project planning accuracy and investment profile will open doors for you to further contribute strategically and lay a path for the next metrics you want to bring to the table.
How To Do It
I used spreadsheets to track this data before. It was painful. I was never sure if I could trust the data from Jira because it wasn’t fully updated. And it took a data engineer hours to manually collect data from each team at the end of each iteration.
That’s why I founded LinearB. We automate the whole process. You can see your team’s investment profile, project allocation, and planning accuracy right now. Get a demo of LinearB today!
Check it out and email if you want tips for how to present it at your CEO’s next exec meeting: dan@linearb.io.