Imagine benchmarking your engineering productivity against a proprietary formula only to be asked by executive leadership to explain how that metric drives bottom-line growth. If you measure developer productivity against a black box, how can you expect to know what changes will significantly impact strategic initiatives?
A concerning trend in metrics frameworks is the rise of opaque composite metrics and proprietary formulas marketed as one-size-fits-all solutions. These metrics often benchmark your organization against an unspecified pool of companies and rely on process-heavy consulting that delivers vague recommendations.
Here are my two (least) favorite examples:
Developer Velocity Index (DVI) uses a proprietary set of survey questions as a proxy for productivity but doesn’t reveal what drives success.
Developer Experience Index (DXI) relies on subjective survey results to gauge developers' perceptions of factors impacting performance.
Both rely on surveys as the primary measurement method, but perception metrics aren’t always reliable. Your most vocal critics might be your highest performers, while your quietest team could be struggling but afraid to speak up. Using subjective composite metrics as a proxy for productivity risks misidentifying where to focus improvements.
What’s most concerning is that these metrics put engineering leaders on defense because they fail to provide a recipe for measurable improvement.
But before we move on, I want to clarify one point: there is no universal framework for measuring developer productivity or experience. Anyone telling you something different is trying to sell you something.
But don’t just take my word for it. LinearB partnered with Luca Rossi of Refactoring (read every week by 130,000+ engineers and managers) to conduct a survey and publish a report that breaks down this problem. Sign up for early access to the report.
We found three key traits shared by highly successful engineering teams:
- Engineering is well-regarded among leadership and non-technical stakeholders.
- Engineers are satisfied with their development practices.
- Projects ship on time.
While this is simple in theory, it’s challenging to achieve in practice. That’s where traditional metrics frameworks often fall short: they overcomplicate things without providing clear direction.
The Flawed Premise of Composite Perception Metrics
Surveys can be an excellent research tool, particularly when wielded by experienced practitioners who can structure rigorous experiments in a vacuum to measure the impact of incremental productivity changes. However, most engineering organizations lack the luxury of dedicated business units to research and implement custom productivity solutions. They’re too busy delivering features, fixing bugs, and keeping the lights on.
Perception surveys are also subject to extremity bias, particularly negative extremes, and they do not indicate what improvements would have the most significant impact on overall productivity. When you combine multiple perception benchmarks into a composite score, their complexity increases by an order of magnitude.
Imagine if sales leadership relied on a composite score to measure “sales execution” by combining subjective feedback on whether the CRM tool felt effective with self-reported data on the number of phone calls each rep made. It’s easy to see how flawed and unreliable this approach would be and why that sales leader wouldn’t keep their job for long.
That’s what it looks like when engineering leaders use vague perception metrics as a proxy for productivity. Chances are other leaders in the organization will meet you with endless skepticism, and you’ll have to explain everything repeatedly. This distracts from the real goal: making your organization more productive.
Framework Confusion Hurts Progress
Let’s be clear: measuring impact is critical. Sales teams celebrate deals with clear revenue numbers. Customer success tracks retention. Product managers measure adoption and usage.
But ask the average engineering manager how their team contributes to the bottom line, and you’re met with vague hand-waving or even outright resistance to the idea of measurement. This gap in measurement isn’t just frustrating; it’s dangerous. It leaves engineering leadership unable to advocate for resources, celebrate wins, or align with business goals.
Instinctively, engineering teams turn to frameworks to fill this void. Yet, instead of clarity, they’re met with a labyrinth of metrics that often fail to address what matters. Which should they prioritize, deployment frequency? Throughput metrics? Software quality? The noise is deafening, and the signal is weak.

There’s always a relevant xkcd. Don’t worry; the inevitable Simpsons reference will come later.
So, how do you avoid the pitfalls of traditional metrics frameworks and focus on strategic alignment?
How to Move Beyond Metrics Frameworks
To move beyond metrics and make meaningful improvements, you need to build a narrative around engineering as a strategic investment.
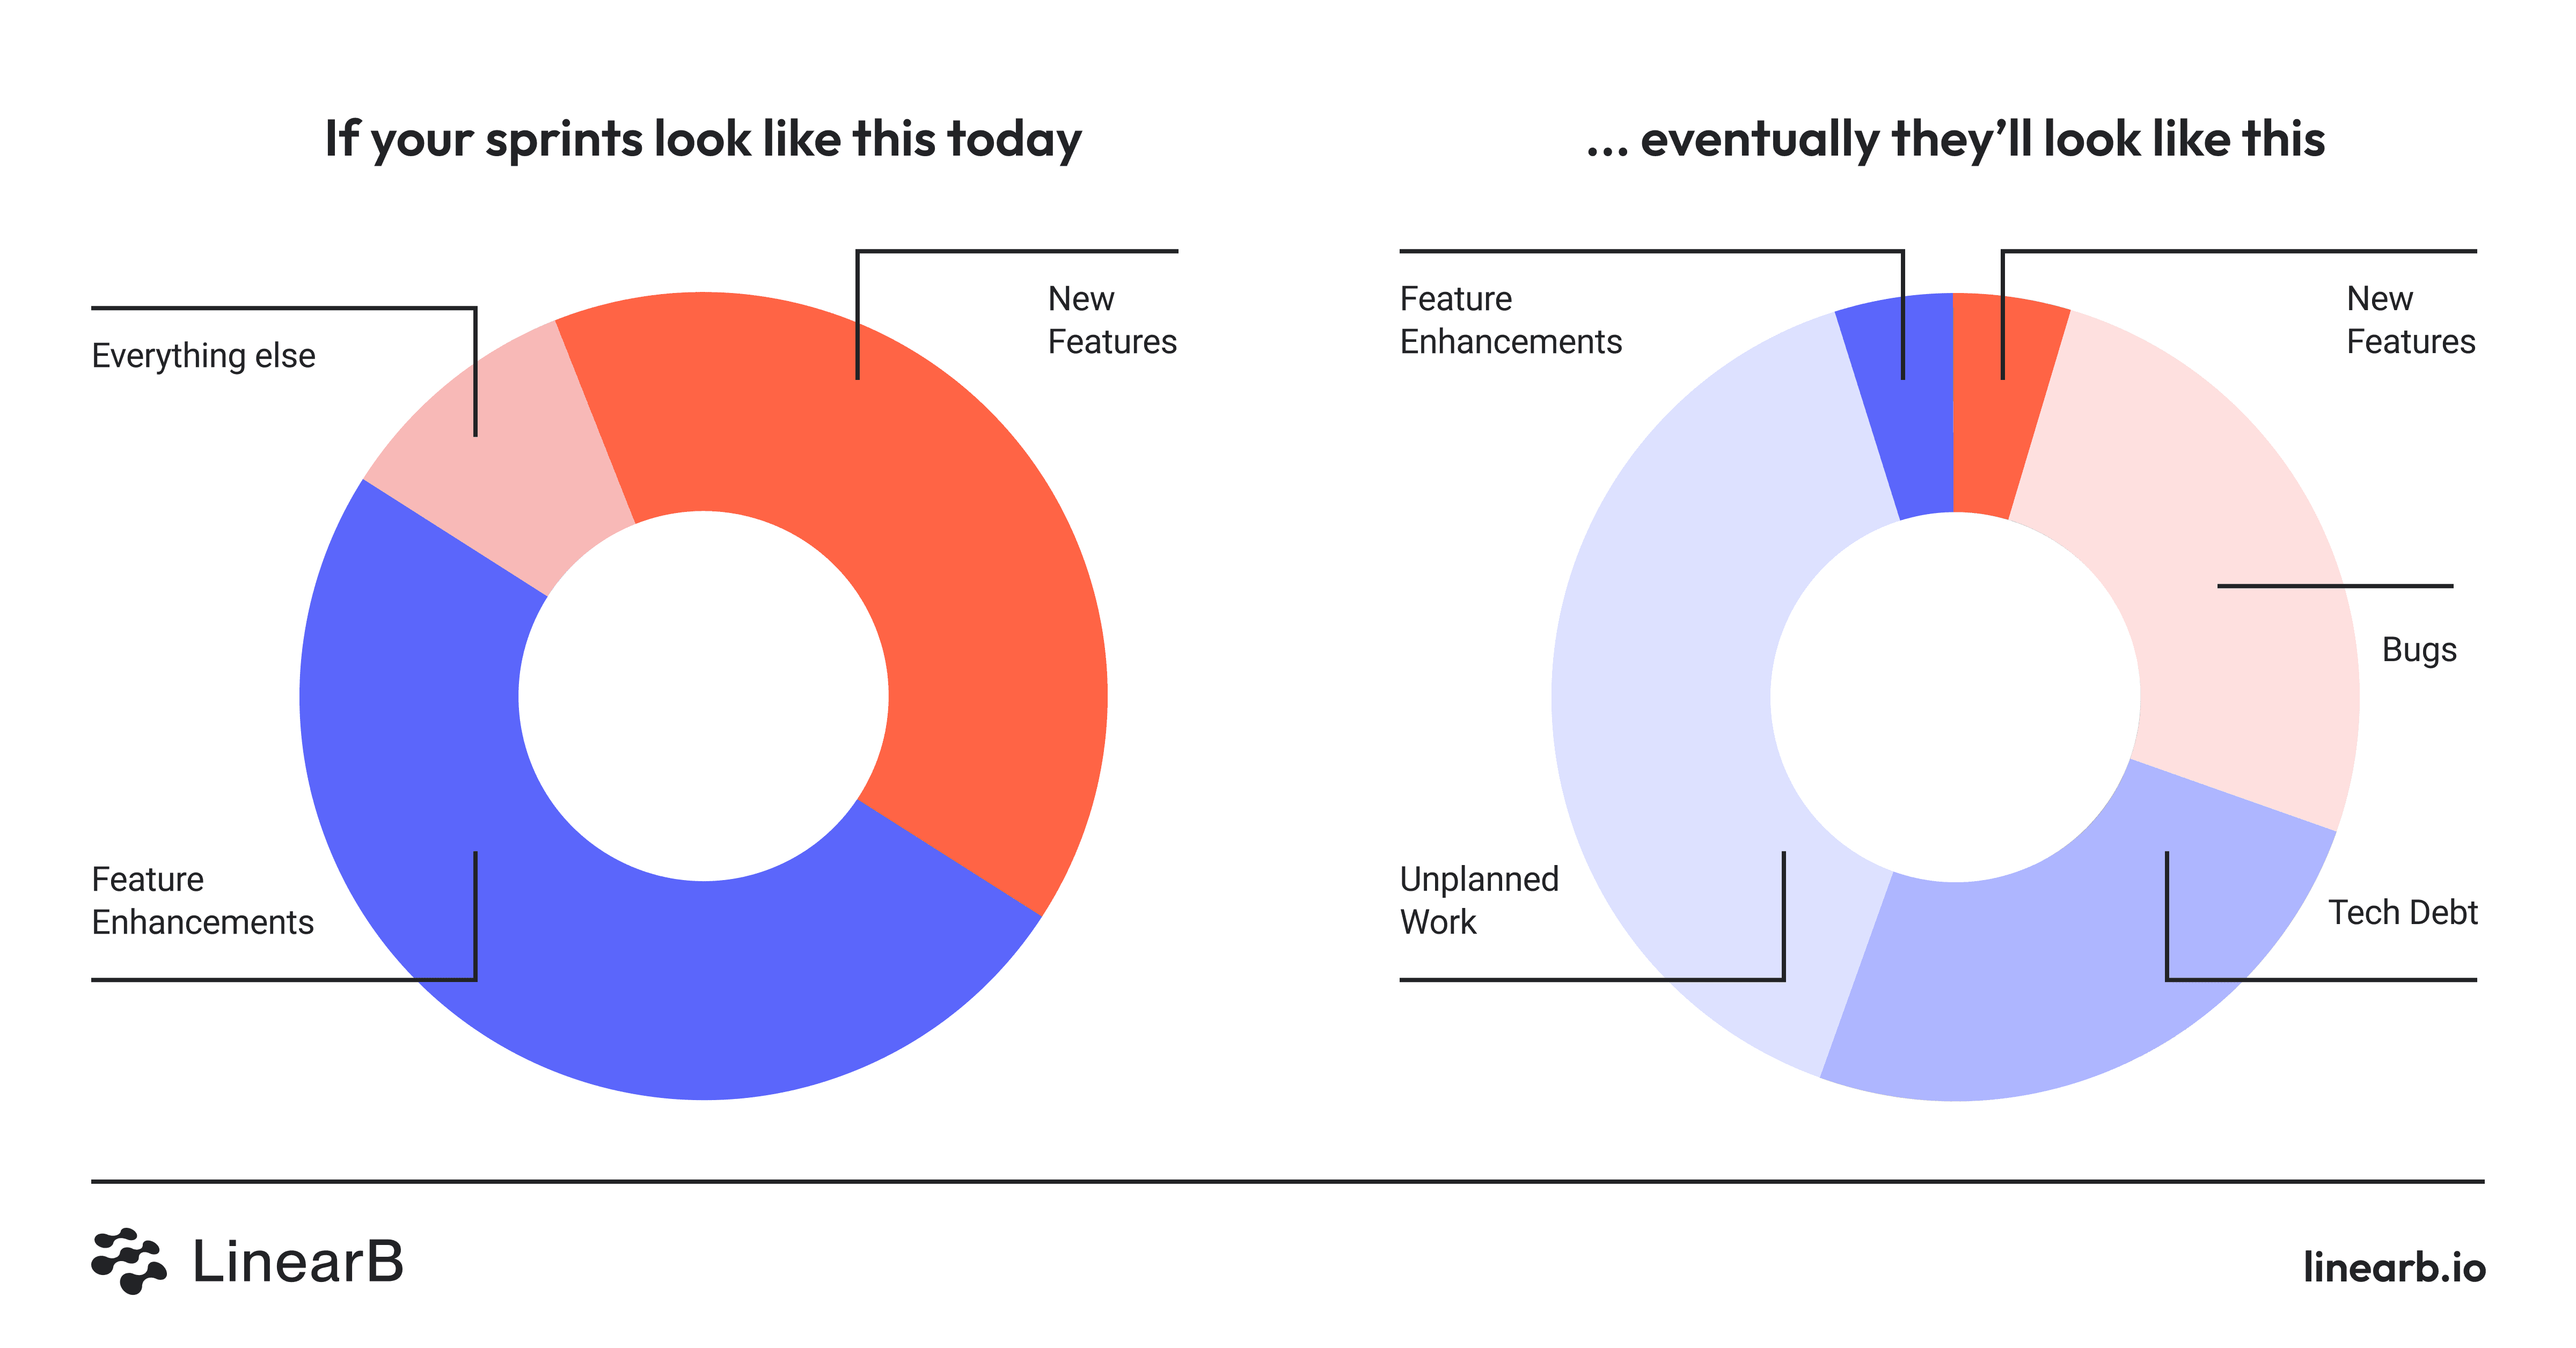
Ask any non-engineering executive what they want from engineering, and they’ll likely say something about delivering features faster. But engineering isn’t that simple. If pursuing innovation means cutting corners on platform stability, process efficiency, tech debt, or other aspects critical to developer experience, it’s a short-sighted strategy that will eventually come back to bite you.
The longer you ignore these concerns, the greater the risk to your organization’s long-term success.

One common pitfall is framing innovation as the sole focus of your engineering investments, especially when communicating with non-engineering executives. In many organizations, hitting 100% of quarterly goals has become the norm. Against this backdrop, stating that engineering spent only two-thirds of their time on new innovations can come across as a failure, even when it’s a necessary trade-off for sustainability.
Unfortunately, executives often interpret this gap as an untapped opportunity to push engineering for more deliverables rather than an acknowledgment of the critical need for upkeep and maintenance. Failing to align on these priorities sets a dangerous precedent and risks overcommitting your teams at the expense of long-term resilience.

“Our innovation ratio is only 68%! Does that mean we can add more features to the roadmap?”
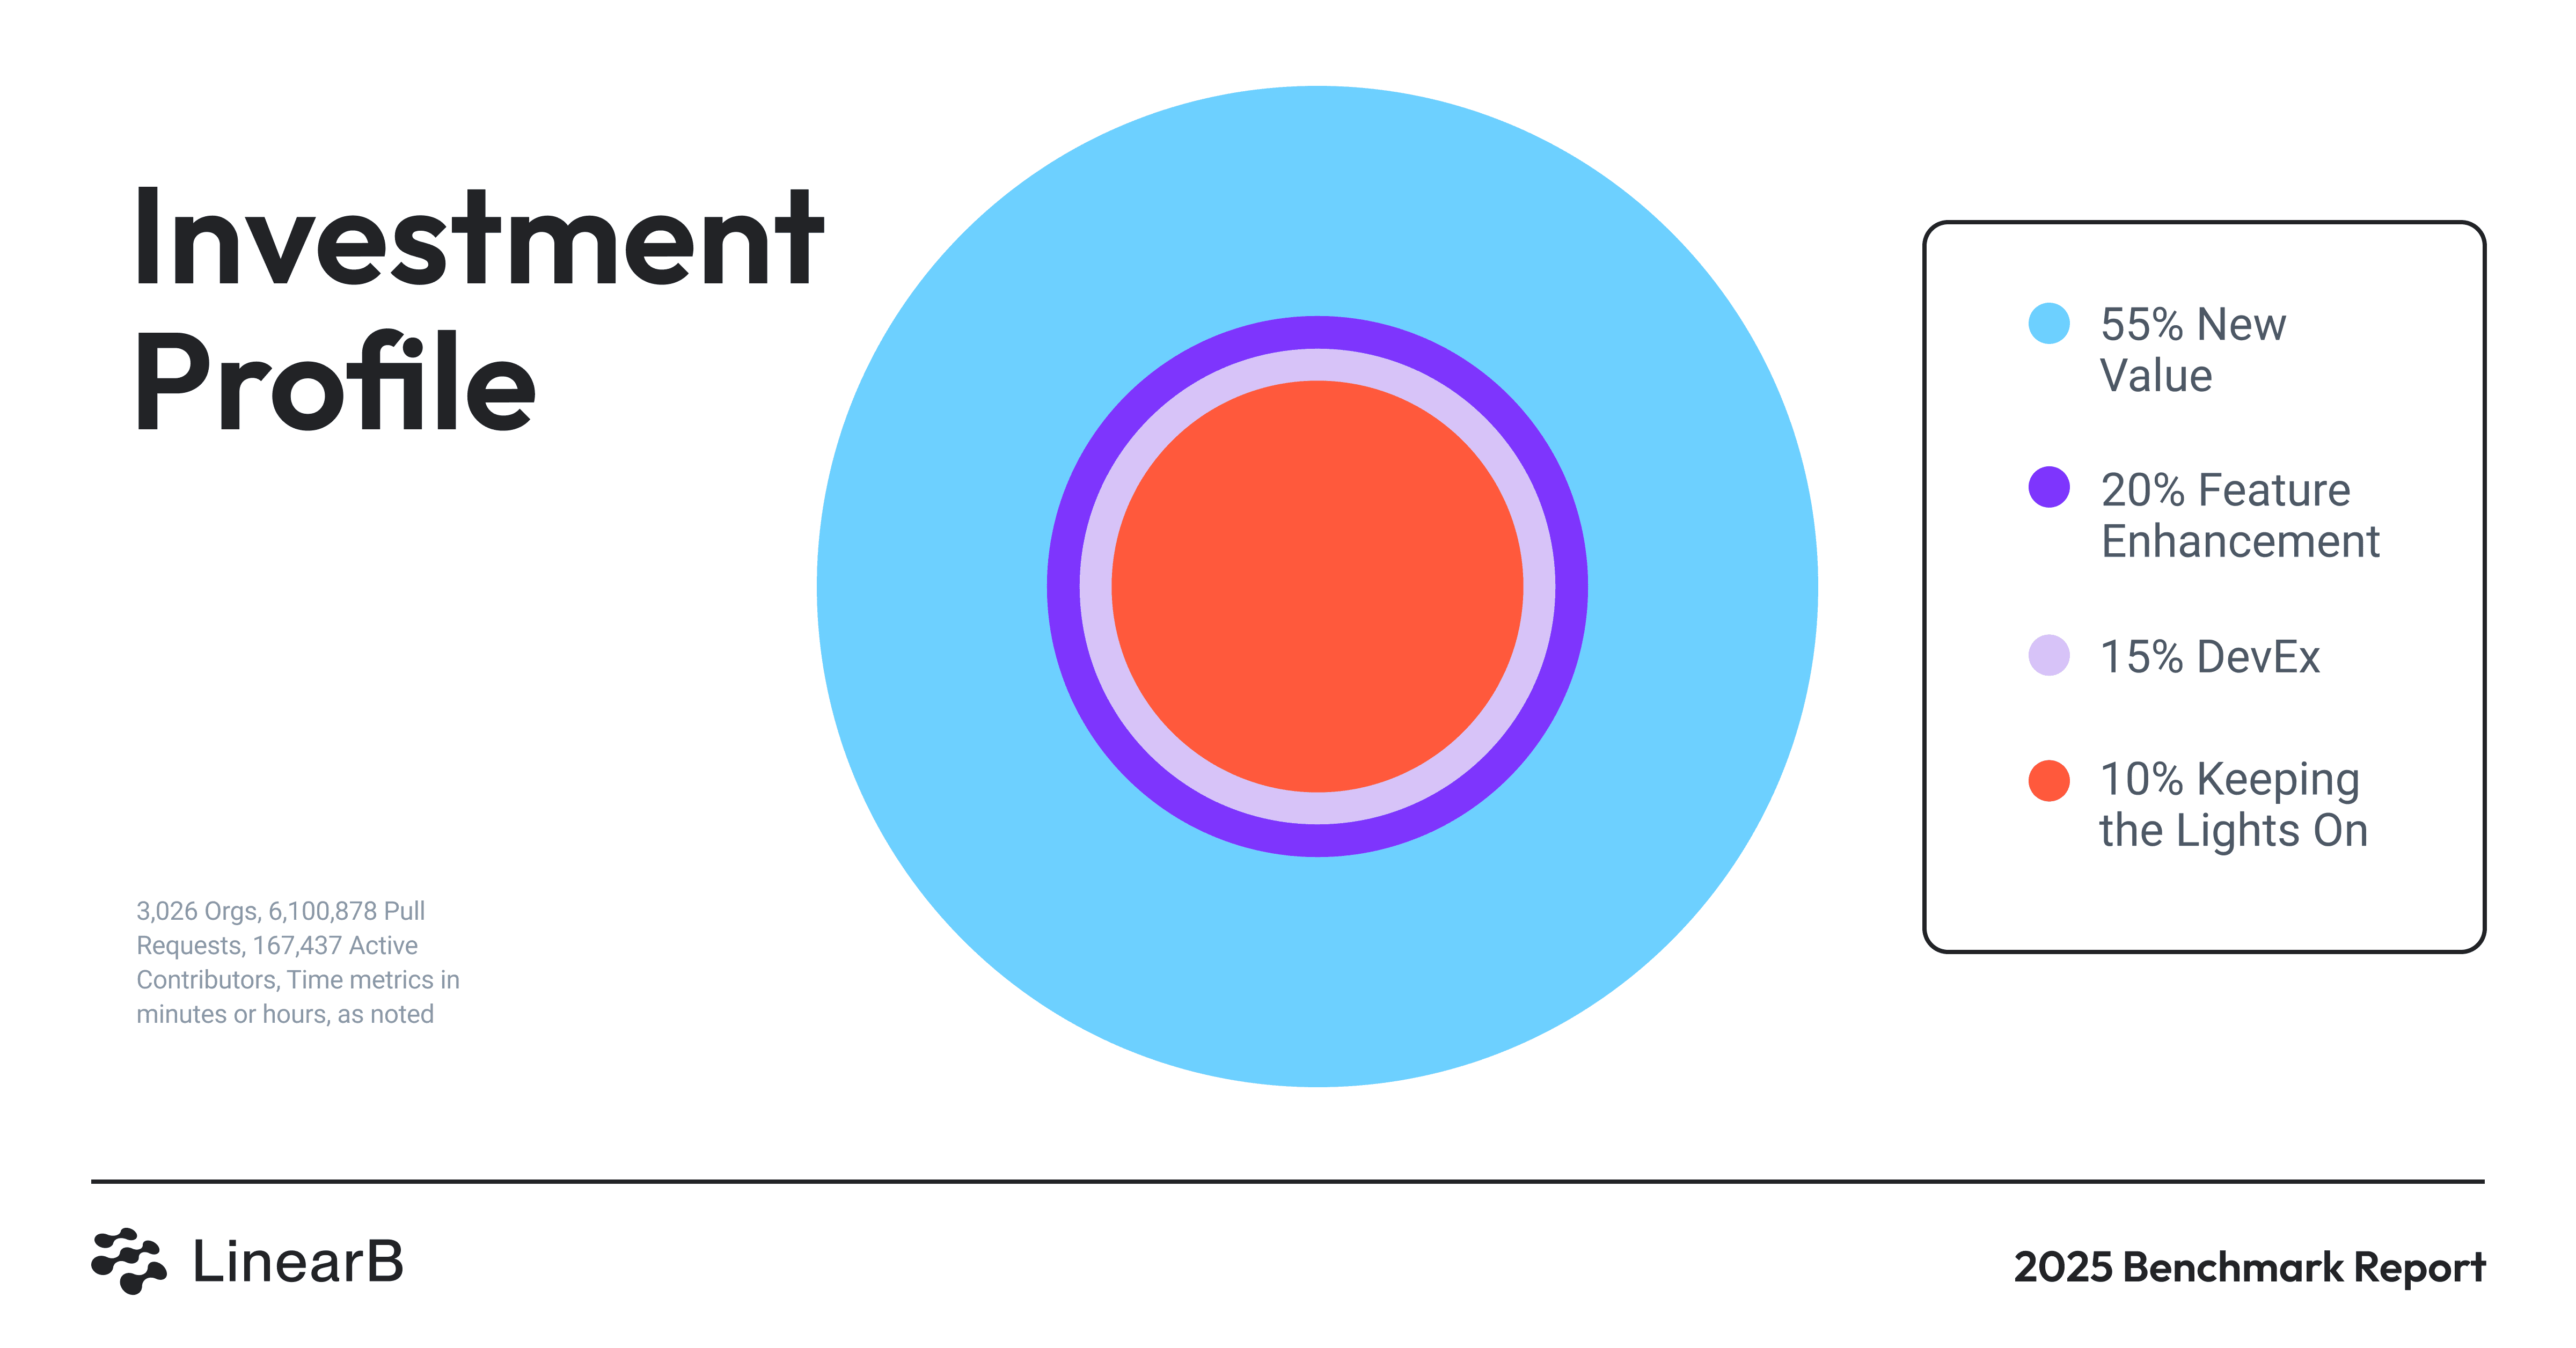
Tools like LinearB’s Benchmarks Report are a great starting point for framing these conversations. According to the report, here is how the average company divides engineering investments.
- 55% new value - investments in new features to increase revenue or growth.
- 20% feature enhancement - feature enhancements that ensure customer satisfaction.
- 15% developer experience - improvements to developer productivity and team experience.
- 10% keeping the lights on - minimum tasks required to stay operational.

Our partnership with Refactoring revealed one fascinating insight about allocating engineering resource investment. Organizations that intentionally allocate engineering time to a balanced investment profile are 24% more likely to deliver projects on time, 22% more likely to spend their time as planned, and 14.7% happier about their work.
These insights are straight from the industry survey we conducted with Refactoring; sign up for our upcoming workshop on moving beyond engineering metrics to receive early access to the survey analysis.


