Engineering Resource Allocation Drives Business Outcomes
For too long, engineering was seen as a cost center rather than a value driver. Thankfully, that perception is changing. Now, it’s nearly universally understood that every company is a software company, meaning engineering excellence needs to be a top concern for leadership teams, regardless of industry vertical.
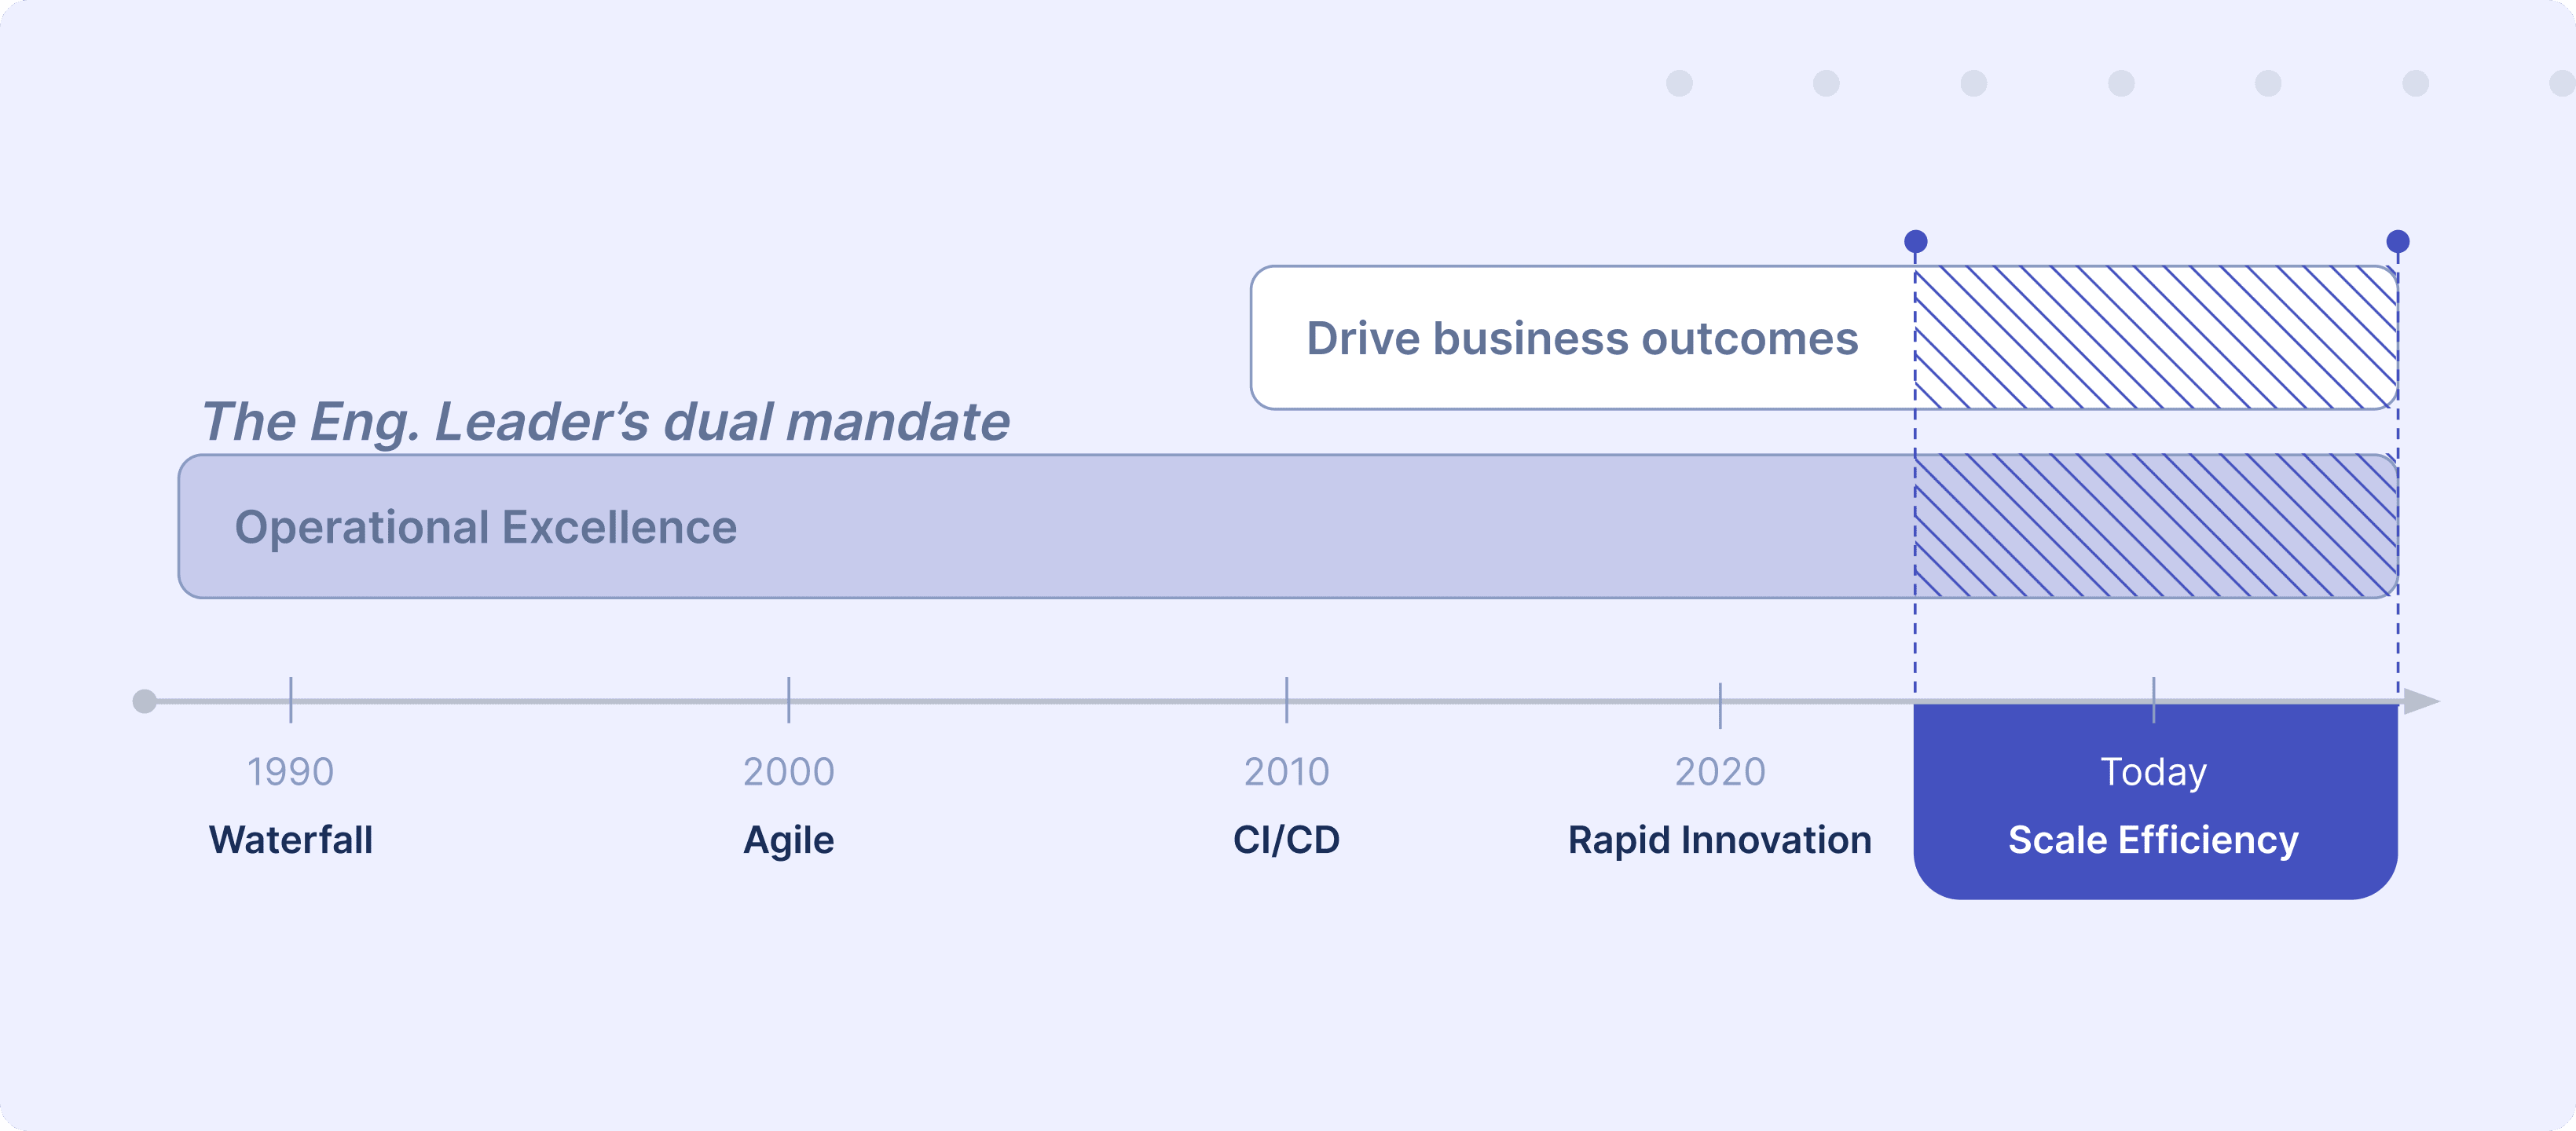
It also means that engineering leaders are now responsible for BOTH delivering quality products as efficiently as possible AND positively impacting the business.
To drive business outcomes, engineering leaders need to identify and prioritize high-value projects that the business expects to drive revenue, retention, and customer satisfaction. That means:
- Engineering resource planning using resource allocation metrics and KPIs
- Following best practices for managing resources (outlined in this guide)
- Balancing engineering resources across multiple projects to complete high-value projects on time (further impacting the business)
In short, it means implementing effective engineering resource allocation strategies as part of a holistic metrics program. This post will cover that.
Three Outcomes of Engineering Resource Allocation Visibility
We talked in a previous guide about getting your metrics program off the ground and the data that needs to be included to build it. Understanding how projects/initiatives/work are resourced is a significant part of that metrics program. When leaders have visibility into this data, they’ll see myriad benefits, including:
Engineering Resource Allocation and Team Productivity
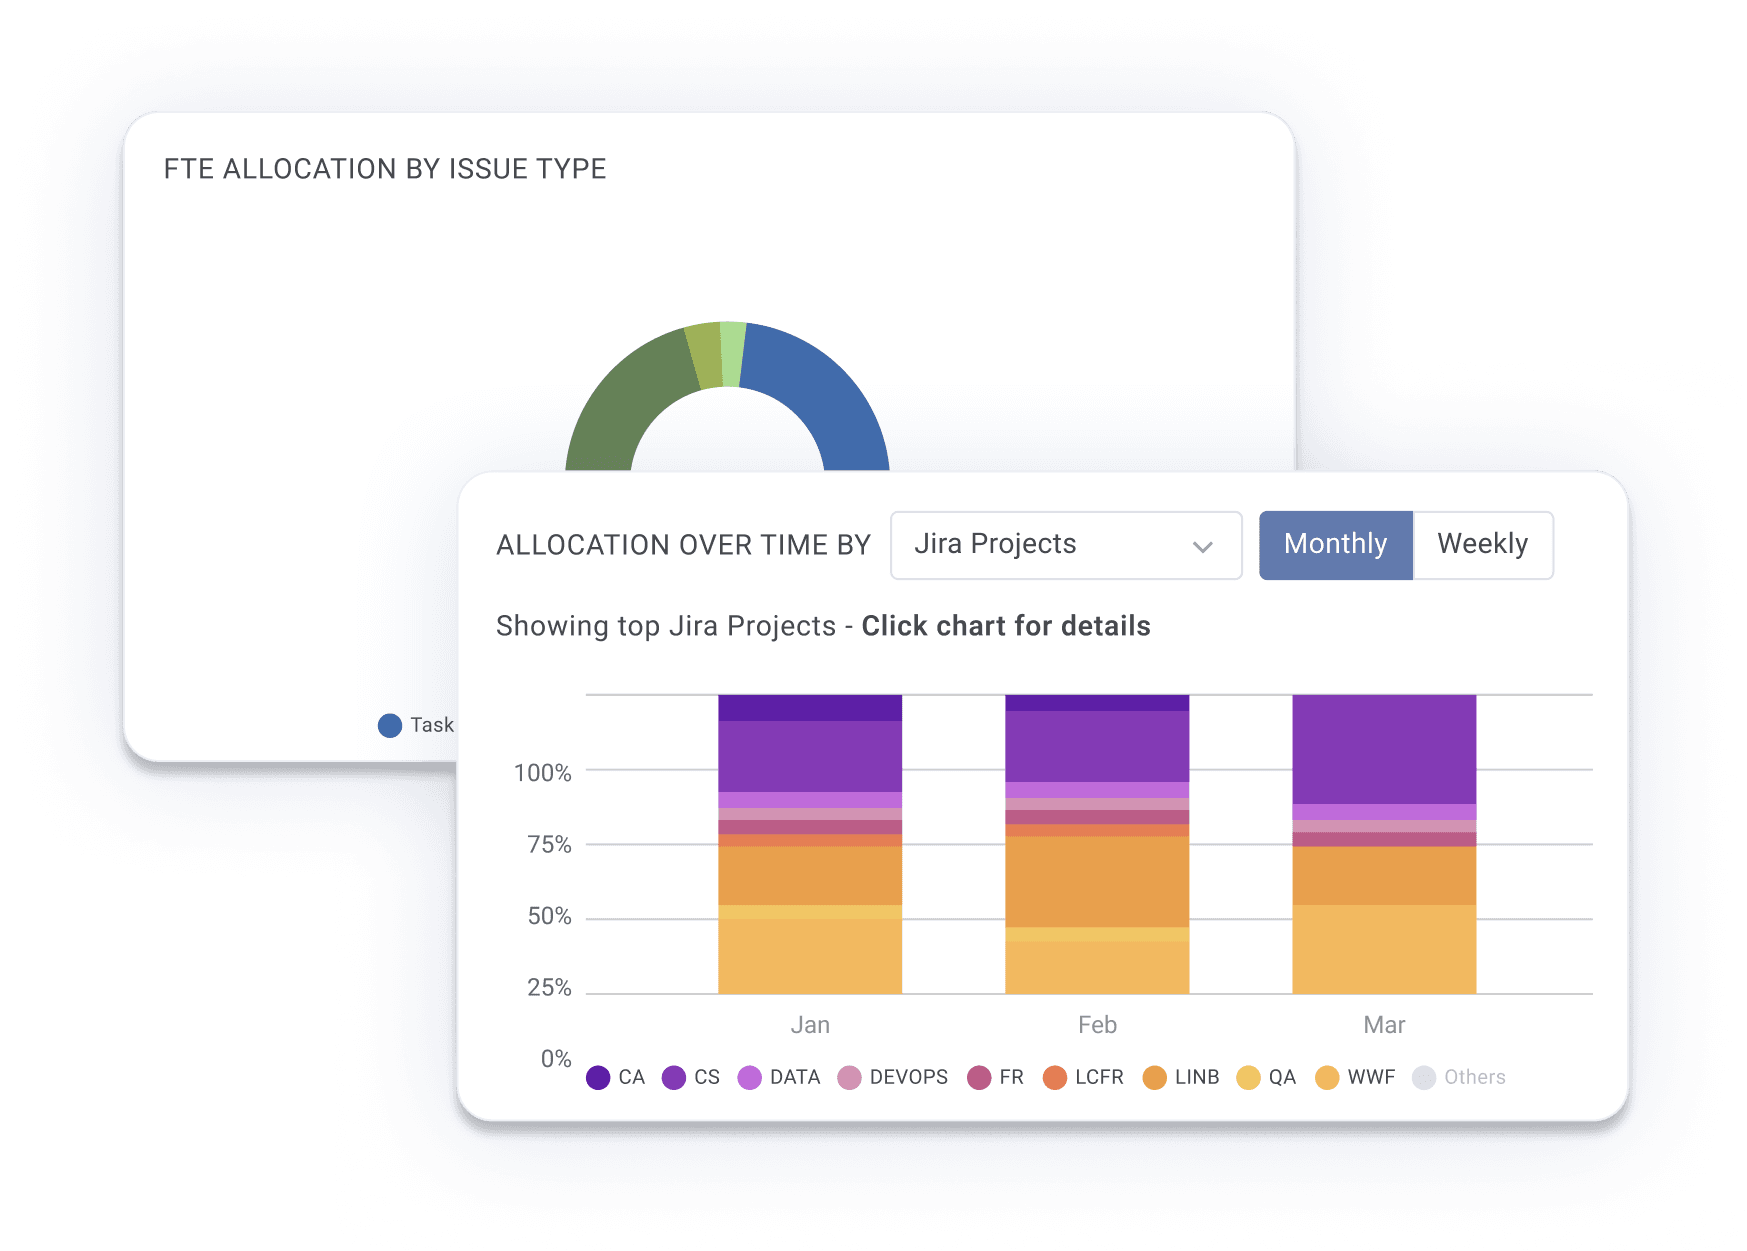
A metrics program helps engineering leaders set data-backed improvement goals, develop strategy, and increase operational efficiency for development teams. A metrics program that incorporates visibility into how teams spend cycles and includes industry-standard benchmarks for optimizing resourcing helps them deliver operational excellence AND drive better business outcomes.
More data means more context. More context means improved decision-making.
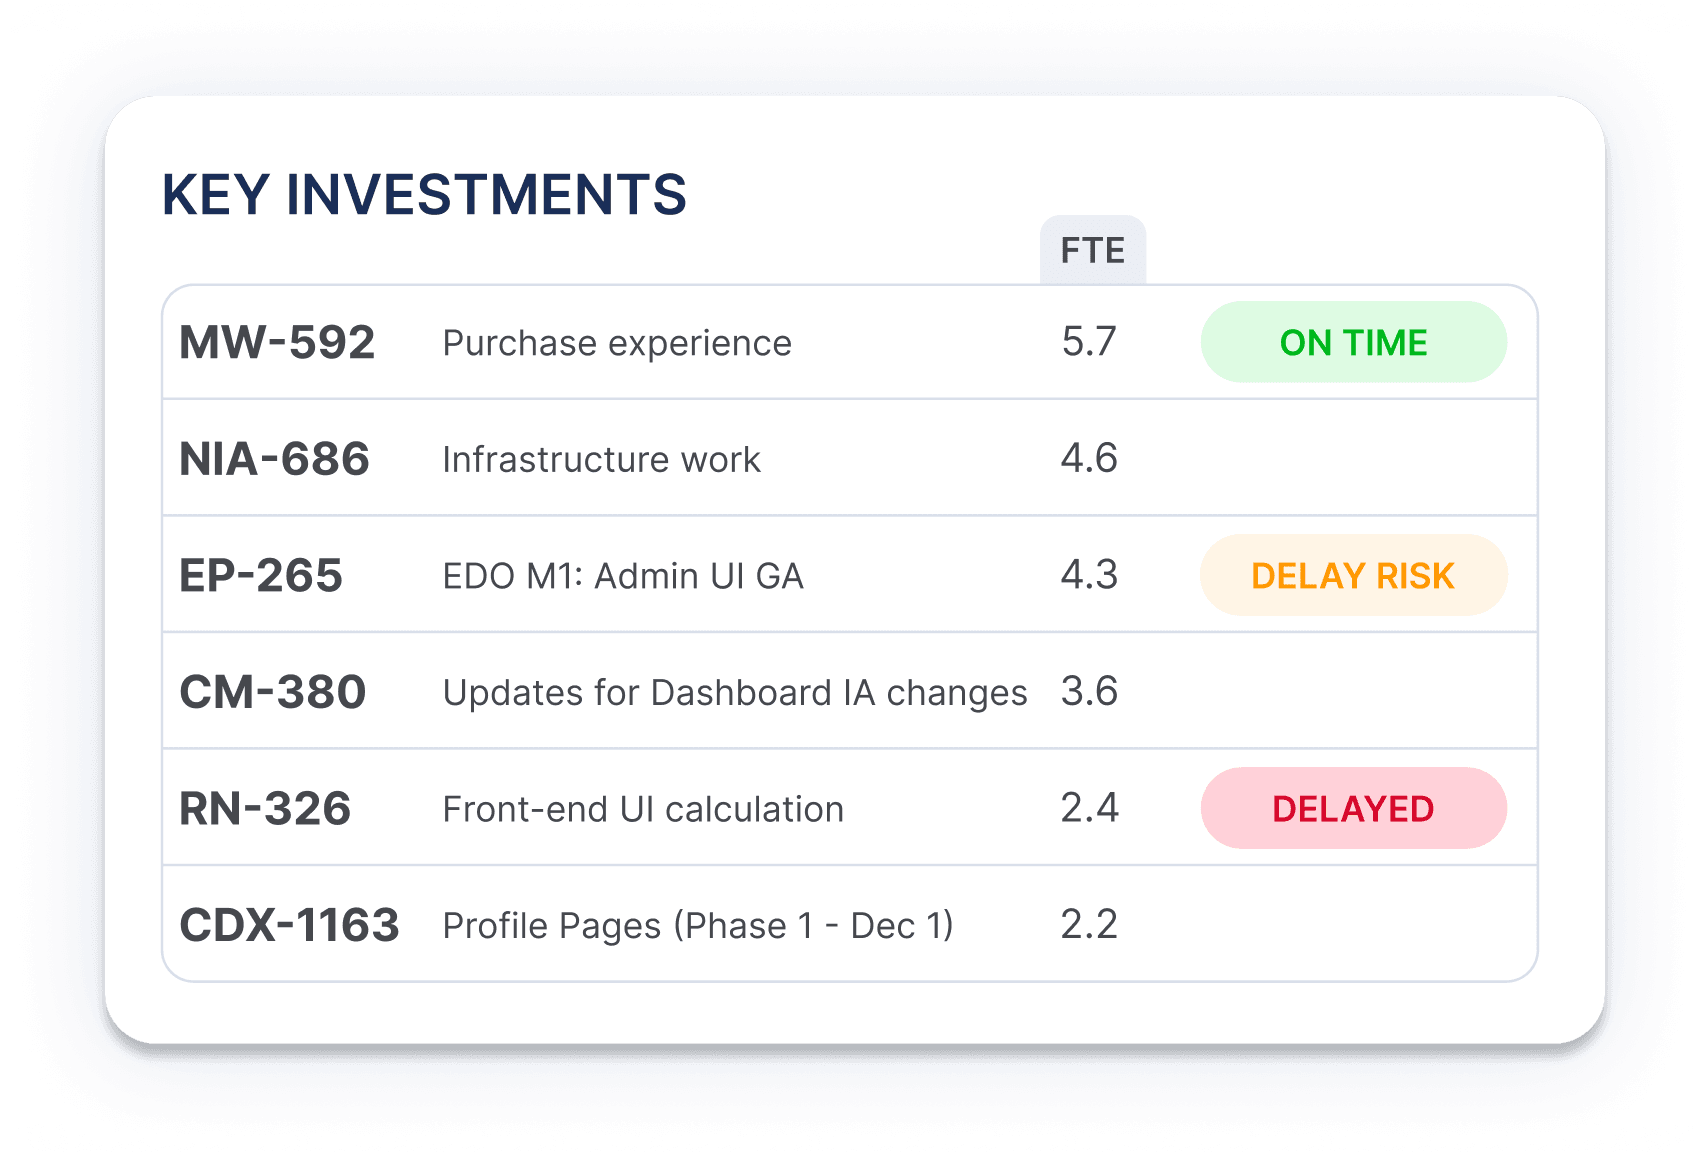
Without engineering resource allocation visibility, leaders are flying partially blind.
Engineering Resource Allocation and Cost Management
It’s difficult to know the costs or the bottom-line impact of optimizing your resourcing strategy–at least until you have more visibility and context.
Just like engineering priorities, business priorities can change quickly. What was once a rallying cry for the entire company can easily get shelved–pour one out for Zune.
When business needs change, engineering must respond by following best practices for allocating engineering resources to projects that align with a new strategic direction.
For example, let’s assume a dev team of 100 moves some resources around and reallocates just an additional 1.5% to both (1) New Value and (2) High value projects as determined by conversations with business leaders. If we take that 3% reallocation X 100 devs X an annual cost of $100K (a likely low number), the new value that can be reinvested is $300K.
That’s the power of visibility into engineering resource allocation costs and optimized utilization.
The ROI calculator can help you get a sense of how to optimize your resourcing and find where potential value is hiding within your organization.
Saving Money and Spending Wisely
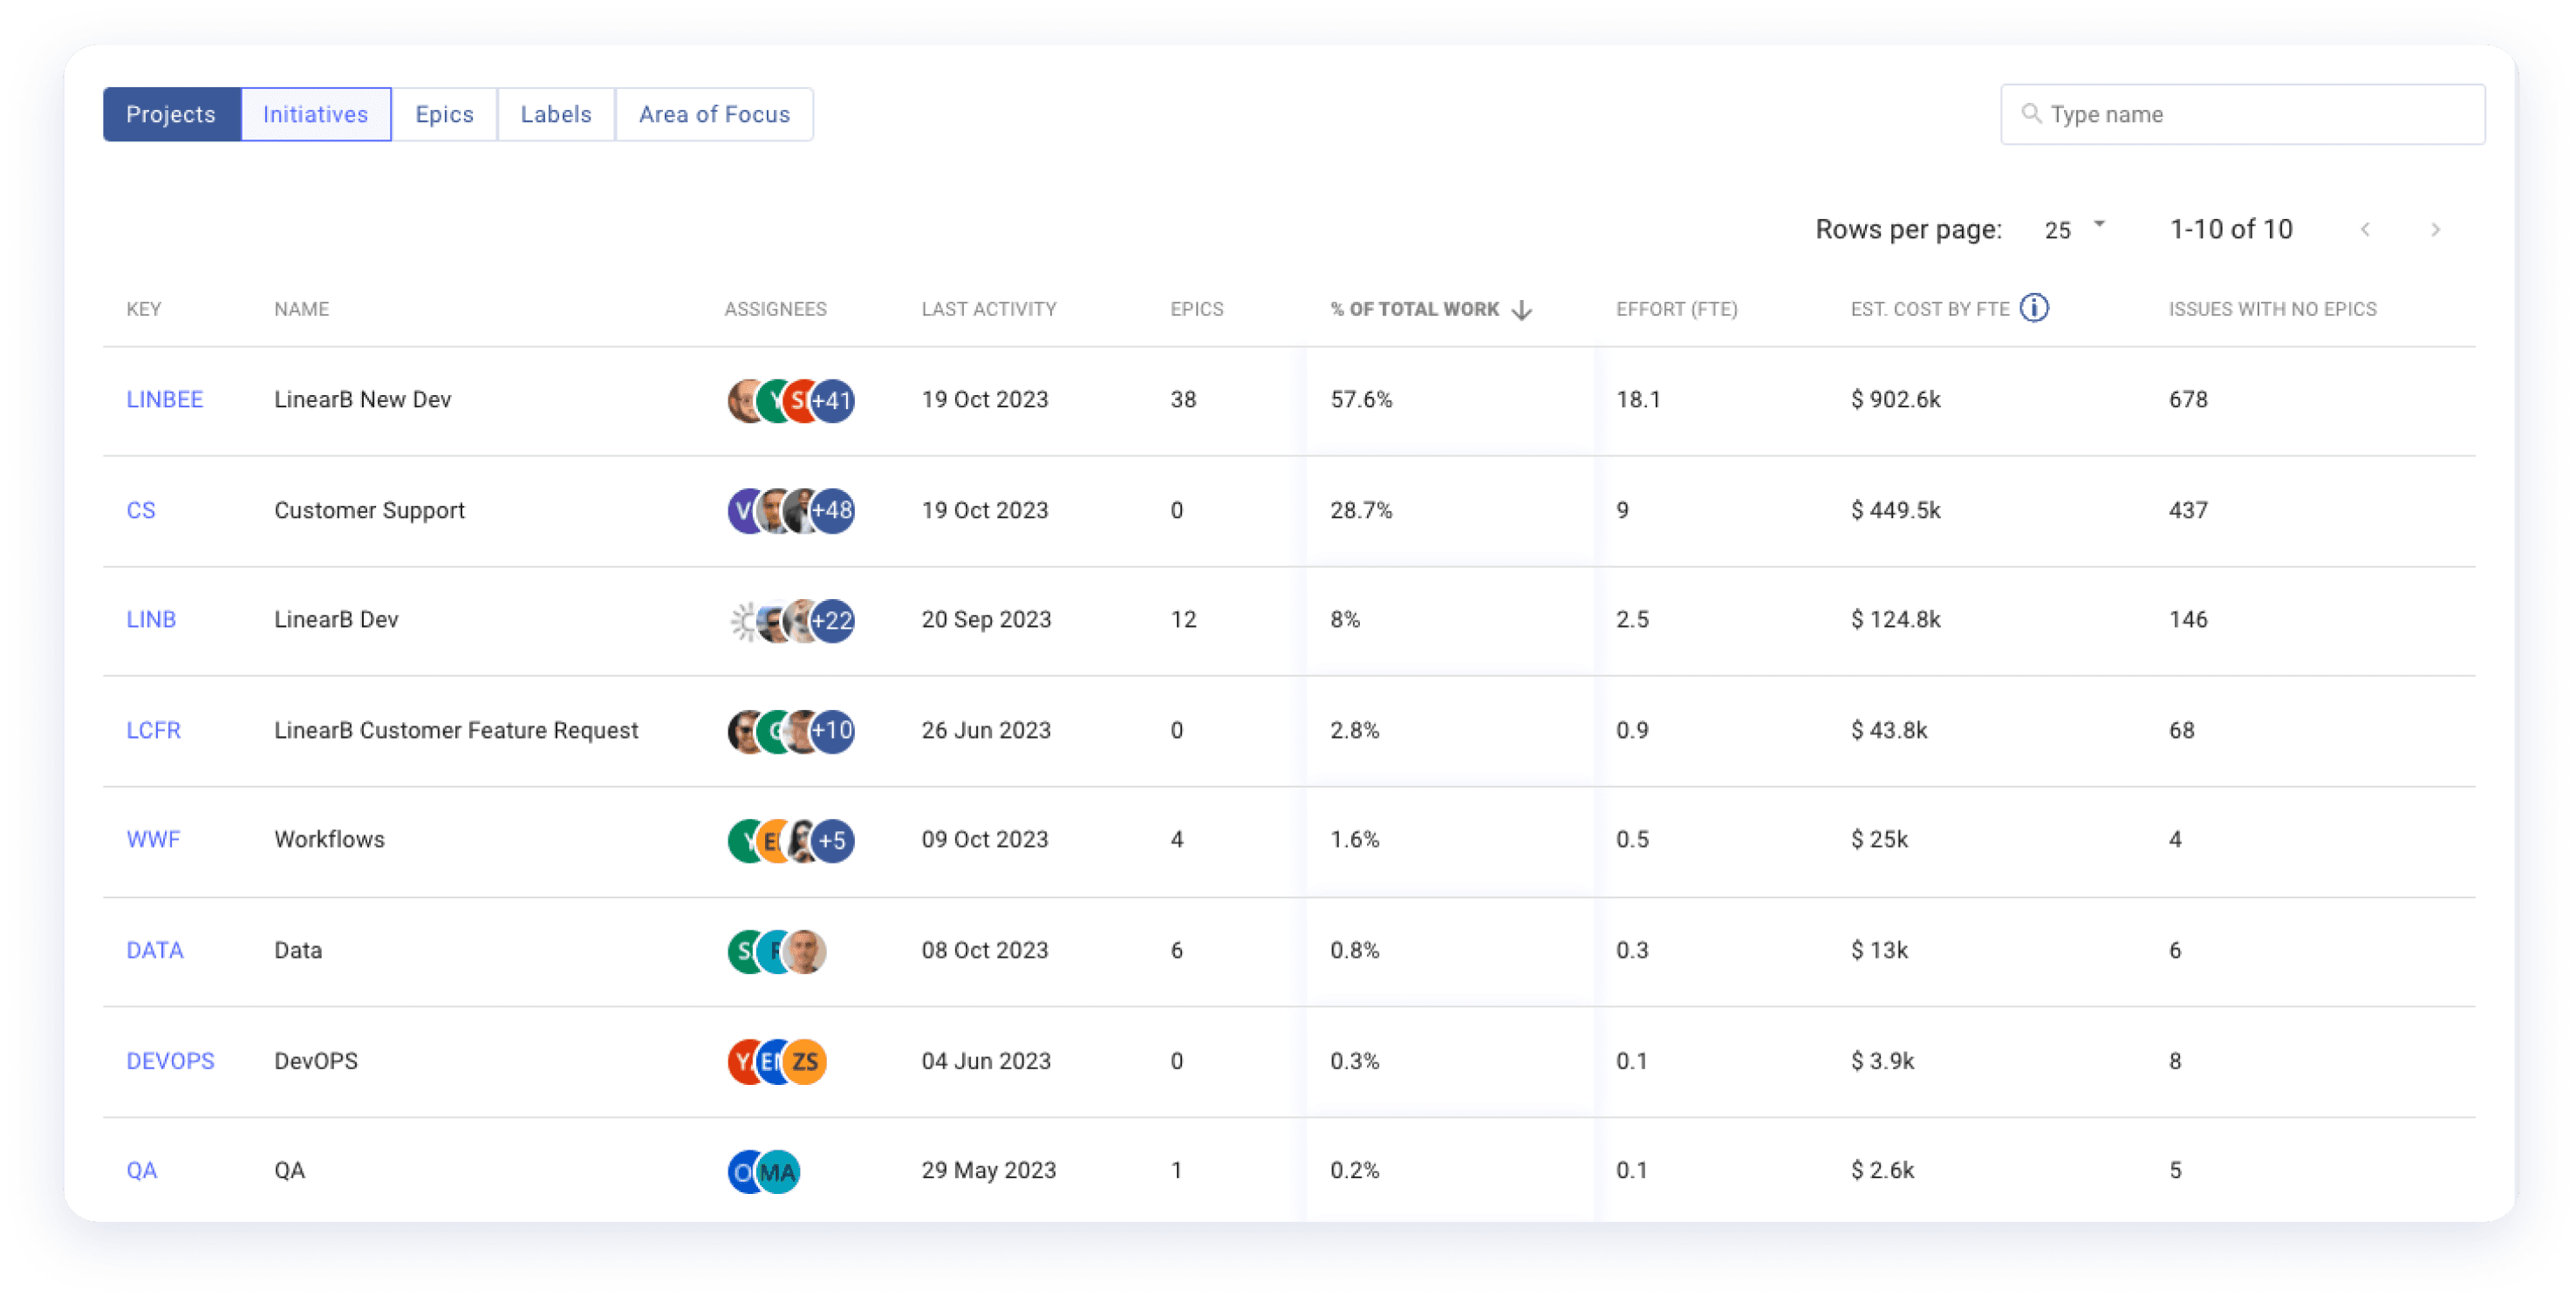
No company–or department within a company–is immune from economic downturns or recessions. Engineering is no exception. In the current climate of flat or shrinking budgets, every budget request for tooling or additional headcount must have a legitimate business purpose and the data to back it up.
When presenting to the business on the health, productivity, and prioritization of engineering work, leaders need to include both engineering efficiency and resource allocation data. Productive conversations can happen only with this complete picture, and people can give requests fair consideration.
Incorporating Engineering Resource Planning Into Your Metrics Program
In The Engineering Leader’s Guide to Building a Metrics Program we outlined the procedure for building a metrics program from scratch. Adding engineering resource allocation reporting to your metrics program is a similar process.
Step 1: Engineering Resource Allocation Metrics and KPIs
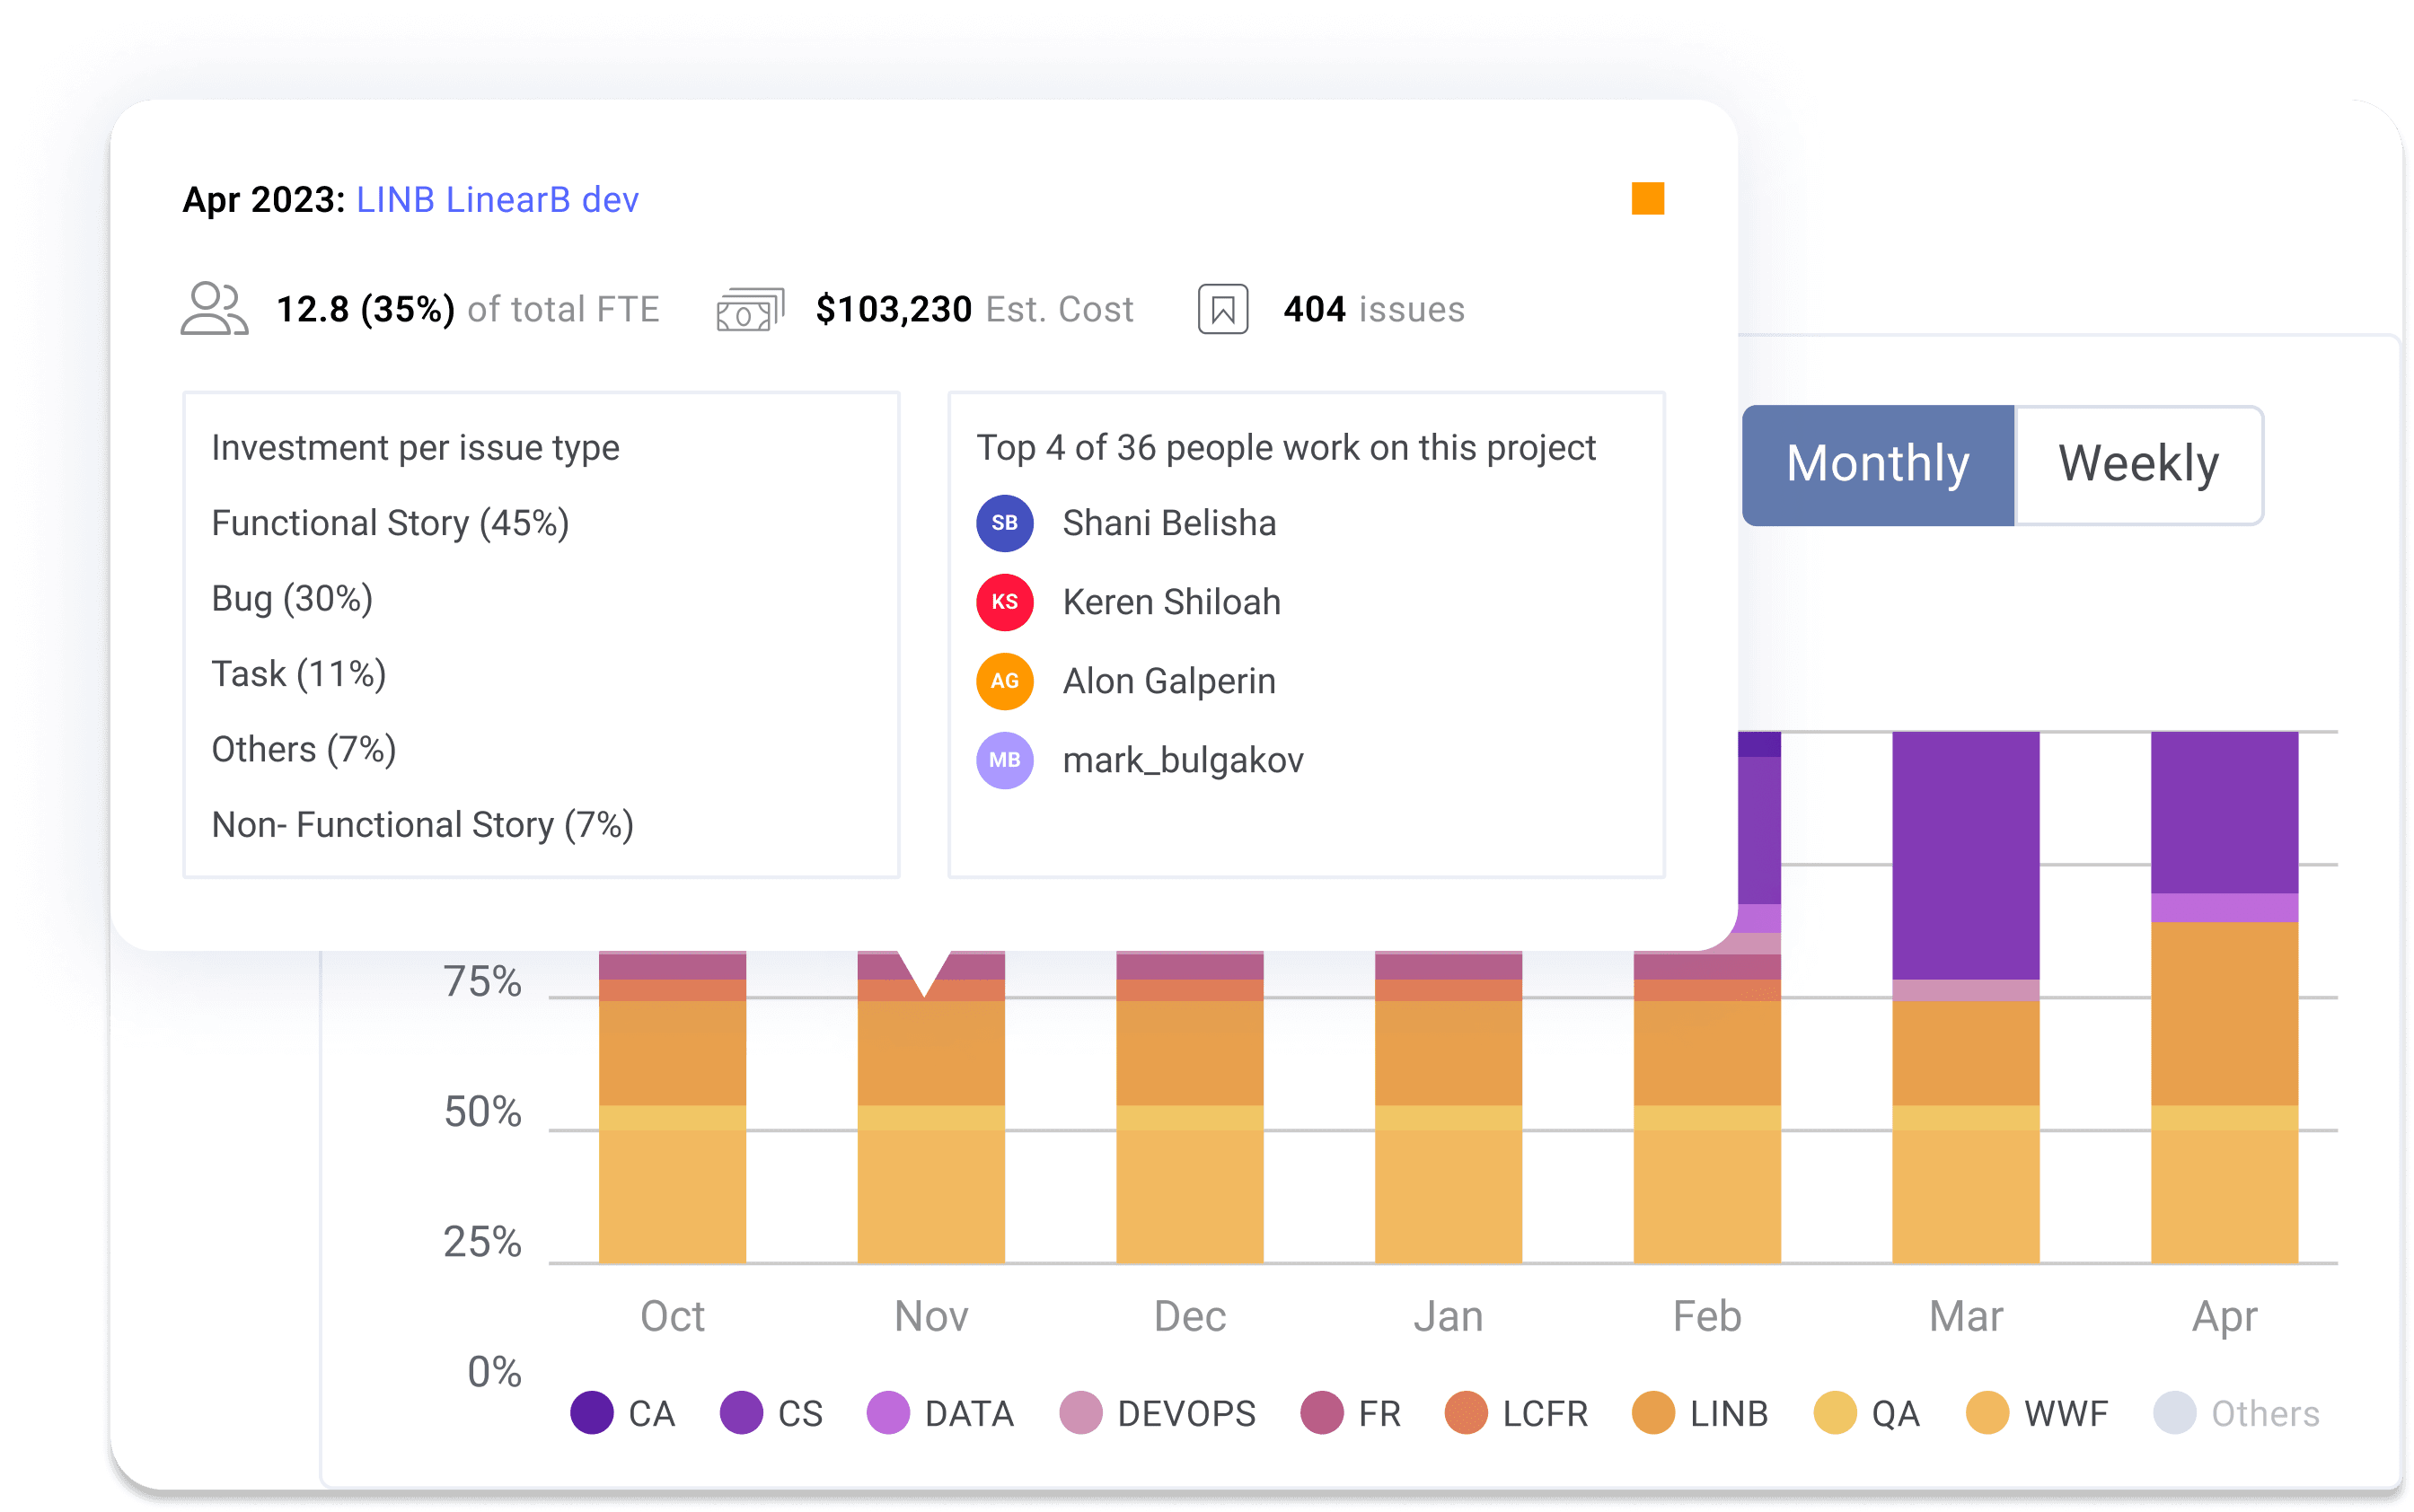
Goal: Understand how developer time is invested across your project portfolio.
How to get there: Start by digging into your project management boards to see where all your work is being done. Determine how your team catalogs work–by projects, initiatives, tags, labels, custom fields, issues, severity, or class–and account for all of it.
Did you know: An average of 30% of work is unaccounted for in Jira–meaning there isn’t a ticket or issue linked to pull requests. Correlate project data with your git systems to ensure you have full visibility.
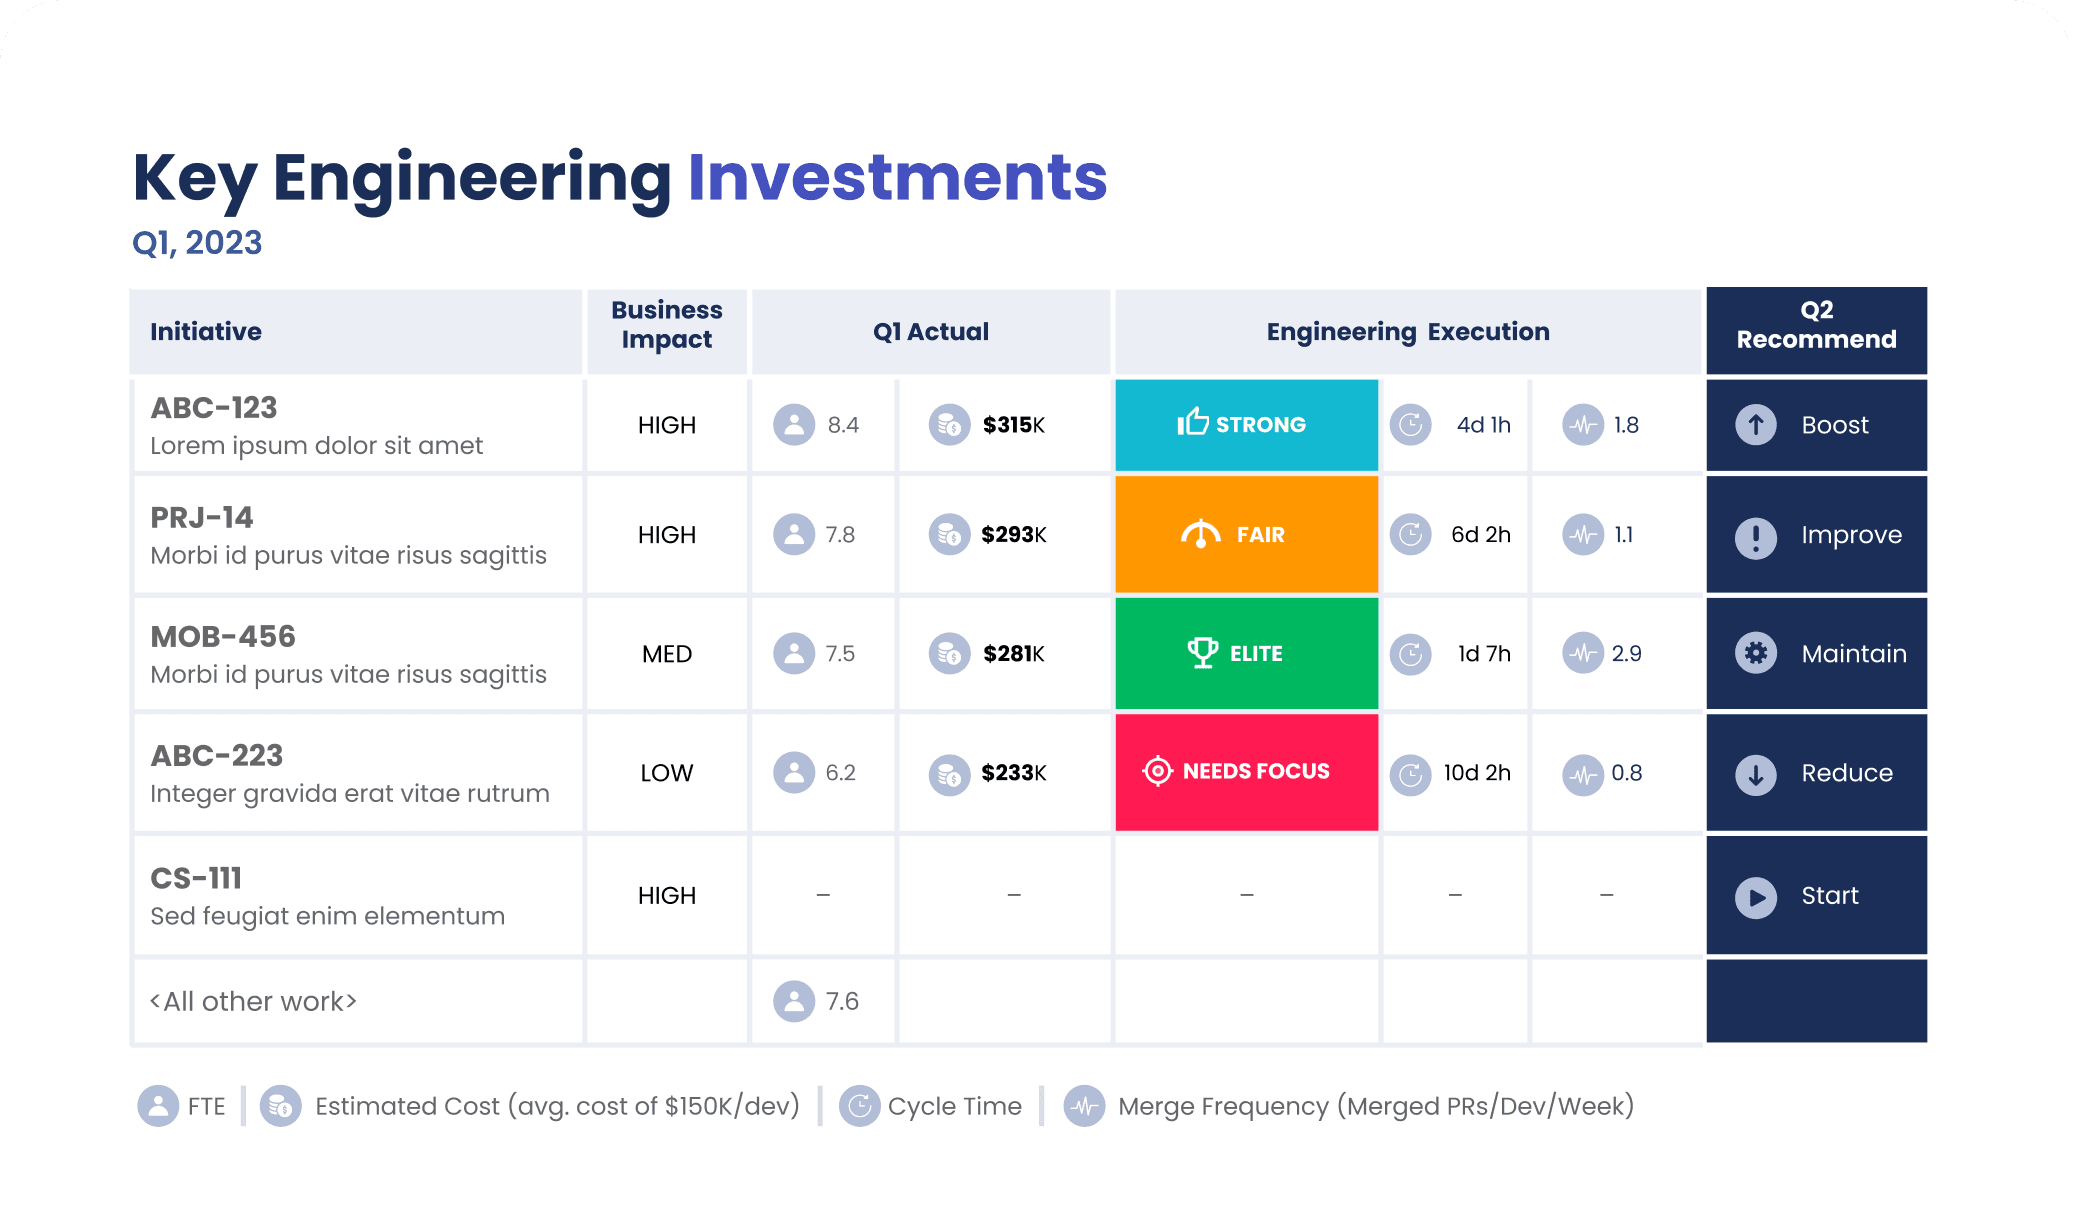
What you’re looking for: You want holistic project visibility that includes FTE count, issue type investment, and project forecasting/execution metrics. Then incorporate average salary with engineering resource allocation so you can present decisions, project progress, and recommendations in terms of actual costs that will resonate better with your business stakeholders (more on this later).
Pro tip: Include data on the impact of planned and unplanned work. Also, track and report team health indicators. This will ensure you balance work across teams and projects and avoid burnout when setting your strategy and goals.
Outcome: Holistic visibility of your projects and how they’re currently resourced. Now you’re ready to evaluate your current investments, report your findings, and optimize your strategy.
Get a demo of LinearB to learn how to automate the process of PM data collection, organization, and correlation with git data–all without changing how you structure your work.
Step 2: Evaluate Investments
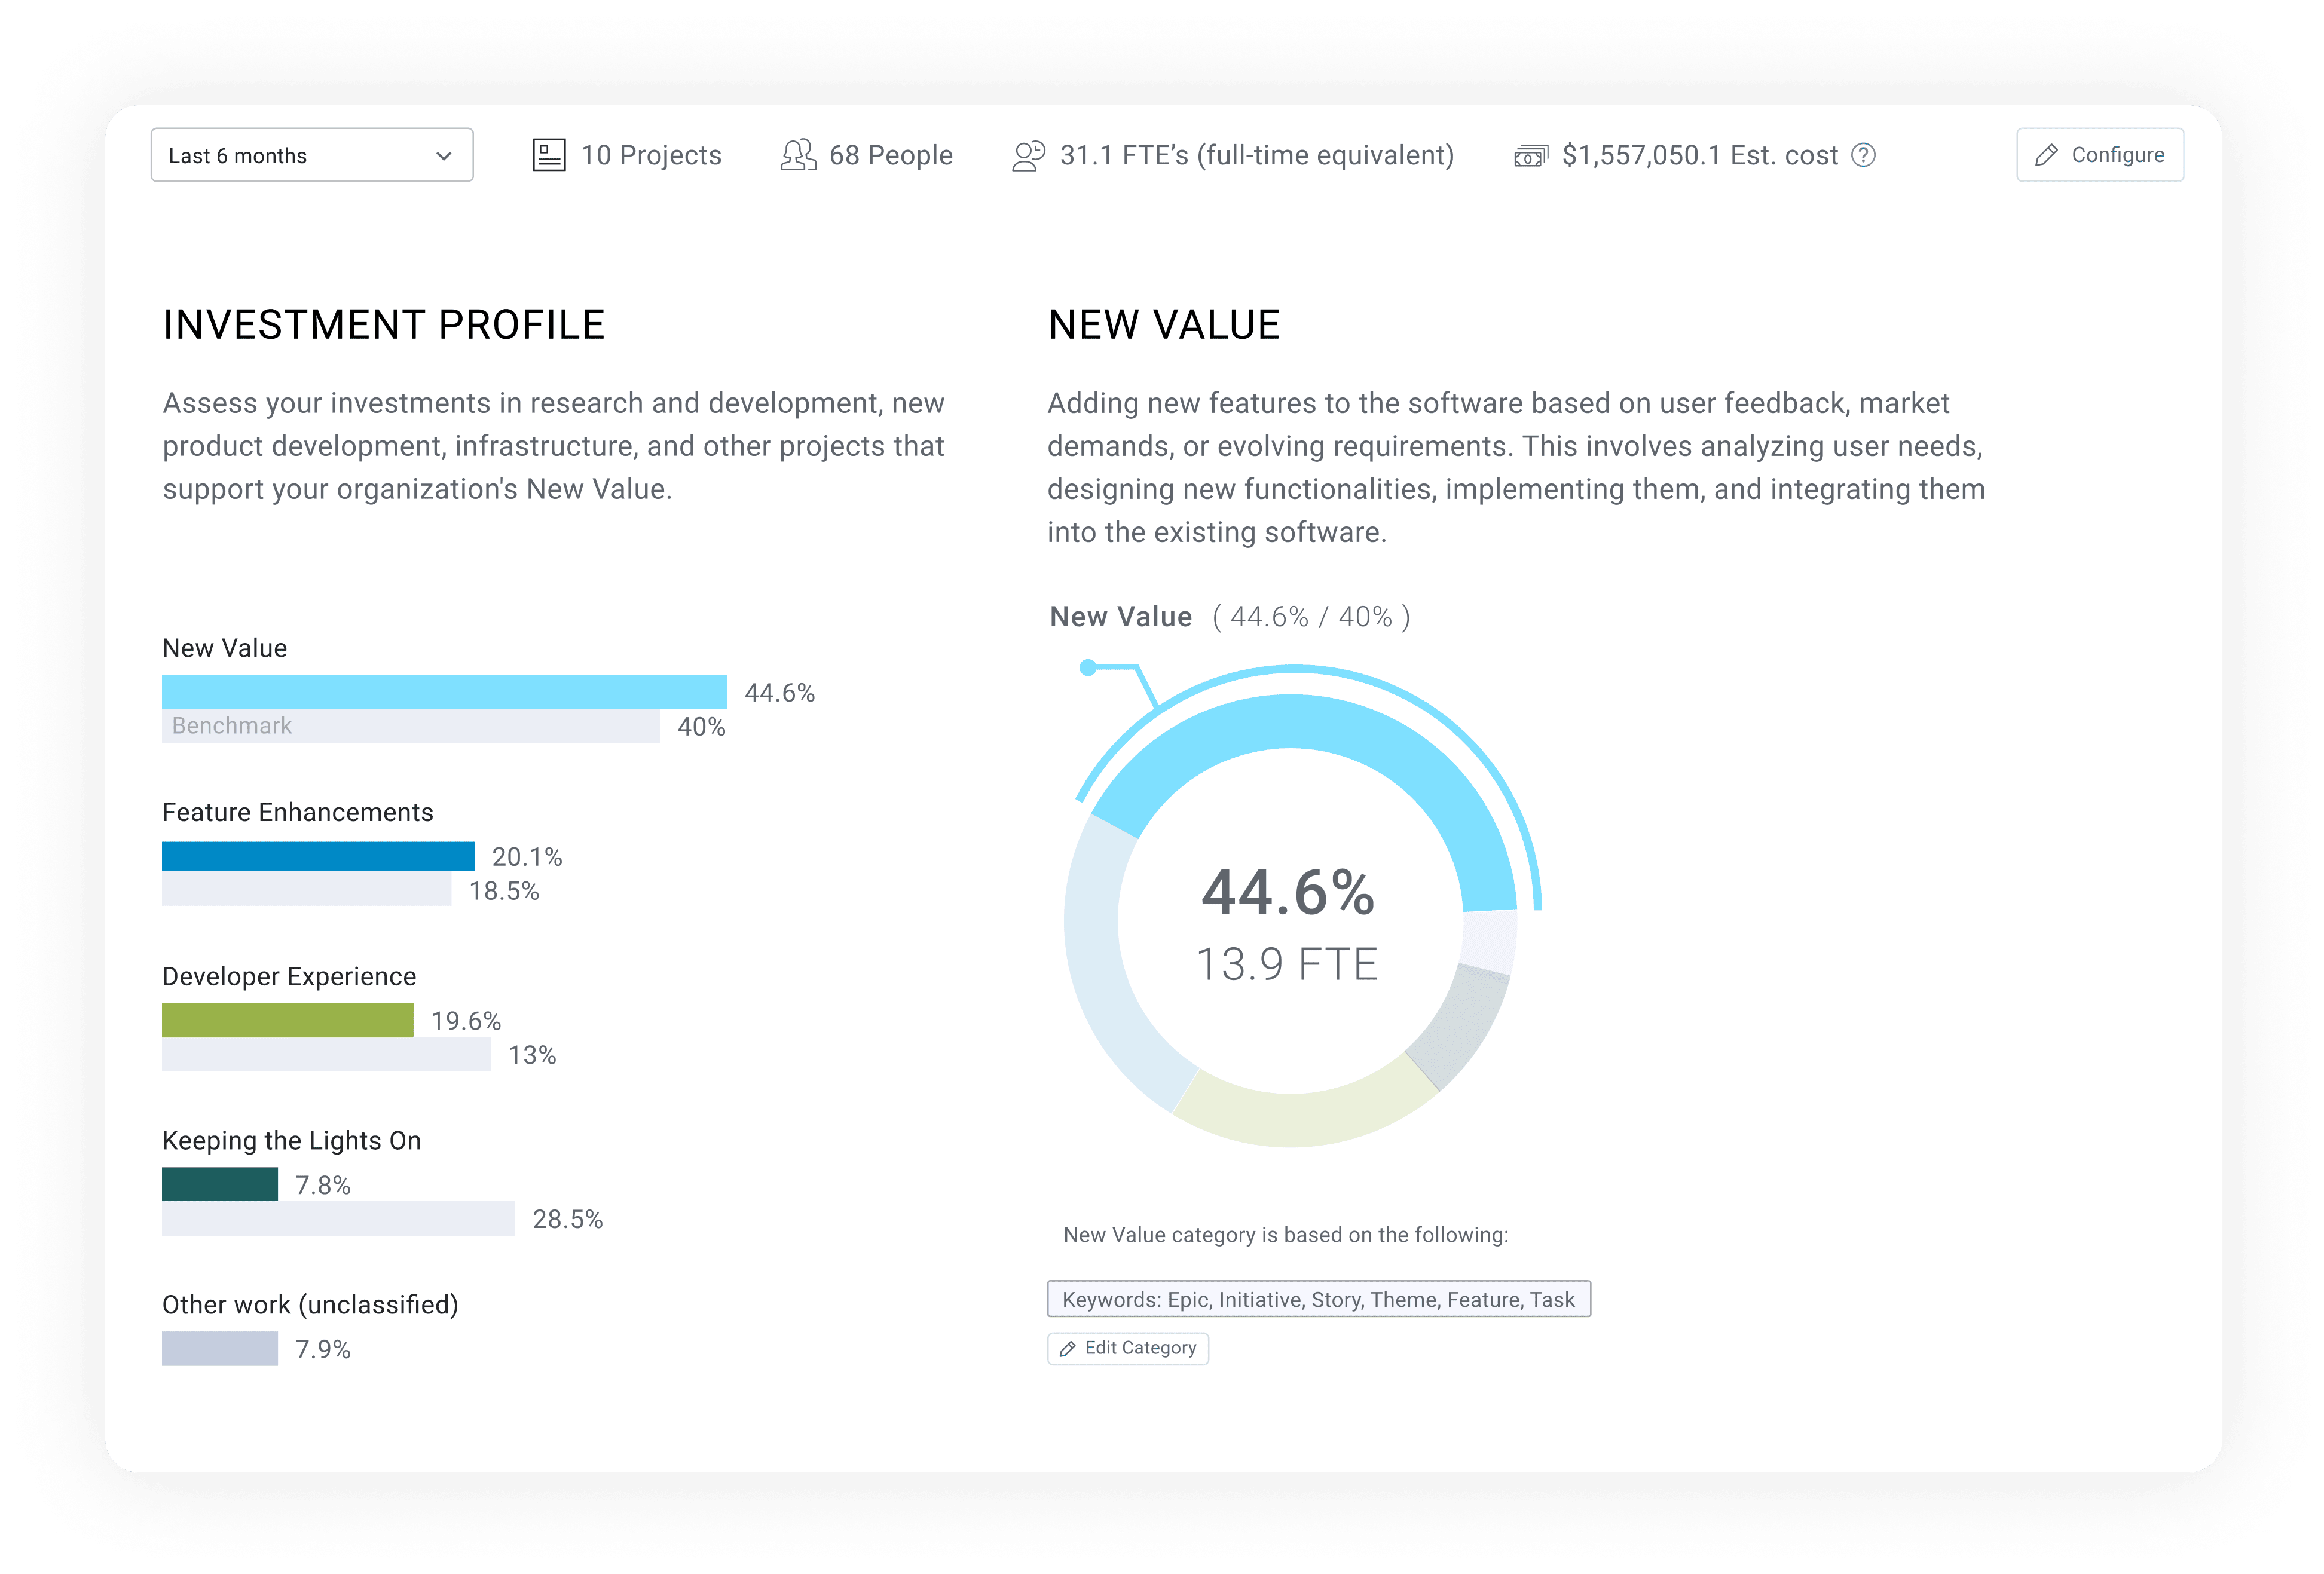
Goal: Prioritize your projects by high/low impact, examine current investments, and formulate initial recommendations on optimizing resourcing—basically, translate engineering to business.
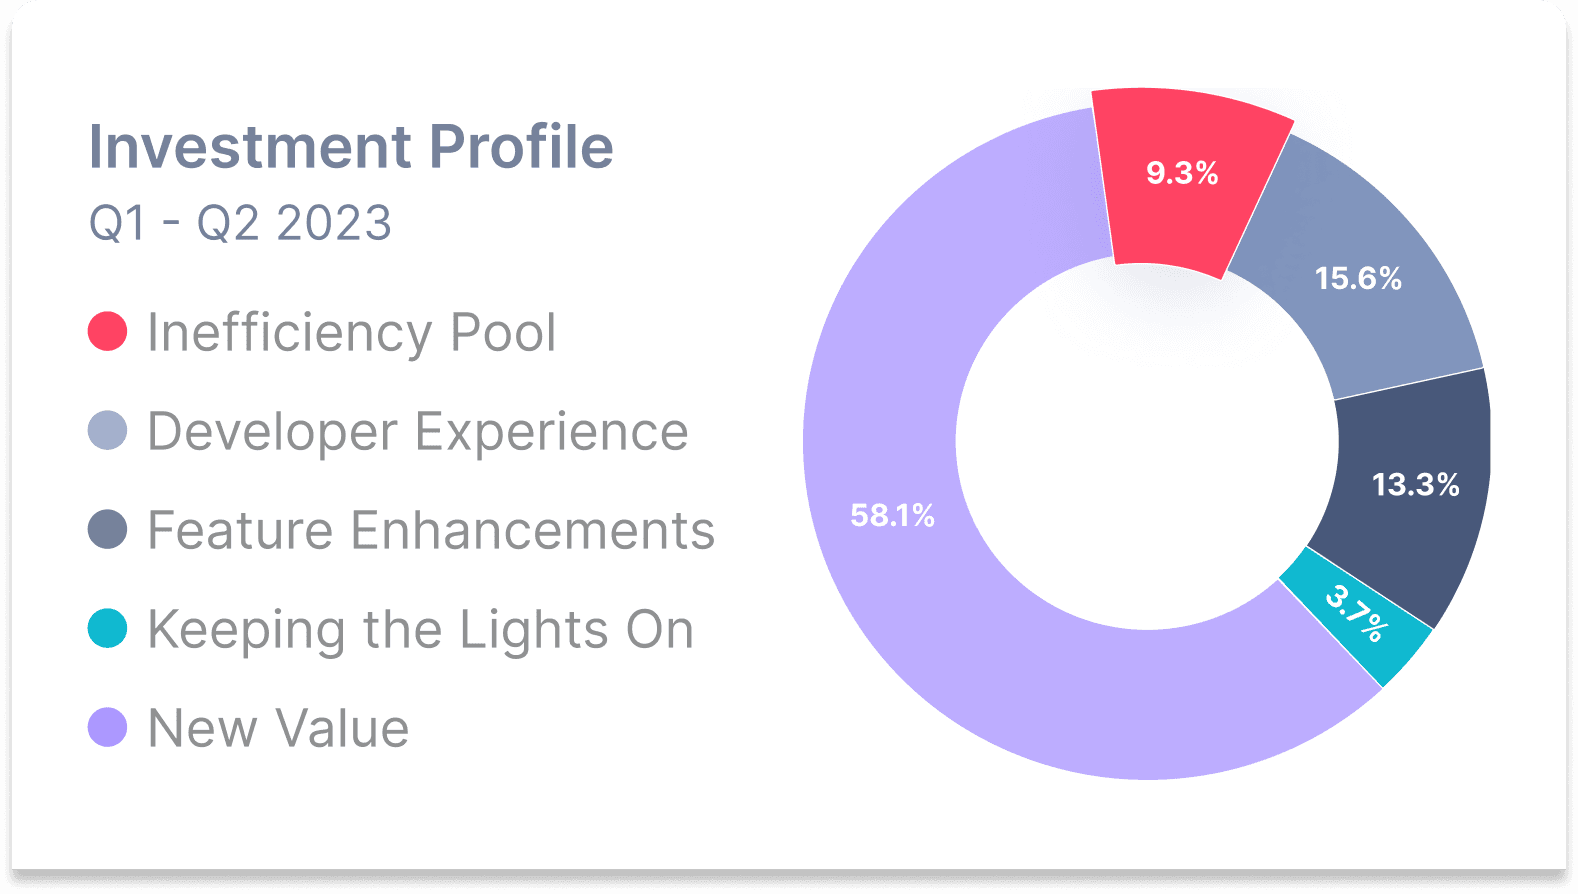
How to get there: After gathering all your data and bucketing the work into investment categories, it’s time to understand what your team is currently (and SHOULD be) focused on. Double-check to ensure that you account for and reflect all work in one of the listed areas below.
| KTLO: Minimum tasks a company is required to perform in order to stay operational, maintain stability, and meet stated SLAs. This might include activities such as: Maintaining current security posture, issue and ticket monitoring/troubleshooting, maintaining promised uptime, etc. | Developer Experience: Work that improves the productivity of development teams and their overall experience. Things like introducing better developer tooling, incorporating additional testing automation, restructuring code, and paying down tech debt to reduce KTLO bucket. |
| Feature Enhancements: Work to enhance features or deliver a product that ensures customer satisfaction. This includes activities such as: Customer RFEs, improved performance / utilization, better scalability, quality days, and improved reliability or security. etc. | New Value: Any investment in new features that increase revenue and growth by new customer acquisition or expansion. This might include activities such as: adding a new feature, supporting a new platform or partner application, implementing roadmap items, etc. |
| Inefficiency pool: Wasted effort due to common inefficiencies present in the SDLC–think context switching and/or idle time. This investment category is a prime candidate for reallocation of resources. | |
What you’re looking for: Overall insight, patterns, trends, benchmarks, and improvement opportunities for current investments, project allocation, and project execution that you can report to the business. A key category to closely evaluate is your “Inefficiency pool.” Tap into this inefficiency pool by setting goals to improve core impact metrics (like PR size and cycle time) and by leveraging workflow automation to boost productivity.
Outcome: A holistic understanding of investment profile, engineering resource planning, and associated costs that you can present to leadership around the business. You’ll also want to ask yourself, “Is this something that needs X# of developers?”. Determine high and low-impact projects based on the following evaluation criteria:
- Resourcing
- Execution
- Investment categories/benchmarks
- Business priority based on stakeholders’ feedback
Pro tip: When making project investment decisions, consider your engineering expertise (not just business priorities). Sometimes, things look good on paper but not in practice–like overindexing your investment in new-value projects and not leaving enough for keeping the lights on (KTLO) work.
Step 3: Report Findings to Your Team and Stakeholders

Goal: Get everyone aligned on engineering resource allocation and present recommendations for moving forward.
How to get there: Start by identifying and reporting on the delta between investment % trend vs. expectation. Begin at the organization level for an audience like your board of directors, then go deeper into individual teams and project investment. To make these reporting sessions go smoothly, plug your data into this template.
Bringing consistent metrics to the staff meeting each week will help you transform the “mysterious” development process to a well-understood function in the business.
What you’re looking for: When reporting your findings about your approach to managing resources across multiple projects, try to answer common questions business stakeholders are likely to ask. Here are some examples:
- Is feature XYZ likely to ship by the promised date, given current resourcing and operational trends?
- How quickly are we shipping new value to customers, given that our current investment in new value is below the recommended 60%?
- Why aren’t we allocating more to paying down tech debt when we have so many high-risk items open?
Outcome: Establish a regular cadence on allocation analysis and reporting with key stakeholders–we recommend weekly. LinearB has an automated report that goes directly to your inbox to make this process easier. Make sure to include any supporting detail for why resourcing is the way it is (like observed gaps that warrant a sprint of quality days, team health considerations, needs for better developer experience, etc.)

Once that’s done, work with your teams and the rest of the business to determine allocation criteria and configure engineering resource allocation benchmarks (what you should/want to invest in projects).
Step 4: Set Your Strategy & Goals
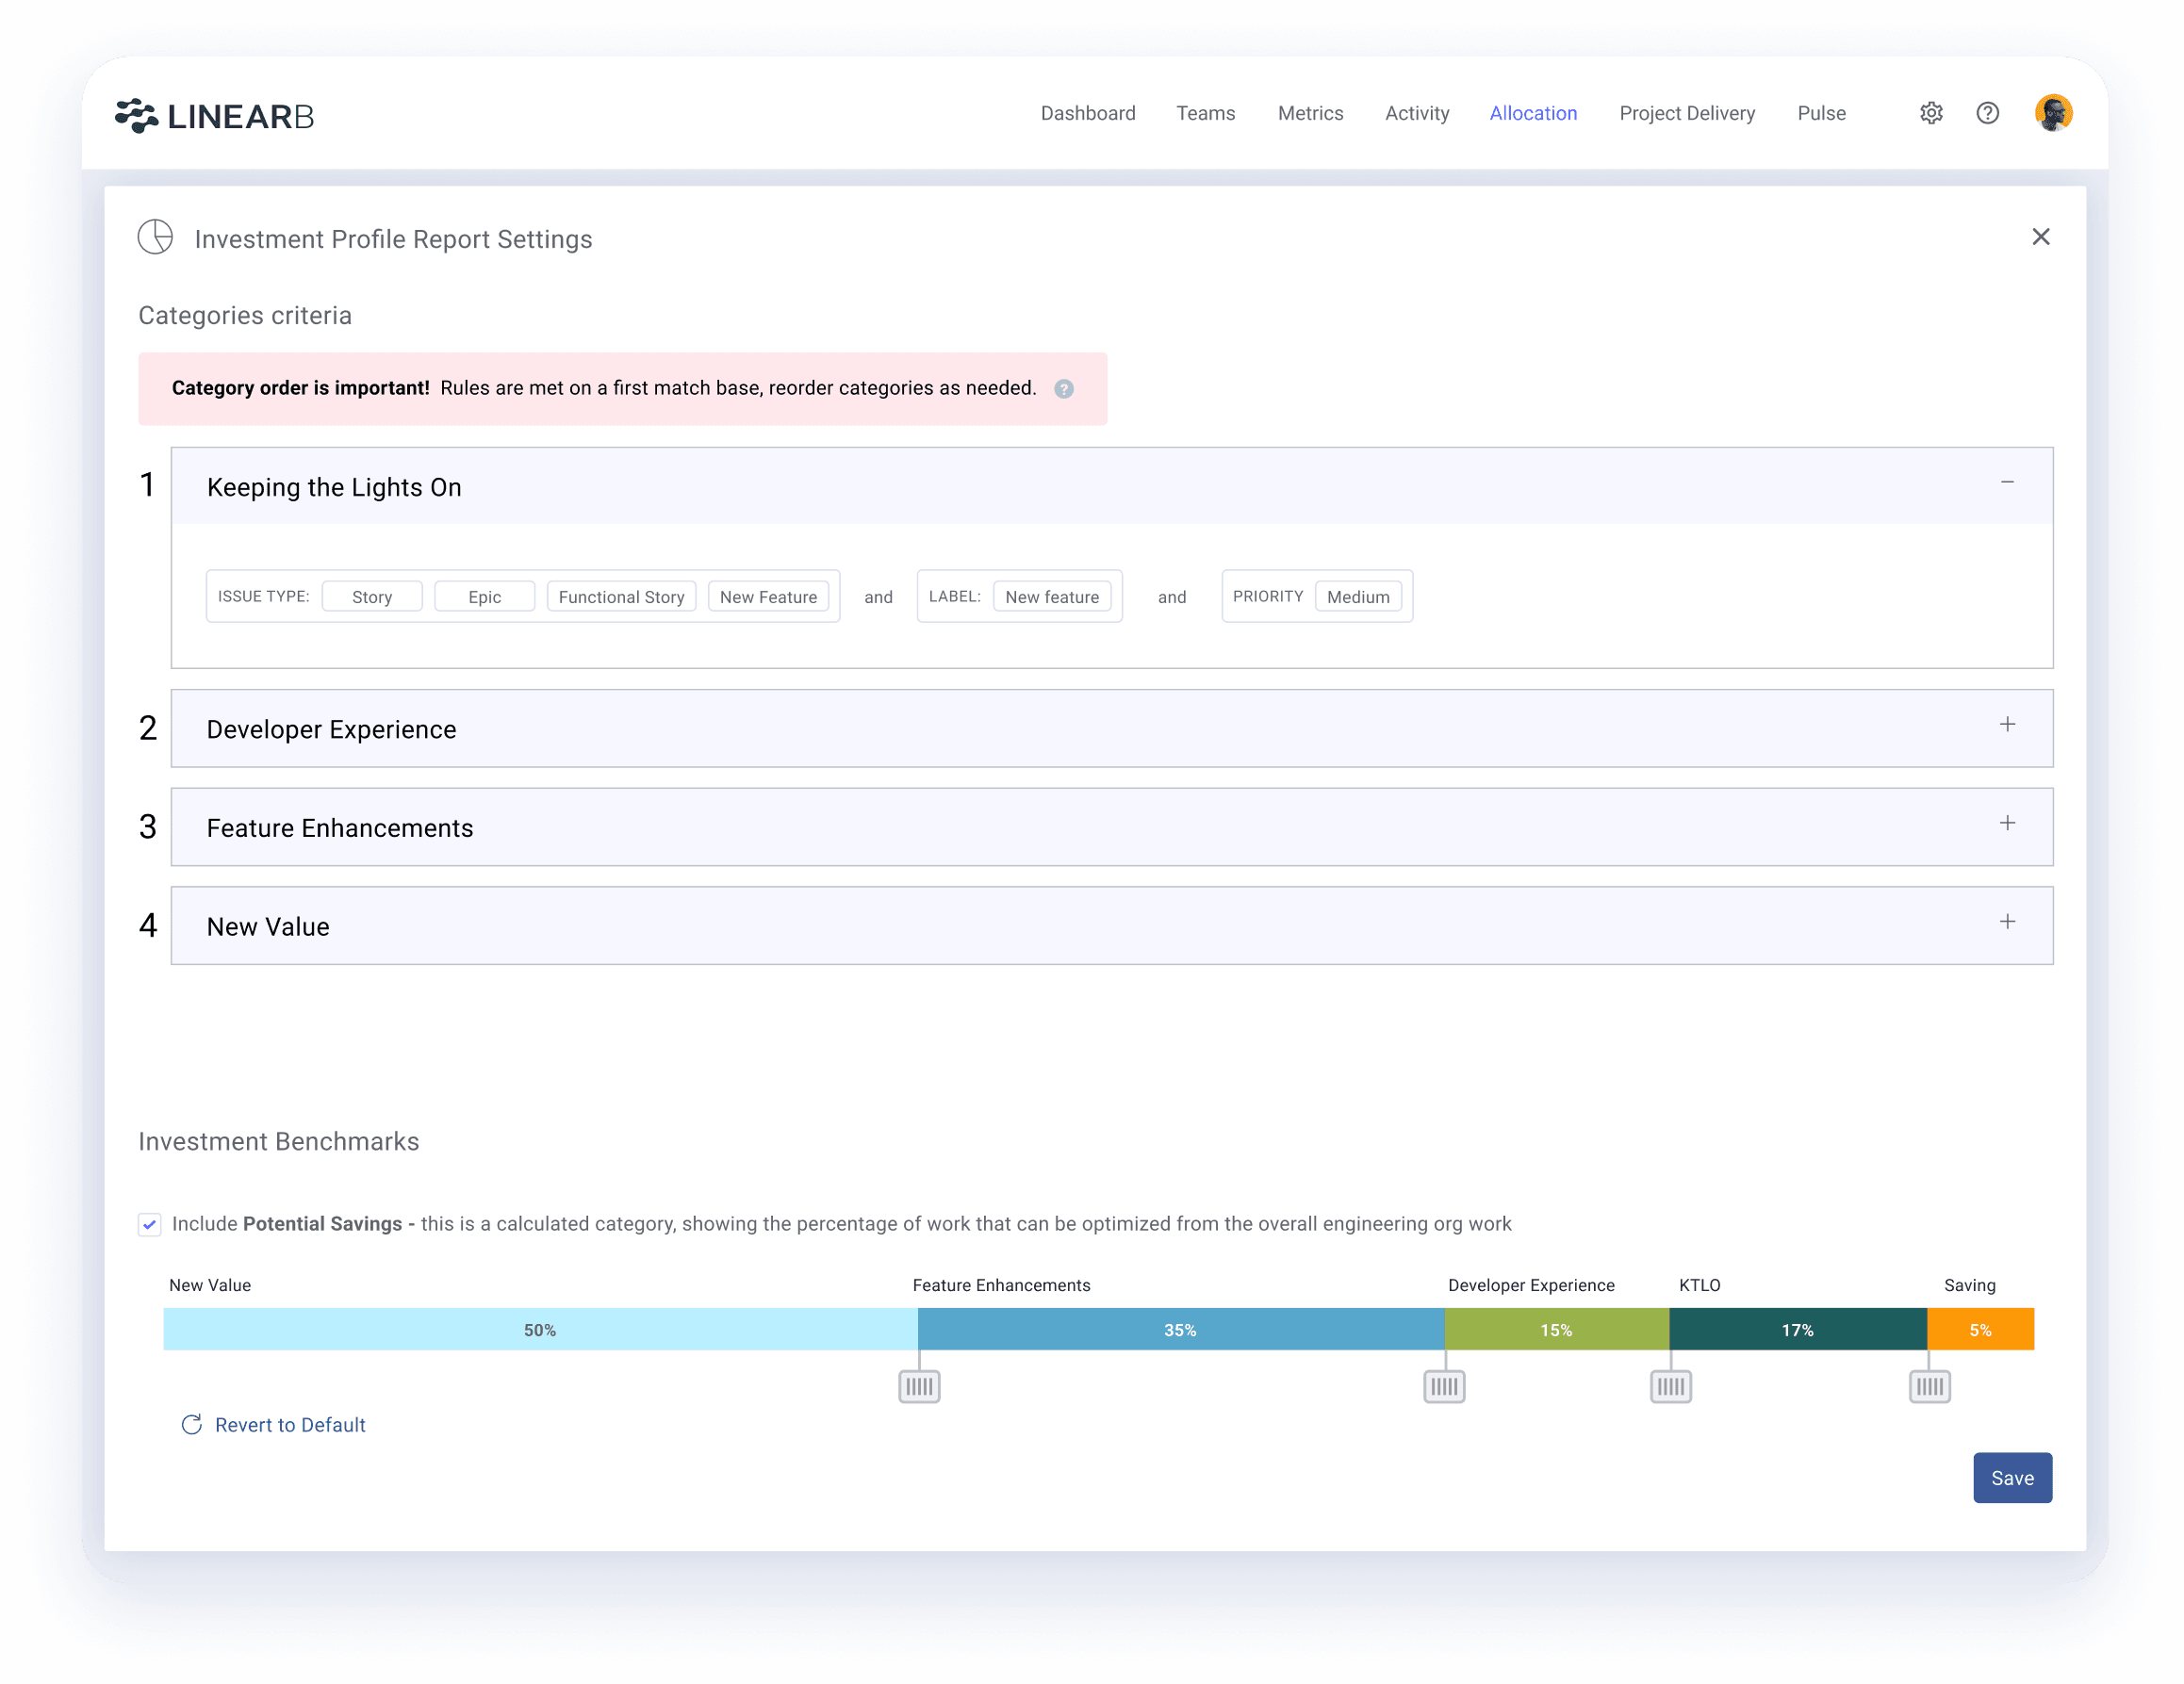
Goal: Use investment benchmarks, current trends, identified opportunities, business needs, and stakeholder feedback to implement effective engineering resource allocation strategies.
How to get there: Use the results from your reporting session to actually implement project prioritization and investment benchmarking.
What to look for: Use this allocation for a quarter (though change what is obviously not working) and remember it’s a single data point in your overall strategy. You’ll also want to look at engineering resource allocation with additional context like:
- Project delivery and predictability impact
- Effect on operational metrics across teams/projects
- Cause and effect patterns like the impact of reducing DevEx investment on KTLO work
- Observed performance and trends to make reallocation recommendations for the next quarter
- Any continued work on low-impact/deprioritized projects–these are opportunities to refine your allocation mix
Pro tip: It’s normal for priorities to shift and needs to change. If the team flags something (like not enough investment in developer experience), consider that when setting and adjusting allocation and investment benchmarks on the fly.
Outcomes: Once you’ve observed how your resource allocation mix impacts efficiency, quality, and overall engineering health, you can begin optimizing. Set your strategy and improvement goals (this will cascade down to operational metrics) for the next quarter.
Continue to deprioritize low-impact projects, invest in business needs, focus any efficiency gains on New Value, and work to align more closely with investment benchmarks.
Then, you’ll repeat the process of observation, reporting progress against strategy, optimizing engineering resource allocation, and setting goals for improvement.
Common Pitfalls to Avoid
Historically, engineering leaders were missing visibility into key factors such as work type investment (new value vs. KTLO), project costs, allocation across projects, and overall alignment to business needs. When working to bring resource allocation into a metrics program there are risks that you should be aware of and work to mitigate:
- Data availability and hygiene
- R&D speaks one language, the business speaks another
- Revenue visibility and engineering’s distance from it
Data Availability and Hygiene
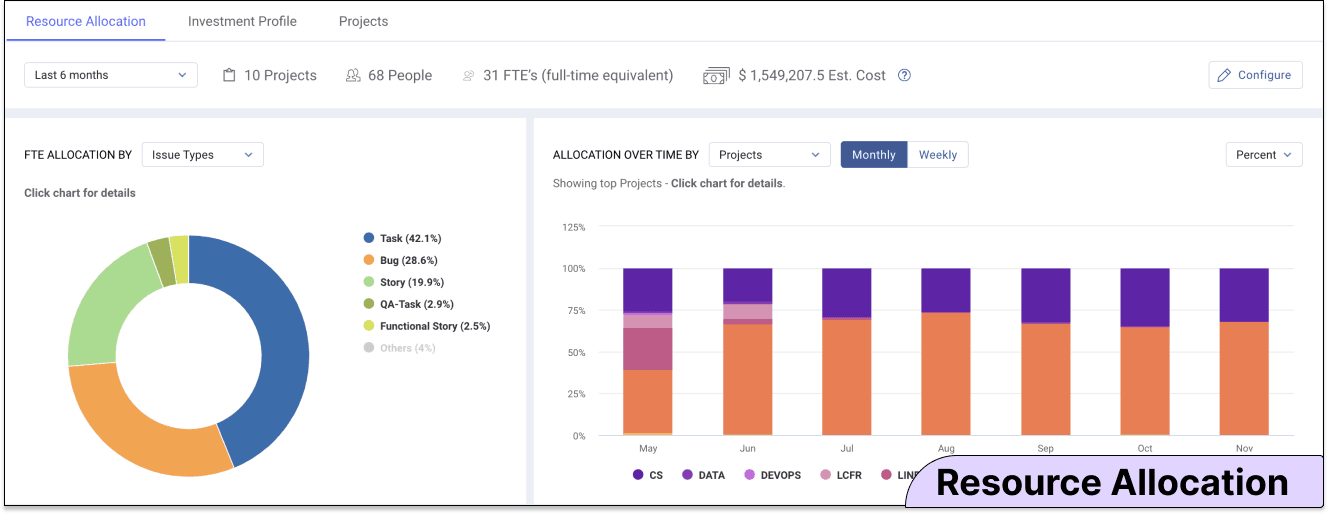
Sales leaders have Salesforce and marketing has Marketo. Where do engineering leaders go every morning to assess project health and impact on the business?
Getting visibility into engineering resource allocation, spending, ROI, etc. has historically been a struggle because data is not always at leaders’ fingertips, requires other departments (like HR), and there’s always the question of whether the data can be trusted.
Identifying whether your organization’s resources are appropriately allocated and whether you’re focused on high-impact projects requires a lot of manual effort and a significant time investment.
Difficulties Translating Engineering Data into Business Outcomes
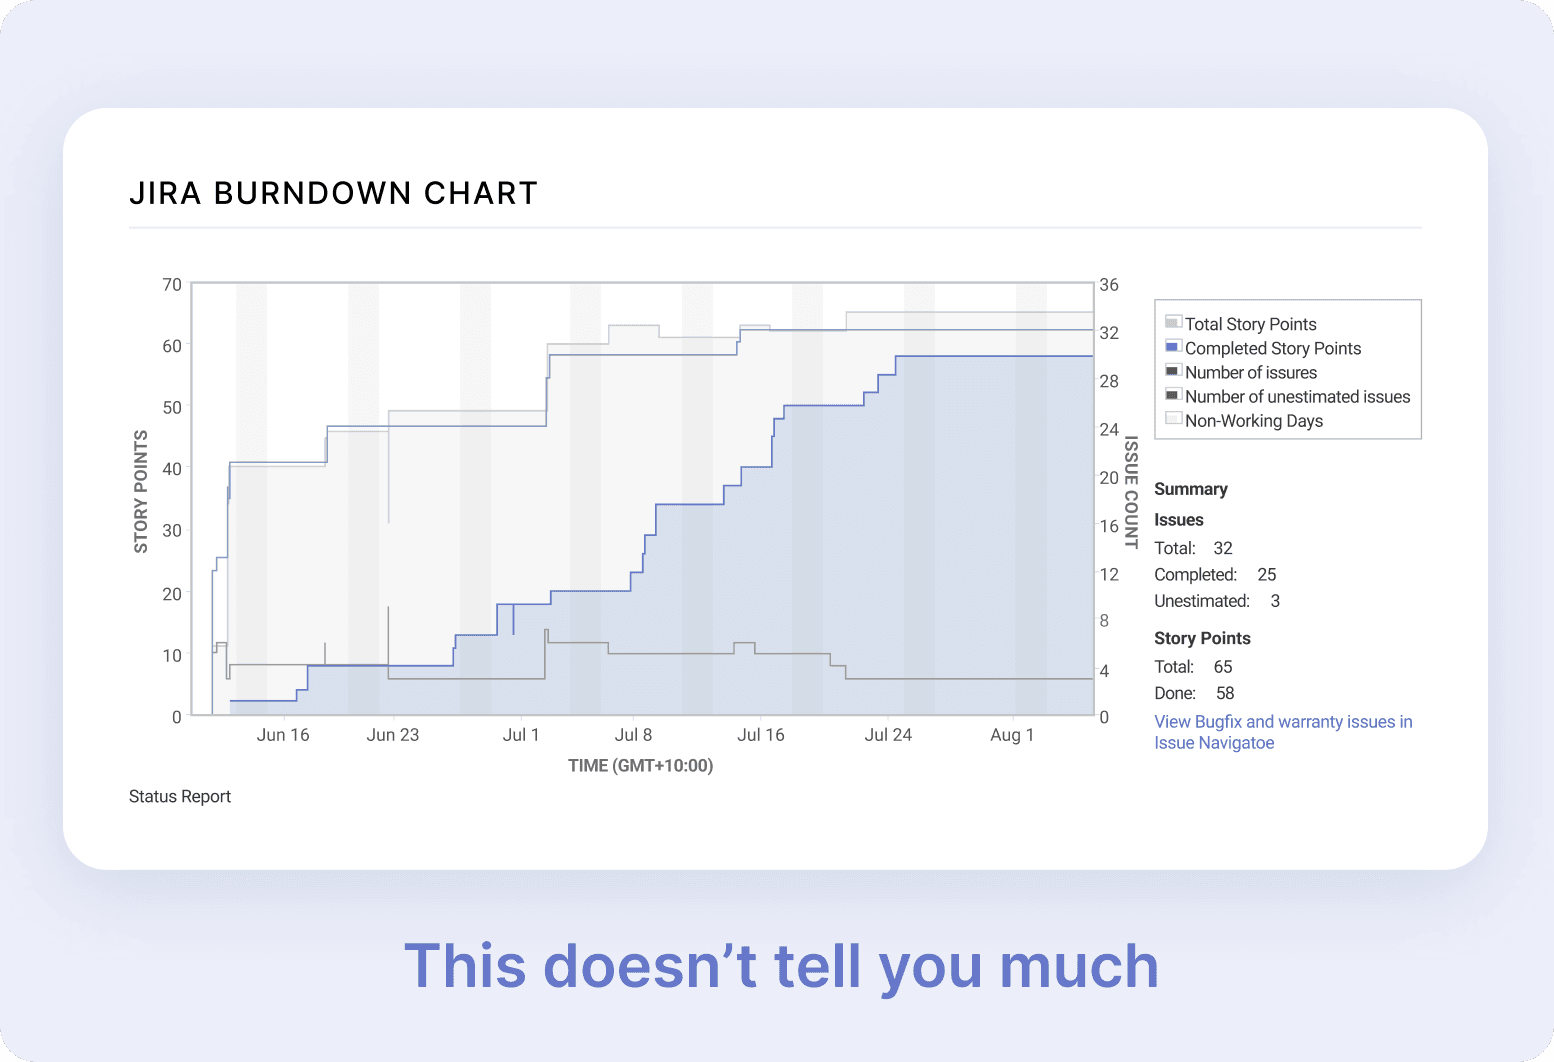
One of the hallmarks of a great engineering leader is their ability to translate engineering to executives and the rest of the business–kind of a development Rosetta Stone. Things like velocity, story points, and lines of code just don’t resonate with sales or marketing teams. And unfortunately, these were standard metrics for health and productivity just a few short years ago–in fact, some teams still use them.
Generally speaking, business stakeholders are only interested in engineering data when it can answer three questions:
- Will you deliver what you promised?
- Will you deliver it on time?
- Are you working on things that will move the needle for the business?
Engineering is the Furthest Away From Revenue Visibility
Because there isn’t connective tissue between engineering work, costs of projects/initiatives/epics/etc., and the bottom line, engineering has struggled to provide quantitative ROI, showcase alignment to business priorities, and make the case for additional headcount/budget with data.
There just isn’t visibility (or at least not easily produced and understood visibility) into what engineering is working on, how their projects are resourced/prioritized, and what “should” be resourced and prioritized.
—----------------------------------------------
Engineering resource allocation isn’t just a matter of managing costs—it's a strategic driver of business outcomes. By implementing effective resource allocation strategies and incorporating them into a holistic metrics program, engineering leaders can optimize project prioritization, enhance team productivity, and ensure alignment with business goals. Visibility into how resources are allocated enables better decision-making, and the ability to deliver high-value projects on time and within budget, ultimately contributing to the company's success. For even more insights, explore our comprehensive guide on engineering resource allocation.

