I’m a big advocate for the DORA 4 metrics. When used in the right context, they’re a powerful tool to drive engineering improvement. But, as a community, we’re using them incorrectly.
DORA Metrics Defined
The DORA 4 metrics are from Accelerate, a popular reference guide for engineering leaders.
Designed to help engineering teams figure out: A) What it looks like to operate as an elite team; and B) How they compare to the industry, the DevOps Research and Assessment (DORA) group established four metrics:
- Deployment Frequency
- Cycle Time (sometimes called Lead Time for Changes)
- Change Failure Rate
- Mean Time to Restore (sometimes called Time to Restore Service)
In their words:
“Deployment Frequency and Lead Time for Changes measure velocity, while Change Failure Rate and Time to Restore Service measure stability. And by measuring these values, and continuously iterating to improve on them, a team can achieve significantly better business outcomes.”
Herein lies our problem…
We’re Using DORA Metrics Incorrectly
Measuring DORA metrics do not, on their own, lead to improvement or better business outcomes. There are three reasons for this.
1. Your business doesn’t know how to translate DORA metrics to anything they understand or care about.
Cycle Time and Deployment Frequency, for example, show how fast small chunks of work travel through your pipeline and get released to production. That doesn’t help your business because all they care about is how quickly entire features take to get built and released and how many entire new features you can release every month/quarter. Plus, it doesn’t matter how quickly you release work if you aren’t building what the business and customers want.
2. DORA metrics are lagging indicators of velocity and stability.
In order to actually improve them, there’s an additional set of leading indicator metrics we need to measure and improve like pull request size, review time and code churn.
3. Sustained improvement in engineering organizations doesn’t happen without bottom-up change from developers.
I was a developer once (not that long ago) and most developers I know aren’t interested in being called into meetings and shown dashboards. Real change comes from optimizing workflows where developers spend all their time – in the IDE and in Slack.
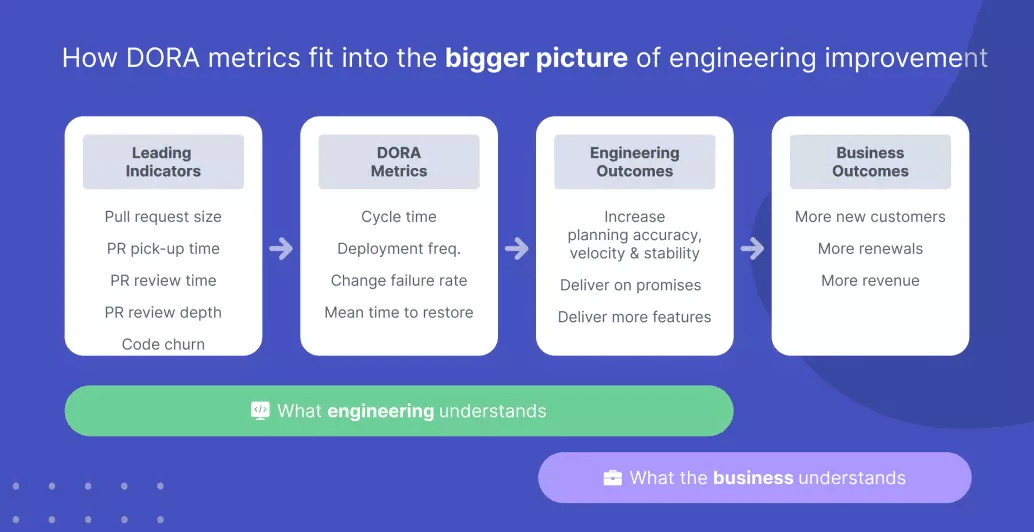
To connect the dots between DORA metrics and better business outcomes, we have to stop treating them like the be-all-end-all and look at the bigger picture of engineering improvement.
How Do Engineering Teams Deliver Value?
Some say engineering teams should measure success based on business outcomes like revenue. It’s a nice idea. But in the real world, it’s pretty hard to connect the dots from engineering directly to profits. And that’s okay because there are two proxies for those business outcomes we can control and measure in engineering.
Value Variable 1: Deliver More Features Faster
Speaking as the CEO of a fast growing startup, shipping new features faster is almost always the number one thing I want from engineering. New features help sales close new deals and help customer success secure renewals – both 👏 translate 👏 to revenue 👏.
More specifically, there are three things I’m looking for from our engineering leaders:
- Can we ship incrementally more value with what we already have?
- Can we ship significantly more value after we invest in new engineers?
- Are we delivering the features the business asked for?
The first two are about speed and predictability. The third is about alignment.
Value Variable 2: Deliver on Promises
A really important, highly underrated way engineering organizations provide value is just by following through on what they say they’re going to do. When I was a VP of Engineering, I remember constantly having to change dates and lower expectations in the exec meeting. If we’re constantly apologizing for missing commitments or have lots of bugs & incidents affecting customers – it 👏 hurts 👏 the 👏 business 👏.
Two Non-DORA Metrics Great for Showing Engineering Outcomes
Since the goal is to deliver on promises and deliver more features faster, our process for improvement has to start with our projects. Projects, initiatives, epics, features—whatever you call them at your organization—are the shared language between engineering and business.

So, how does the business know we’re meeting our commitments on the projects they care about?
It helps to report these two metrics on a regular basis:
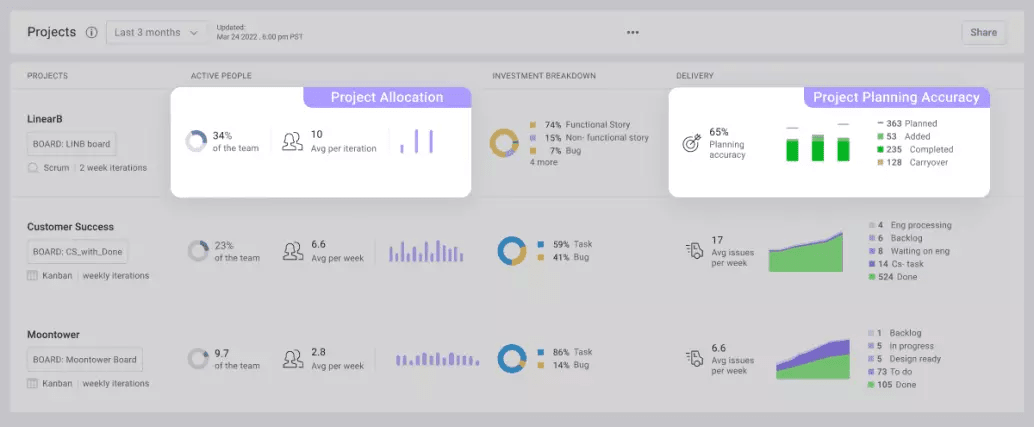
Money Metric 1: Project Allocation
Project Allocation answers the question “what % of our team is working on each of our projects?” CEOs love this metric because it quickly shows if engineering is working on the things the business cares about most. Remember, it doesn’t matter if you’re delivering more features if they’re the wrong ones. You’ll love this metric because it brings logic to negotiations about how much work your team can do. If you get asked to take on a new project, you can point to the project allocation report and say “Absolutely. Which of these existing projects should we invest less in?” And it can give you a rational foundation to ask for more headcount.
Money Metric 2: Project Planning Accuracy
Project Planning Accuracy answers the question “are we going to hit our promises for this project?” A LinearB Labs research study found that the average sprint planning accuracy across 1,900 teams running Scrum in 2021 was 46% 😲 You’re never going to deliver the features you promised over the course of a quarter if the teams contributing are delivering <half of what they planned every 2-3 weeks.
What about Project Velocity? Some teams use this metric to answer the question “are we moving faster or slower on project XYZ?” Be careful. Not all issues and story points are equal and velocity can be abused if not used carefully.
Connecting the Dots Between DORA Metrics & Engineering Outcomes
Once you have a baseline for Project Allocation and Planning Accuracy, you can start to improve them. This is where DORA metrics become useful.
Cycle Time & Outcomes
Cycle Time is the measure for how quickly chunks of work flow through your development cycle. Faster cycles mean fewer process bottlenecks and more predictability.
This is why low Cycle Time is the number one leading indicator for high Planning Accuracy. More than half of teams surveyed in the LinearB Labs study had a Cycle Time of more than nine days. If those teams are running two-week sprints, that means any work they haven’t started coding by the fifth day of the sprint is likely getting carried over.
Deployment Frequency & Outcomes
Deployment frequency indicates how often new work gets released into the hands of customers. It’s a critical leading indicator of Planning Accuracy. Low deployment frequency means it takes longer to get new features, usability enhancements and bug fixes into production.
Change Failure Rate (CFR), Mean Time to Restore (MTTR) & Outcomes
These two metrics aren’t just good proxies for measuring customer experience. Yes, having fewer production incidents and fixing them faster will make customers happy. But, low CFR and MTTR translate to less unplanned work which leads to higher planning accuracy and more time spent on new features.
That’s how the DORA 4 help deliver better business outcomes. Now let’s look at how to actually improve your DORA metrics.
The 4-step Process to Improve DORA 4 Metrics
LinearB partnered with elite engineering organizations from BigID, Drata, GRIN, Bumble, Rapid 7, Appcues, and Nimble to build this process over the last three years. It’s working for them, so it just might work for you 😁
Step 1 > Benchmark Your Performance
Obviously, to improve your DORA metrics, you need to know where you stand. There are quite a few places you can pull them from:
- Some issue trackers have ways of calculating Cycle Time and MTTR.
- Most CI/CD tools calculate Deployment Frequency
- Lots of observability tools calculate CFR and MTTR
- You can get all four DORA metrics free-forever from LinearB
PRO TIP: Be careful using a single source of data to calculate your metrics. Issue trackers, for example, only provide accurate data if your hygiene is really good. LinearB correlates data from Git, issues, releases and incidents to ensure the integrity of the calculations.
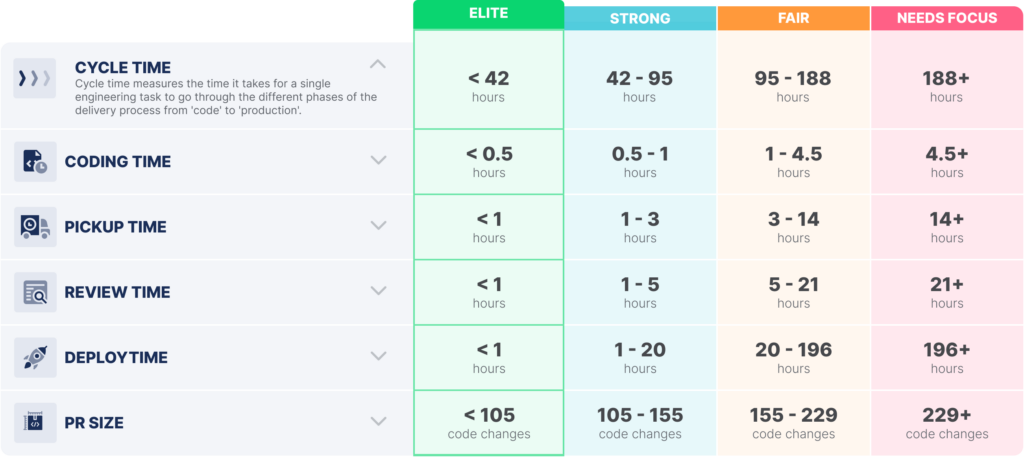
Once you know how your teams are performing, it helps to compare your metrics against industry benchmarks. To see how you compare to other engineering organizations, check out the DORA research from 2019 or the LinearB Labs study from Q1 2022.
Step 2 > Look at the Leading Indicators
DORA metrics are leading indicators of planning accuracy and predictability, but they are lagging indicators of efficiency and quality. This means, once you know which DORA metrics you want to improve, there’s another set of metrics you need to learn:
Pull Request Time
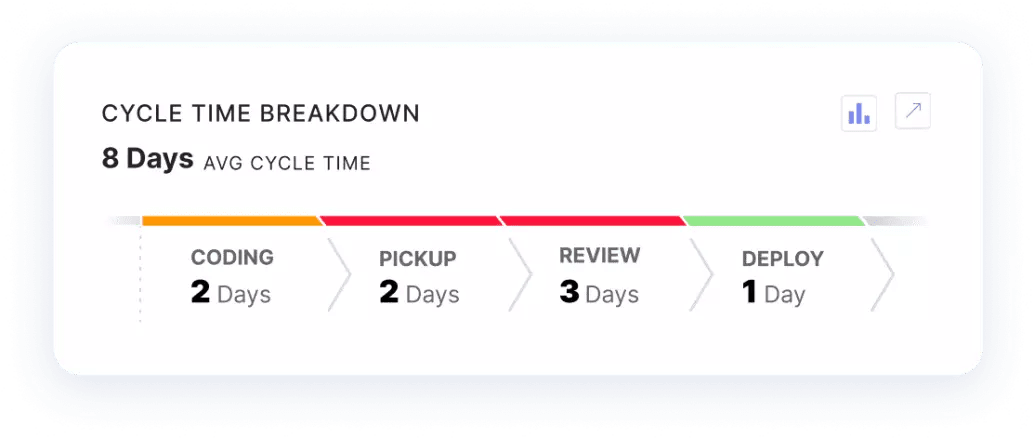
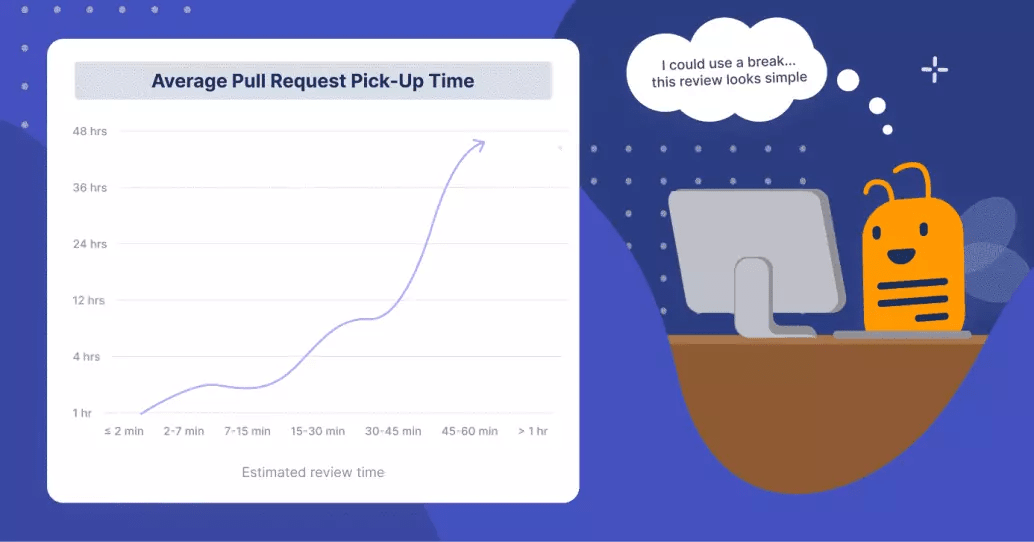
This takes up 2/3 of Cycle Time on average so it’s a great place to start. We define Pull Request Time as the combination of PR Pickup Time (how long it takes for a review to start after a PR has been issued) and PR Review Time (how long it takes for a PR to get merged after the review has started).
LinearB Labs studied 847,000 pull requests and found that half of all PRs are idle for 50.4% of their lifespan. This means if you have an average Cycle Time of 8 days, your pull requests are sitting idle for 2.5 days on average!
Reducing PR Time reduces Cycle Time AND, by removing idle time and increasing situational awareness, it helps reduce CFR and increase quality.
Pull Request Size
This is arguably the most important indicator of a healthy development pipeline. LinearB Labs found that small PRs lead to faster Coding Time, Pickup Time, Review Time, and Deploy Time.
Why?
- Small chunks of work are more likely to be finished without interruptions
- Small PRs are more likely to be picked up faster
- Small PRs have fewer hand-offs and idle time
- Small PRs are easier to merge and release.
All this combines to help Cycle Time and Deployment Frequency. Small PRs are also likely to have higher test coverage and more thorough reviews which reduce CFR. And, of course, they’re easier to roll back and fix, which helps MTTR.
(Quick note: Apologies to all of the GitLab users out there. I know you call them merge requests 😁)
Code Churn
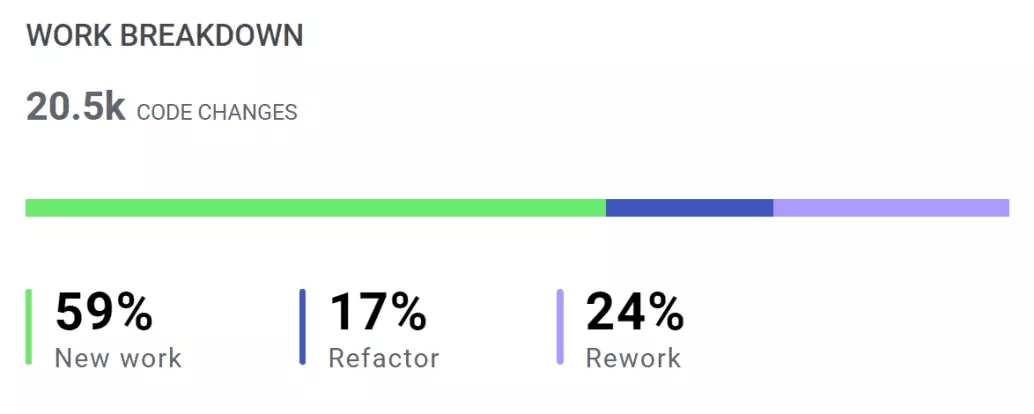
Code Churn, sometimes called Rework, highlights the percentage of code you’re re-writing within three weeks of merge. If your code churn is high, you are:
- Wasting time
- Probably seeing a lot of unplanned work.
Both slow you down.
Churned code is also more likely to have quality issues which increases your CFR.
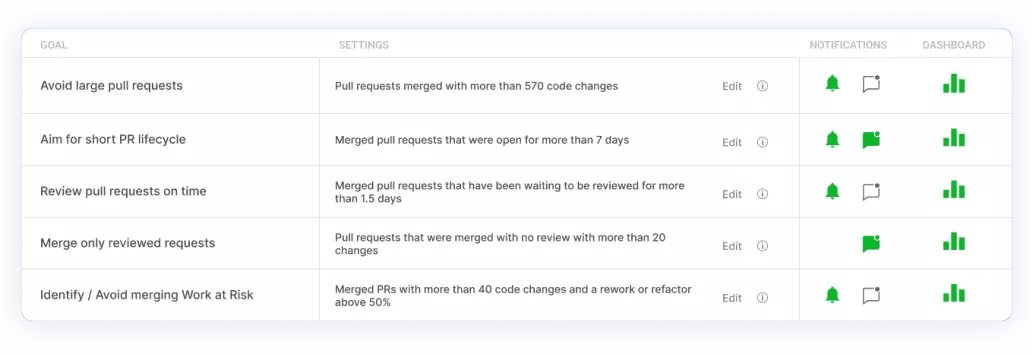
So, how do we actually improve PR Time, PR Size, and Code Churn? It’s time to get our developers involved in step 3 👇
Step 3 > Establish Team Working Agreements
Metrics and dashboards alone don’t improve dev teams. For sustained improvement of DORA metrics and all of the leading indicators from step 2, we need buy-in from our developers.
A meeting to establish team working agreements is a good place to start. It looks like this:
- Goal: 👉 Leave with written team working agreements for improving key areas affecting the leading indicators from step 2.
- Attendance 👉 Team lead and their immediate team. No VPs, Directors or PMs.
- Length 👉 You may finish in 15-30 minutes but block 50 minutes to be safe.
- Format 👉 Team lead runs a safe discussion where everyone gets a chance to talk.
- Prep 👉 Bring last 90 days of data to the meeting to inform the discussion.
Questions
The team lead can prepare a few questions based on the data to get things started. Examples include…
- “What’s the longest a PR should sit?”
- “Whose job, issuer or reviewer, is it to ensure reviews start on time?”
- “What’s the ideal PR size for new feature work?”
Tips
- Explain the why behind the meeting, the need for improvement and start with “one-tier improvement.” Meaning, for example, if your average PR Size is currently in the “needs focus” tier, shoot for “fair” versus “strong.”
- Write everything down and review every 30-90 days to adjust for improvement and what you learn.
I promise your developers will actually like this meeting. They want to produce high-quality work, merge faster and get back to solving new problems. All of the things that slow down your Cycle Time and increase your CFR hurt them too.
Team Working Agreements give them power over their work, accountability within the team, and help them see how their individual effort connects to business value.
Step 4 > Optimize Developer Workflow
I became a developer because I wanted to build things and solve problems. Except most of us are lucky if we write code 1-2 hours a day. The rest of our time is spent reviewing other people’s code, updating Jira tickets, writing status updates, sorting through Slack noise and attending meetings. These tasks have a negative correlation to PR review time, code churn, DORA metrics and planning accuracy.
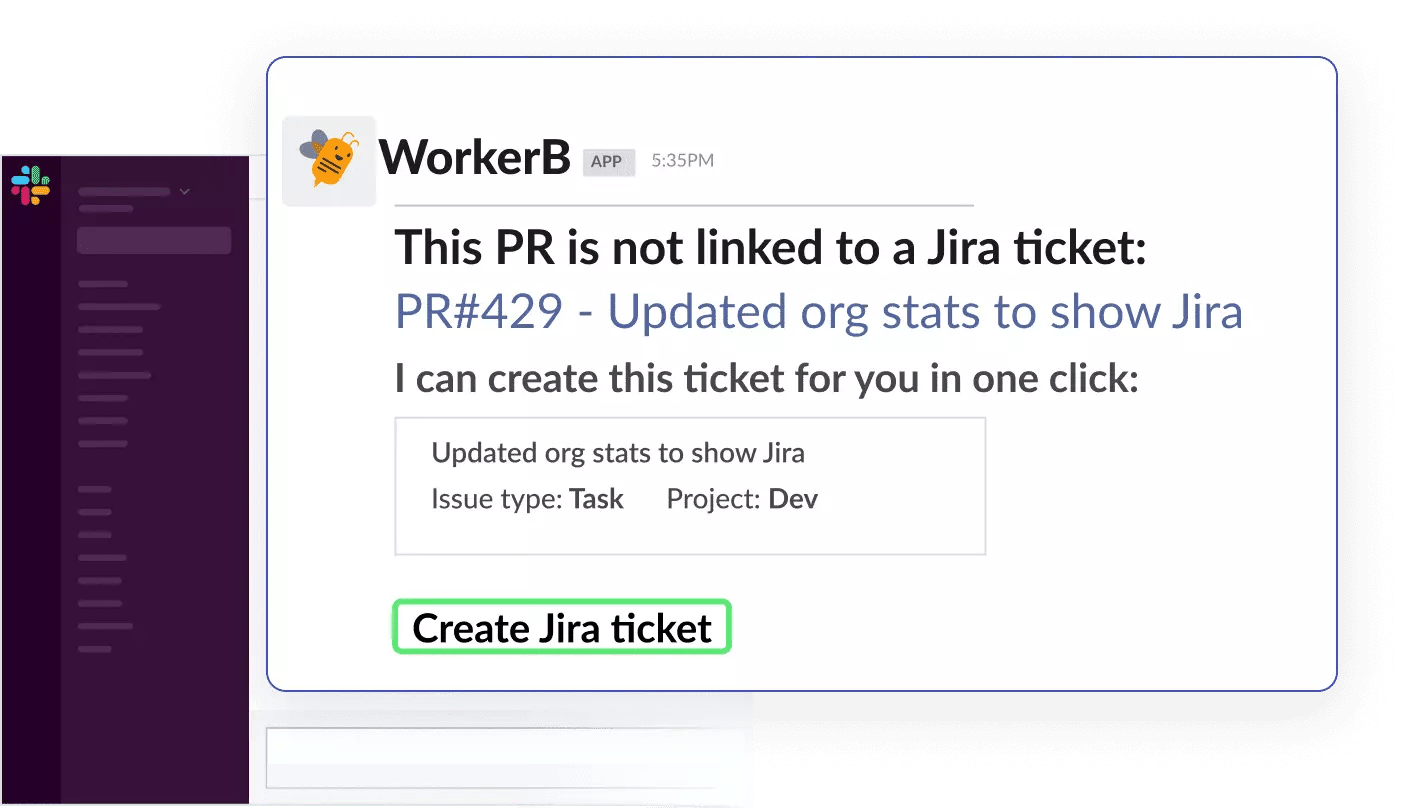
LinearB Labs found that 31% of work in Git is not connected to a ticket and half of all pull requests sit idle for 50.4% of the time. These are proof points that the developer workflow for non-coding tasks is far from optimized.
Git systems have some native alerts built in that help with pull requests, but I’d say we’re in the very early days of building the tools we need to support developers. I believe these tools need to be advanced in three ways:
- Correlate data from multiple sources e.g. Git, issues, releases, incidents
- Live at the “edge” where developers work e.g. IDE, Slack
- Move beyond alerting to full automation
LinearB built a bot specifically for developers called WorkerB. By streamlining repetitive, menial work associated with non-coding tasks, we help developers merge faster and spend more time coding, which leads to improved DORA metrics, higher planning accuracy and better engineering outcomes.
Improvement in Action
Our philosophy for using leading indicators to improve DORA Metrics is being used by engineering leaders like Olivier Robert (CTO at Nimble), Jonathan Sowler (VP Engineering at Unbabel), Chris Brookins (VP Engineering at Appcues) and Iris Gilboa (Engineering Ops at BigID) to reduce PR sizes, code churn and review times. This improvement ultimately leads to increased planning accuracy, delivering on promises and delivering more features faster.
I hope you have the chance to test out our four-step recipe for DORA metric improvement; we spend a lot of time thinking about data-driven engineering at LinearB.


