

As dev leaders, we spend most of our time translating between two groups of people in two parallel universes.
Most CEOs and board members come from the business side (sales, marketing, finance). While they enjoy the outcomes of engineering, they don’t fully understand how we work.
At the same time, many engineers don’t fully understand the business side of the organization. This is the background of most dev leaders. The right software metrics can help provide a common language between dev leaders and business executives.
Table of Contents
- Anti-KPIs in Software Development
- Which Software Metrics to Measure?
- Measure Your Efficiency
- Measure Your Quality
- Measure Your Focus
- What to Do with Software Metrics?
Anti-KPIs in Software Development
Driven to help our teams succeed and bridge the gap between engineering and the business, many of us have turned to data and metrics. But what software metrics truly help us accelerate delivery and correlate to KPIs the business cares about (revenue, leads, retention)?
We would all agree that measuring the right things is important. But some software development teams still use legacy productivity metrics that actually stop them from getting better. We call these metrics anti-KPIs. Some of the most common software development anti-KPIs include team velocity (story points completed), lines of code, code commits, and Jira tickets completed.
What do these anti-KPIs all have in common? First, they may on the surface indicate that your contributors are busy, but they don’t actually help you figure out if you’re providing value to customers.
Second, they encourage the wrong behavior. Is writing more code good? Maybe. Or maybe it is a sign of inefficiency. Do completed Jira tasks show productivity? Most developers would argue that what happens in Jira has little to do with the “real work” of writing code.
Third, and worst of all, these anti-KPIs can easily be gamed. Your contributors that are struggling might be tempted to inflate these anti-KPI numbers (which they can do easily) which actually blocks you from giving them the help they need.
So what should modern dev leaders measure? Keep reading to discover 17 software metrics that matter for dev leaders and how to use them.
Which Software Metrics to Measure?
At LinearB, we think of operational excellence in software engineering as the pursuit of predictably delivering projects with high quality, while maintaining efficient working hours for happy contributors and teams who are continuously improving. That’s a lot 🙂 But we think it’s possible.
It can seem overwhelming, especially if you’re not sure how you’re doing against all of those dimensions and what steps can be taken to improve. We worked backwards from the goal of delighting our customers and being operationally excellent and came up with 17 key performance indicators metrics to measure. Some you’re probably already measuring. Some may be new to you.
We look at three types of software metrics:
- Efficiency
- Focus
- Quality
And we measure those categories across two dimensions:
By Team
As your engineering organization scales, it is common to find yourself reliant on your individual engineering teams. The ability of your team leaders to drive delivery through their teams ultimately results in your organization’s failure or success. A frustrating situation to be in is when you have a team that is struggling but you do not have measurement visibility to understand why and how to help.
Therefore, it is important that you not only measure all essential KPIs at the organization level, but also at the team level. This allows for three main things:
- It provides a success framework for your team leader to operate within.
- It allows you to quickly understand where to focus your time, which teams are operating successfully and which teams are struggling?
- It allows you to make a positive impact with the struggling team as you will have the measurement visibility to understand what is happening and act.
By Iteration
The iteration is the delivery pulse of your engineering organization. It represents the construct in which your teams operate. One of the great things about iterations is that they naturally provide proper time periods for measurement.
If you are using the scrum methodology, the sprint length is a great measurement boundary. If you are using Kanban, a one-week time frame provides a nice boundary.
Measure Your Efficiency
The efficiency of your software development lifecycle is what enables your team to deliver code to production. It includes all of the phases from “work requested” all the way through release to production and validation.
Efficient delivery pipelines lead to predictable value delivery, happy developers, happy product owners, and happy customers. Frustrations arise with inefficient pipelines.
These situations can happen when code is merged and ready to be released but “the release is not until next week.” Or when a developer opens a pull request but it takes days to receive a review. Or when a story has been carried over from iteration to iteration for months.
Measuring the stages of your delivery pipeline allows for bottleneck detection. This provides a high leverage point to increase your delivery performance because it impacts all teams and contributors.
Efficiency Metrics to Measure by Team
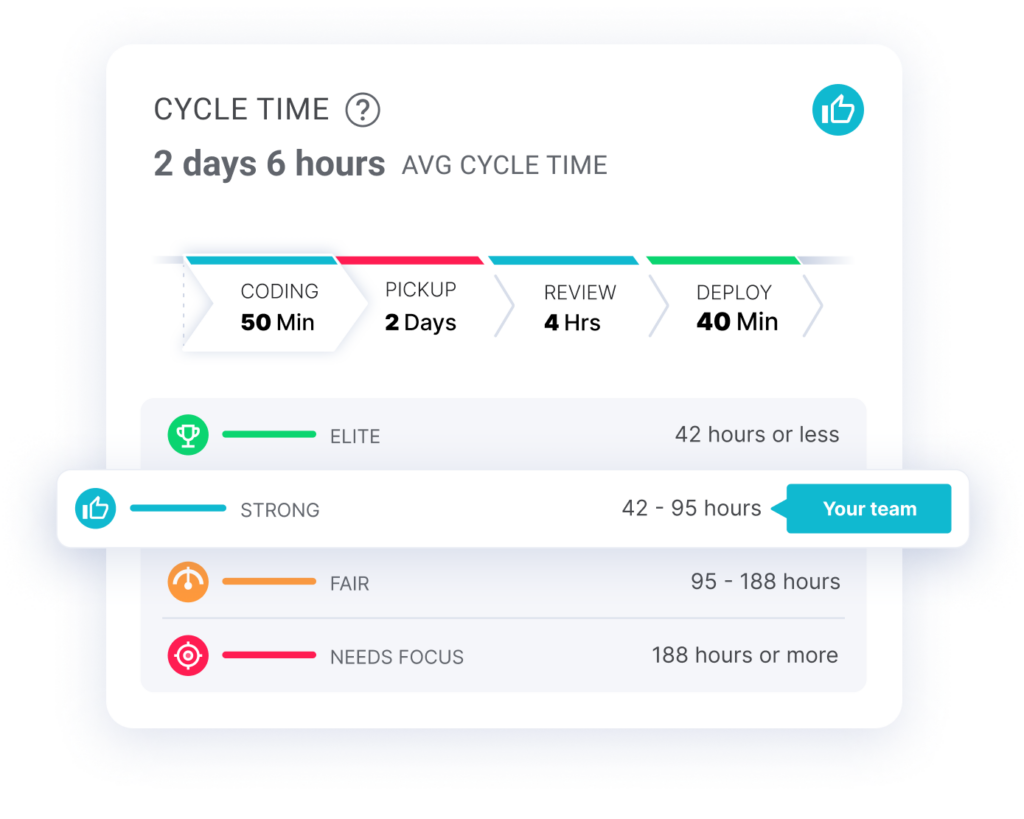
1. Cycle Time
Cycle time: The amount of time from first commit to release.
Why it matters: Cycle time is the #1 indicator of your speed to value and efficiency ratio.
Note: Many of you are already measuring (or trying to measure) cycle time. But what do you do when you think your cycle time is too high? The next three software measurements help you diagnose where to spend your time to drive cycle time down.
2. Pickup Time
Pickup time The amount of time it takes from when the pull request is opened until the review begins.
Why it matters: Efficient teams have a low pickup time. The less time PRs spend waiting for review, the faster they are released. This metric is important for all dev teams but is even more critical for remote dev teams.
3. Review Time
Review time: The amount of time it takes from when the code review begins until the PR is merged.
Why it matters: There’s a sweet spot for review time. Review time that is too long could suggest your team member has too much WIP or there’s an issue with the review that’s requiring a lot of back and forth. Review time that is too short might indicate the review was superficial.
4. Deploy Time
Deploy Time: The amount of time from pull request merged to production release
Why it matters: Your developers may have finished their job, but your customers may not be getting the value. If deploy time is high, it could mean you need to invest more in continuous deployment (CD) or that you have an opportunity to move to a micro-service architecture.
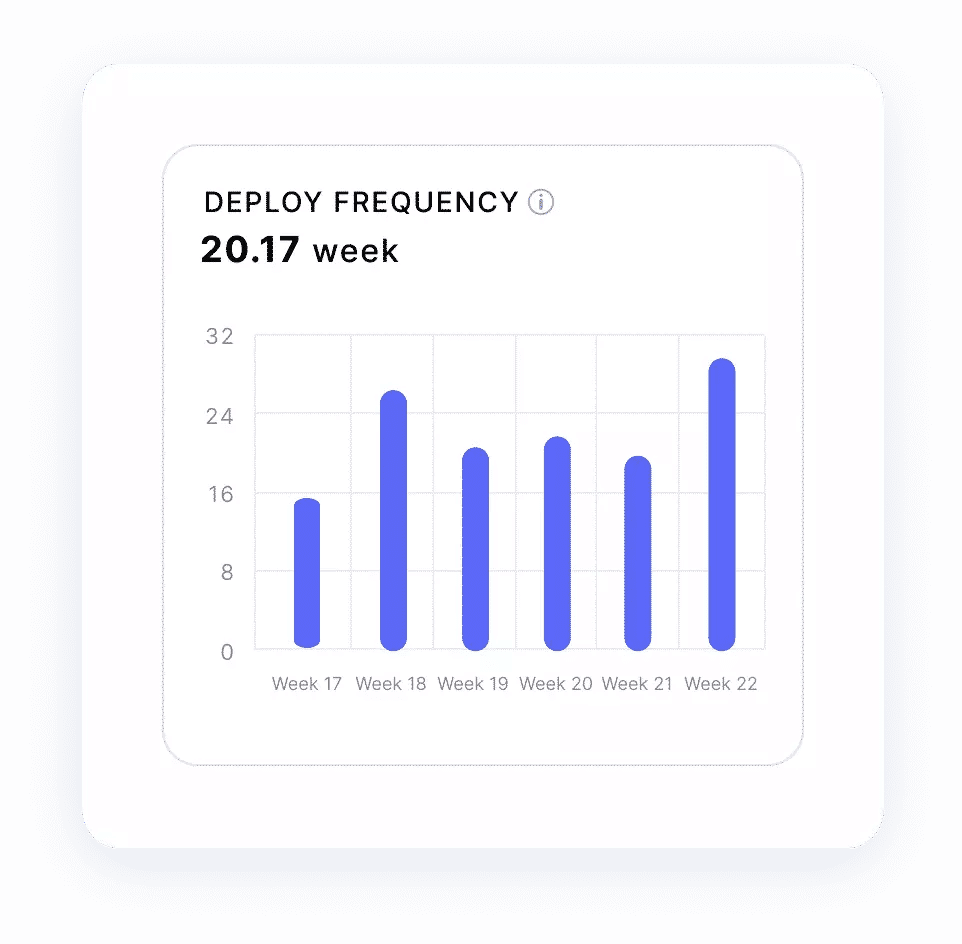
5. Deployment Frequency
Deployment Frequency: The number of releases per day.
Why it matters: This is a strong indicator of how much value your team is capable of getting into the hands of customers. Even if you have an efficient pipeline, if your deployment frequency is low, you may not be delivering enough value.
Efficiency Metrics to Measure by Iteration
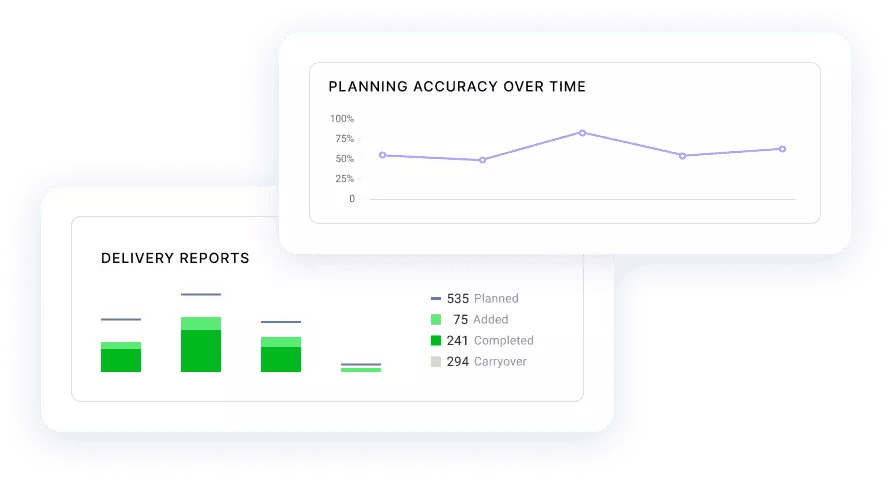
6. Delivery Breakdown
Delivery Breakdown: The number of issues or story points planned, added, completed, and carried over.
Why it matters: Understanding your delivery breakdown helps you provide context and delivery reports to stakeholders. Project XYZ wasn’t completed because Project QRS required additional work either due to scope creep or technical debt.
7. Planning Accuracy
Planning Accuracy: The number of completed (not including added) issues or story points divided by the number of planned issues or story points.
Why it matters: There’s nothing worse than committing to shipping a feature by the end of a sprint and missing the deadline.
 Using LinearB’s Project Delivery Tracker can help you visualize unplanned work your team is doing each sprint and improve your planning accuracy. Book a demo today!
Measure Your Quality
Most teams have experienced situations where low quality leads to missed delivery dates, iteration interruptions, long hours, unhappy customers, and a frustrated engineering organization. On the flip side, high quality leads to predictable delivery, efficient work hours, happy customers, and a happy engineering organization.
There are many different metrics that you could measure as an engineering leader. Some of the classics range from test coverage to service uptime. While these metrics are great, we have found that there are a few alternative metrics that really help to measure delivery predictability.
Quality Metrics to Measure by Team
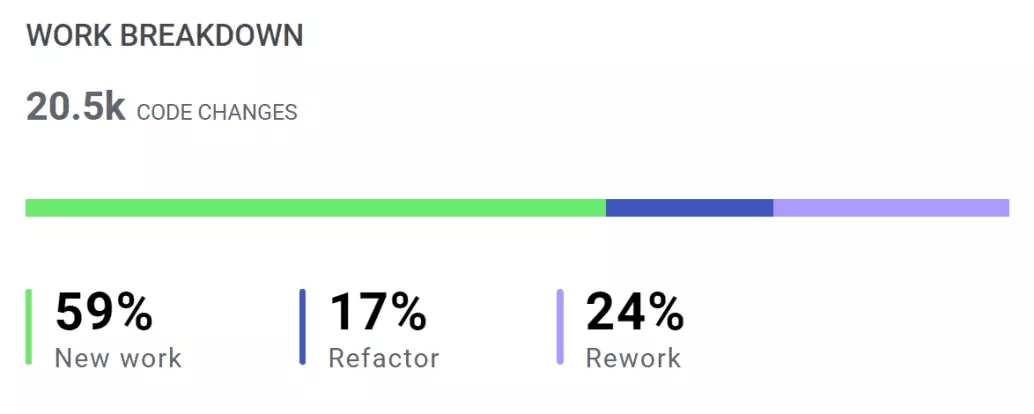
8. Code Churn
Code Churn: Percentage of recently delivered code your team is already rewriting.
Why it matters: A high rework percentage could mean you have a training issue, you’re rushing the process, your review process is lacking, or you have a breakdown in communication with product management.
9. Refactor Ratio
Refactor Ratio: Percentage of legacy code your team is rewriting.
Why it matters: Some degree of refactored code is acceptable and even required for improving systems quality. But monitor high volumes of refactor in a single release. This is not recommended because there is a higher probability of harming existing functionality.
10. Change Failure Rate
Change Failure Rate: The number of times a deployment results in a failure in the software system divided by the number of total deployments.
Why it matters: This is a lagging indicator of quality issues. But it also impacts delivery pipeline. All the time your team spends dealing with failures in software performance is time not spent delivering new features and value to customers.
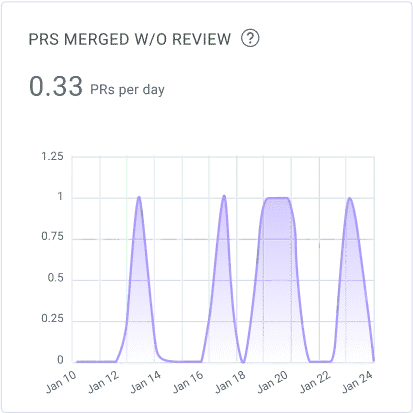
11. PRs Merged without Review
PRs Merged without Review: The average number of pull requests merged without review.
Why it matters: In addition to revealing quality assurance issues, analyzing unreviewed pull requests can sometimes be an indication of a training or culture issue on a given team.
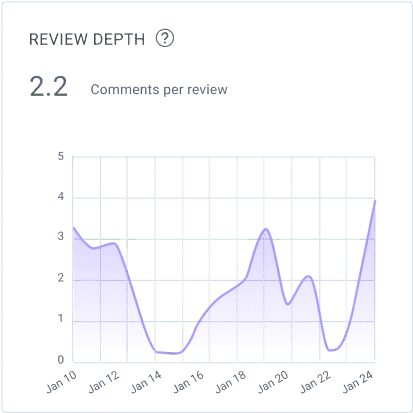
12. Review Depth
Review Depth: The average number of comments per pull request review
Why it matters: This metric is an indication regarding the quality of the review and how thorough reviews are done. Reviews are an important factor for improving code quality and finding quality issues in code before it is merged and deployed.
Quality Metrics to Measure by Iteration
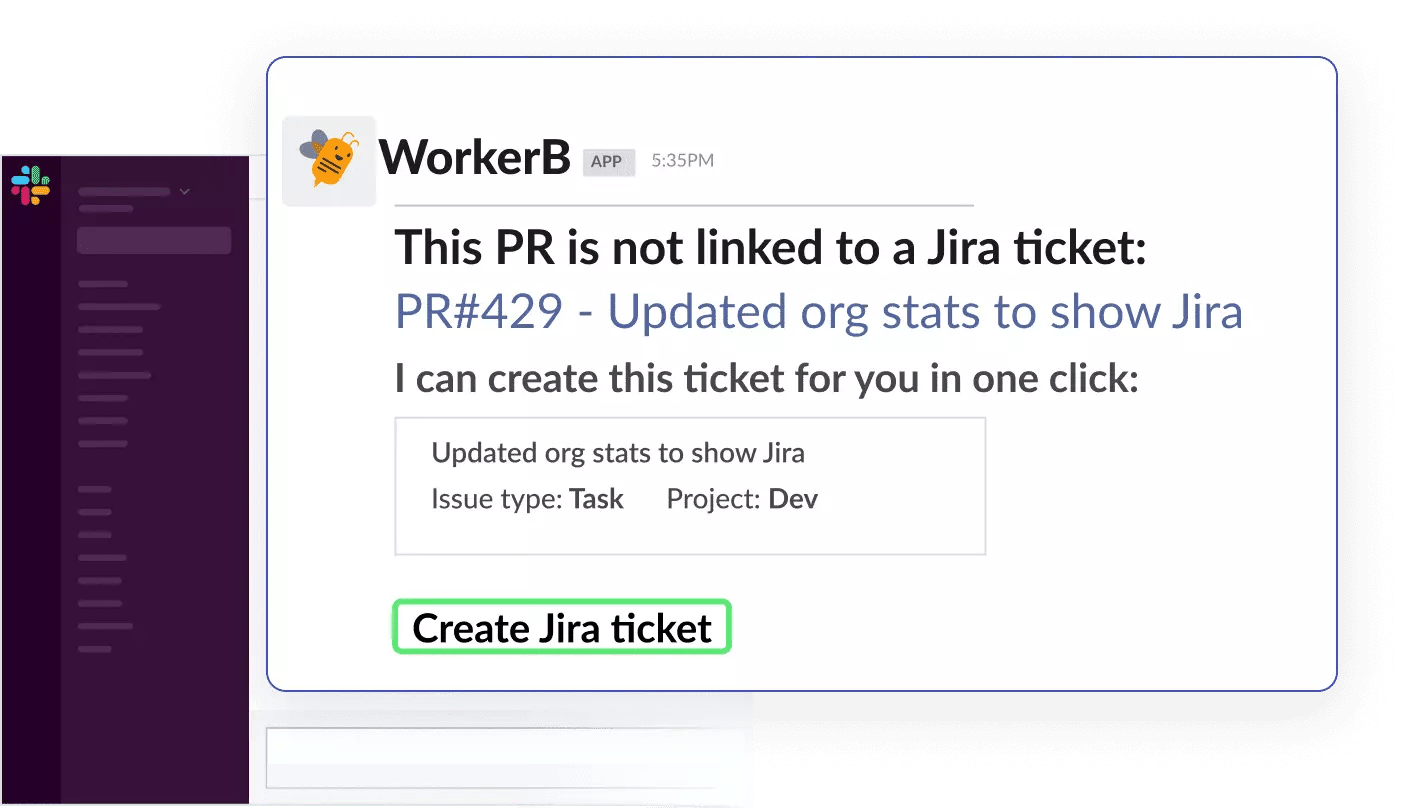
13. Shadow Work
Shadow Work: Git activity that isn’t linked to a Jira ticket.
Why it matters: Shadow work negatively impacts your data integrity. It also suggests your developers are running into technical debt while trying to code new features. Rather than create a new Jira ticket, your developers have just jumped into fixing the problem.
Note: This makes sense. They’d rather be coding than updating Jira. But then that leads to business decisions being made based on inaccurate data. We’re on a mission to stop developers from having to log into Jira ever again.
By correlating data between Jira and your Git repository, LinearB will automatically know when a developer is working on an unlinked branch. Then our WorkerB bot prompts the developers with a “Create Jira Ticket” notification. A new Jira Ticket can be created or edited from within Slack or MS Teams, with a single click.
Measure Your Focus
The most valuable asset that your organization possesses is your people’s time. It is a scarce and limited resource.
There are many forces pulling at your team’s time. Your CEO wants to deliver new value to customers. Your engineers want non-functional investment. The support team wants to fix bugs. And your sales team brings customer commitments.
Lacking visibility into where your team is actually spending time makes balancing all of these forces very difficult. These metrics are a data-driven representation of where and how your team is spending effort.
Measuring and tracking your focus metrics puts you back in control. It allows you to determine if your actual investment areas match your expected investment areas. It also allows you to be in the driver’s seat when interacting with stakeholders like your CEO or product lead.
Focus Metrics to Measure by Team
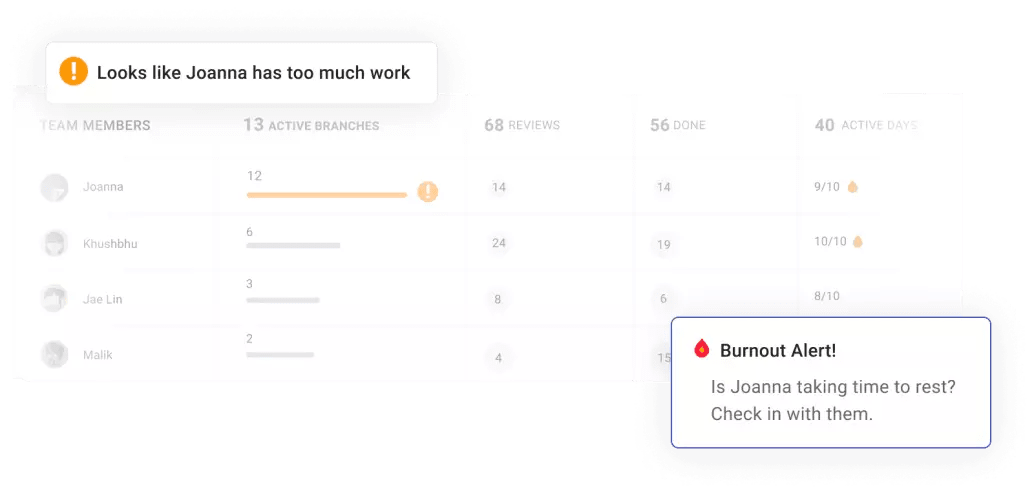
14. WIP
WIP: How much work in progress is assigned to a contributor or team.
Why it matters: If the team has too much work to do, they may tend to ignore code reviews in order to press forward with their overstretched schedule. This will lead to delivery pipeline and quality issues if ignored.
15. Consecutive Days Worked
Consecutive Days Worked: The number of active days in a row a contributor has worked.
Why it matters: This is a leading indicator of team member burnout. It is the job of the team lead to step in and be the responsible people manager. Quality of work will suffer if developers are not disconnecting, mentally and physically.
Focus Metrics to Measure by Iteration
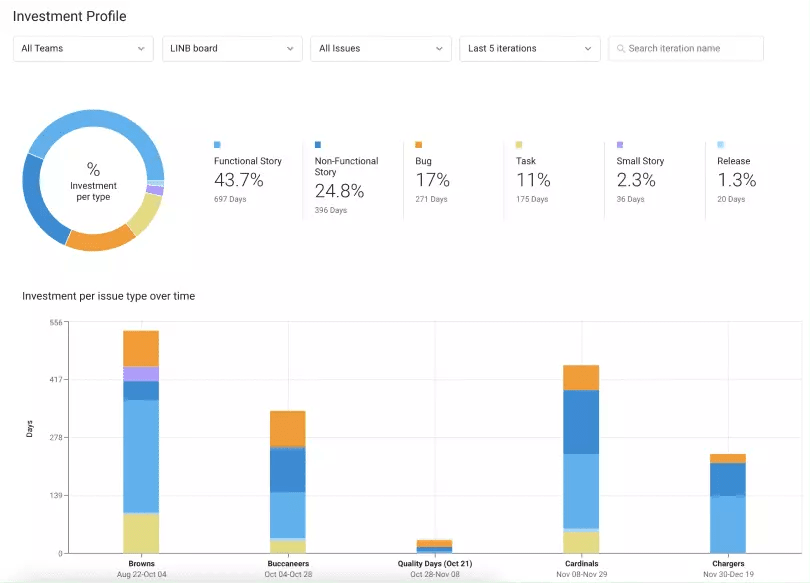
16. Investment Profile
Investment Profile: Percentage of work by issue type.
Why it matters: You have to understand how much of your team’s effort was invested in different issue types. Focusing too much effort on stories to the neglect of backend work causes quality to decline, which increases the likelihood that code will need rework. This derails future iterations with bug fixes and impacts your team’s ability to hit future feature deadlines.
17. People Effort
People Effort: Percentage of the team members contributing to the development project out of all the people currently working on projects.
Why it matters: Ensure that the highest priority software projects are receiving the most effort. This will ensure your stakeholders that your team is working on the thing(s) that they care most about and will lead to customer satisfaction.
What to Do with Software Metrics?
As you start to measure these KPIs, the first step for you as a leader is to educate your team on what you’re doing and why it will help them get better and ideally save them future headaches.
The second step is to set goals and integrate these metrics and goals into your ceremonies. Talk about your team metrics in daily standups, and review iteration metrics in your retrospectives.
At LinearB, we put these metrics at the center of our business and it helps us deliver value to customers faster with higher quality.
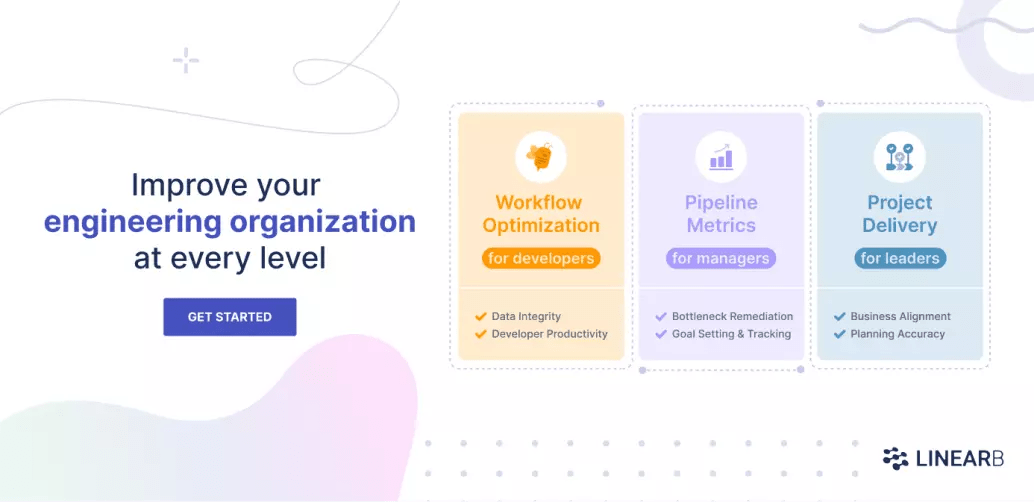 Want to improve your engineering processes at every level? Get started with a LinearB free-forever account today!


