

Businesses can grow quickly–in fact, that should be the goal. But business growth and scaling operations can come with some challenges–especially when your core business is software.
As organizations grow, they have to constantly evaluate and adjust their processes to scale successfully. Processes that might work for a small company may not cut it for a larger one.
One of the best things a scaling business can do is get comfortable with engineering metrics. It’s through constant analysis and working to optimize these metrics that teams will:
- Improve Developer Productivity
- Drive predictable software delivery
- Positively impact the business
In this post, we’ll explore 10 core engineering metrics and their role in business success. We’ll also explore tools and strategies to use metrics to strengthen your development teams.
Let’s jump in!
What Are Engineering Metrics?
Engineering metrics quantify and provide a standard of measurement for software delivery–including processes, team collaboration, and business alignment. Metrics benchmarks help teams contextualize these metrics, define “good,” and chart their path forward.
Any given software project has many moving pieces, tracking software engineering metrics can help you determine:
- Level of effort and investment to deliver a project on time and in scope
- What, if any, tradeoffs need to happen to make good on promises made to the business
- Any risk indicators–like quality, Developer Experience, or unplanned work–that may get in the way of delivering
Bottom line: engineering health is business health and engineering metrics have a direct relationship to business performance. Improved engineering metrics are a great predictor of the future success of a company.
What Are the Most Useful Engineering Metrics?
There are lots of engineering metrics available. A great foundational set of metrics are DORA metrics. Every organization likely has different goals, so it’s important to select the most appropriate metrics for your team and what you’re trying to accomplish.
Measuring the right leading and lagging indicators will help you accelerate delivery, maintain a positive culture, and translate development activity to business value. So, what metrics should development leaders benchmark, set goals against, and work to improve? Let’s look at ten metrics that provide a great starting point.
1. Cycle Time
Cycle time–one of the four DORA metrics–is one of the most important metrics for any software development team. It measures the time it takes for a piece of work to go from first commit to deployed in production. In other words, it tracks how quickly a development team brings value to the end user. Keeping cycle time low should be a core focus for every software engineering organization.
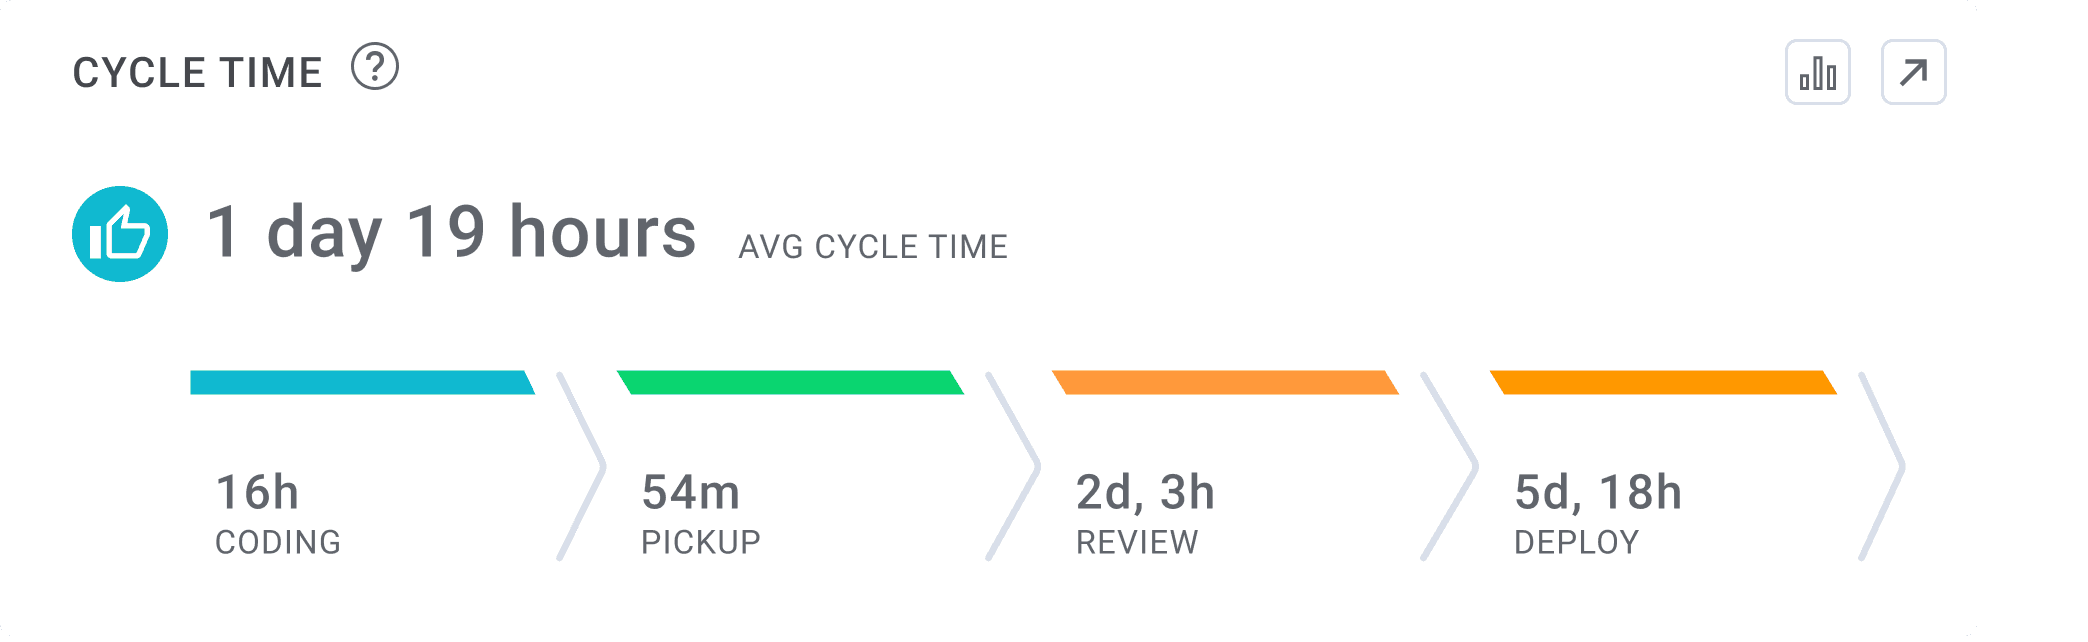
Short cycle times lead to higher revenue and a more efficient organization overall. Monitoring cycle time provides development leaders with a clear view of potential bottlenecks that might clog the delivery pipeline.
2. Deploy Frequency
Deploy frequency–another DORA metric–measures how often your team releases code to production. The most mature and healthy organizations deploy multiple times per day or on demand. The best way to improve deployment frequency is to produce smaller pull requests (PRs) more often. Not only does this approach drive better deployment frequency (and overall efficiency), it also:
- Makes testing more manageable
- Increases overall quality–further increasing value delivery to customers
- Reduces Change Failure Rate (CFR) and Mean Time to Restore (MTTR)
*Note: CFR and MTTR are also DORA metrics that are useful to track. They are good indicators of quality and stability. If you’re deploying smaller pieces of code more often there’s less of a chance of something breaking. And when something does break, smaller deployments make it easier to find and fix the problem.
3. PR Size
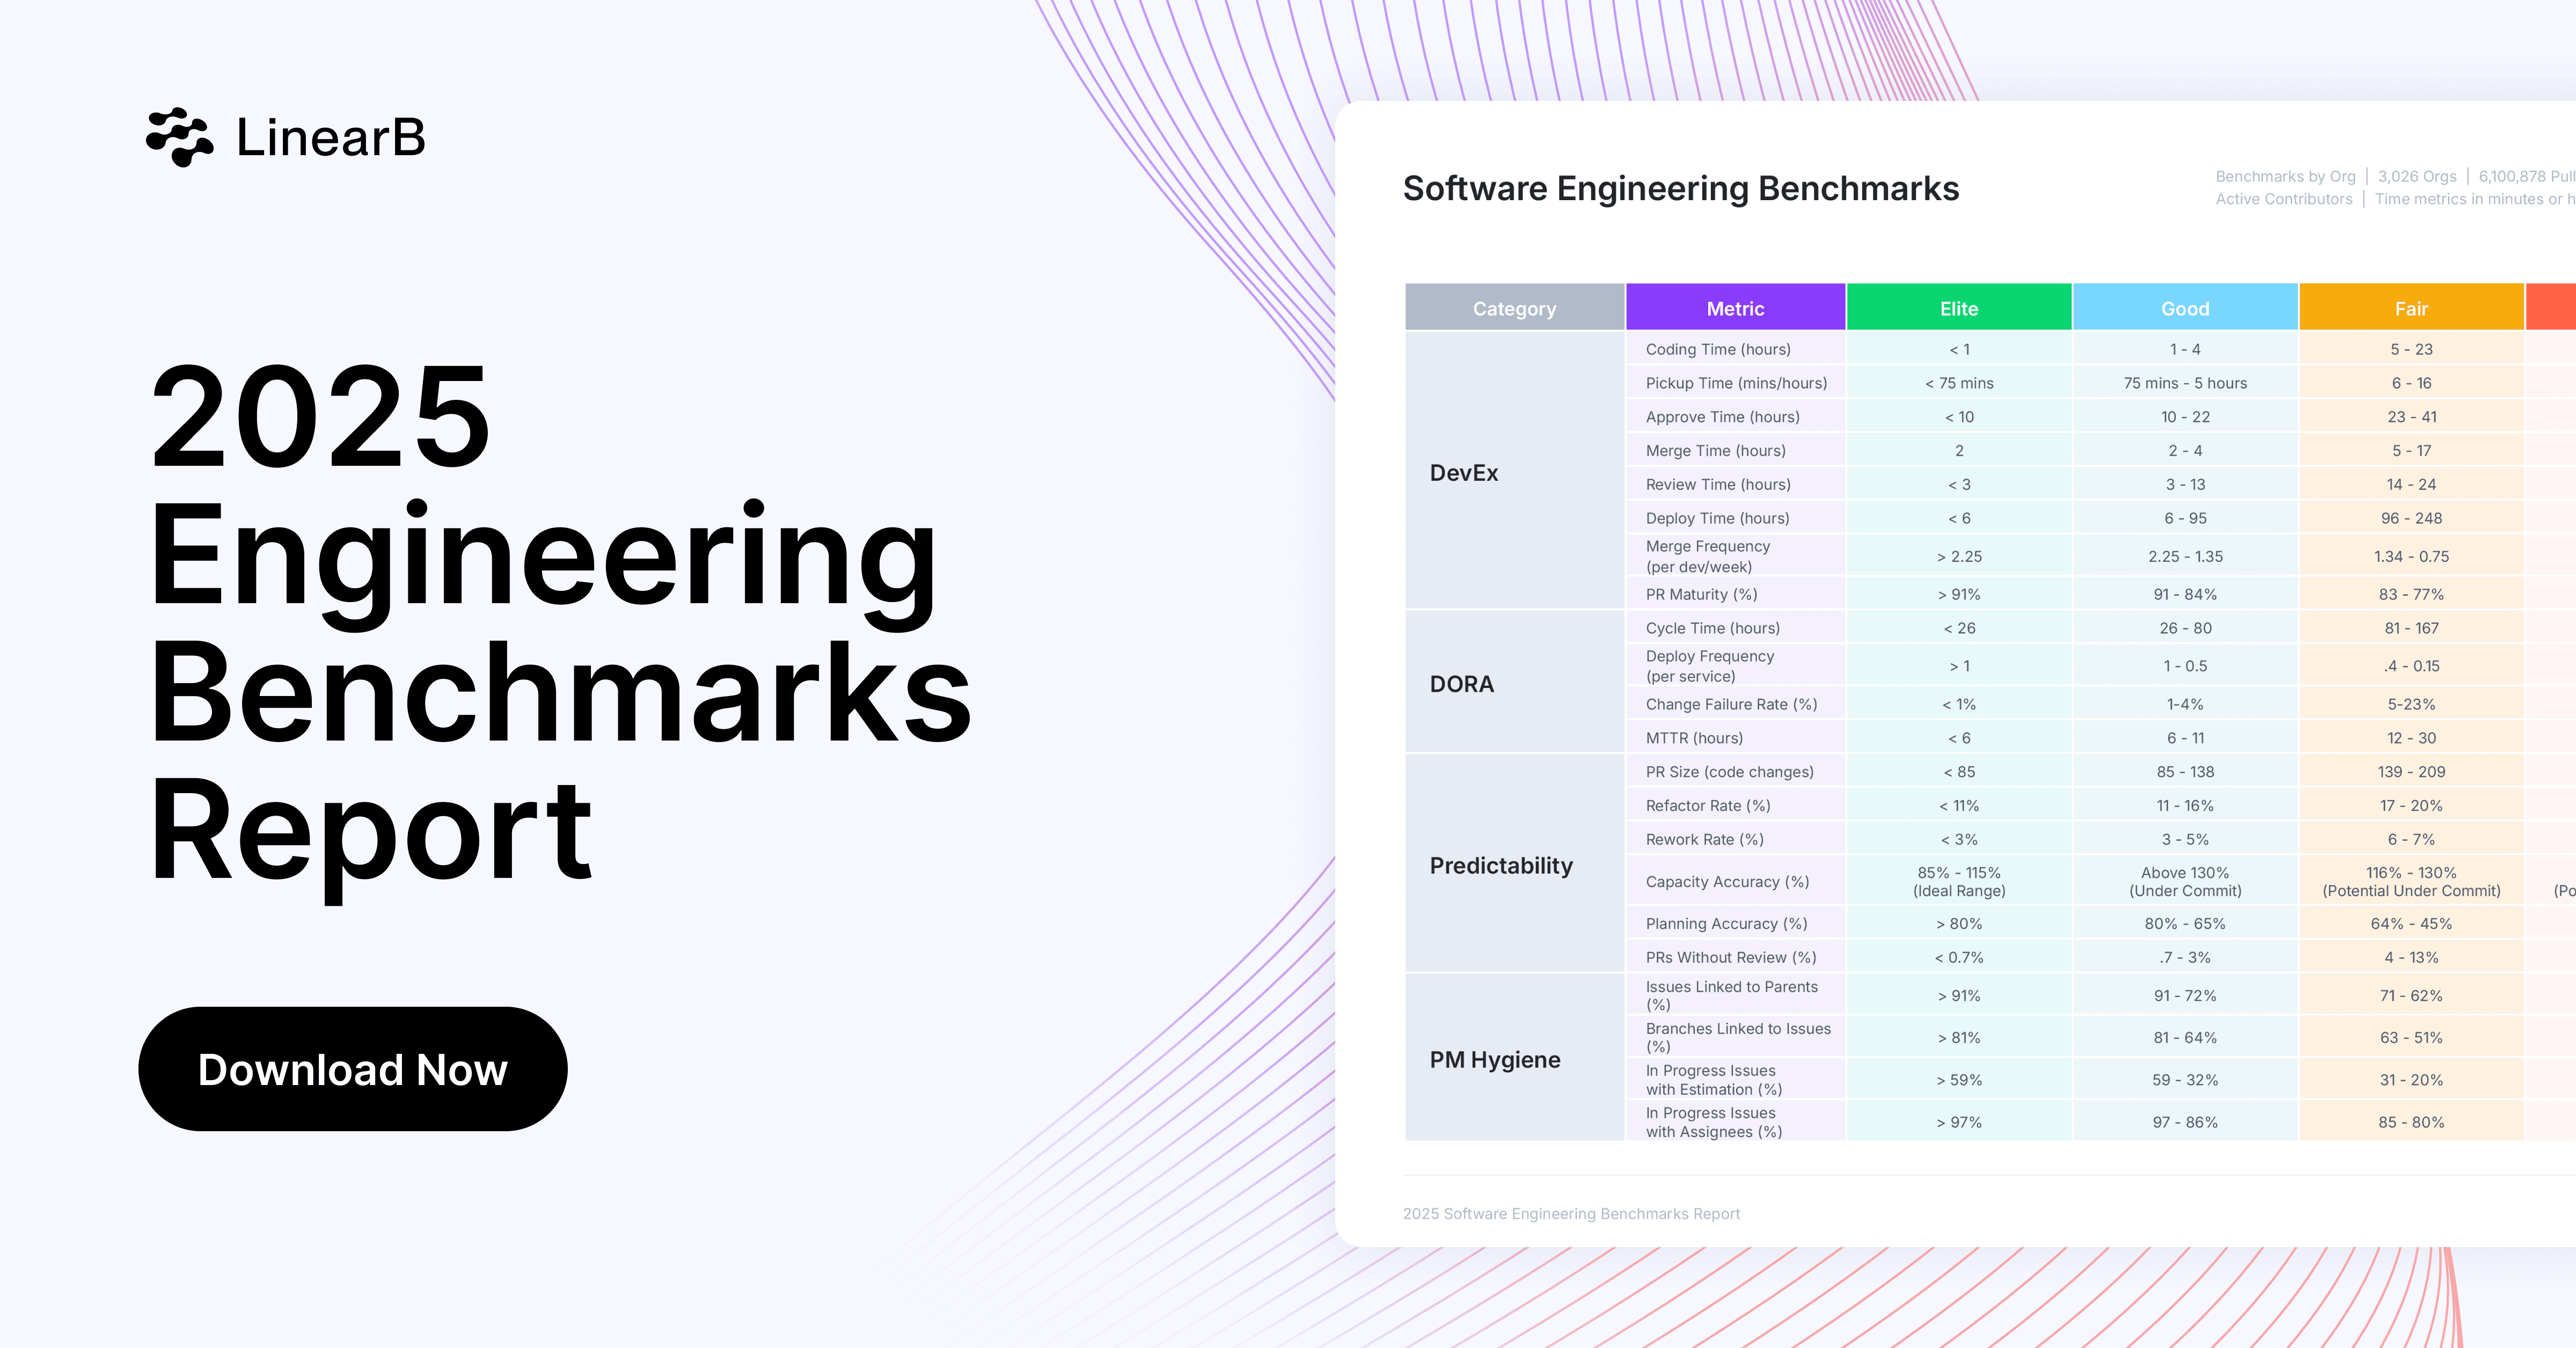
PR Size measures the number of code lines modified in a pull request and is critical in how quickly code is shipped. Small PRs tend to be less complex and lower risk, meaning reviewers can quickly understand, approve and merge changes and speed up delivery cycles. Our research in the 2025 Software Engineering Benchmarks Report found that larger PRs:
- Wait longer to get picked up for review.
- Are modified more heavily during review.
- Take longer to approve.
- Have longer Cycle Times.
Want to learn more about how you can improve your PR Lifecycle? We studied 6.1M Pull Requests in this year’s Benchmarks Report, download it here.
4. Review Time
Review Time measures the time it takes to complete a code review and merge a pull request. Low Review Time represents strong teamwork and a healthy review process. Conversely, high Review Times indicate that work isn’t broken down into small chunks or that there may be bottlenecks, like a lack of focus time.
You can improve Review Time by keeping PRs small (under 200 lines of code), setting clear review SLAs, and fostering a culture where reviews are prioritized
5. Rework Rate
The rework ratio indicates the amount of code that needs to be rewritten after the team delivers it to the end user. For LinearB, rework–unlike refactor–is defined as code that needs to be rewritten after fewer than 21 days have elapsed since deployment.
More often than not, rework is a result of poor quality or poor communication and planning/scoping.
6. High-Risk Branches
This metric indicates that there is a large PR, a high degree of rework, a big percentage of refactor work, or some combination of all three. Besides the obvious quality considerations, high-risk work tends to move slowly through the development pipeline and often requires extra reviews from the team–further compounding any resource constraints that may be present.
One of the best ways to combat high risk work is to use automation that helps find the right reviewer, flag any deprecated components, and provide reviewers with additional context to reduce cognitive load.
Want to eliminate risky behavior around your PRs? Book a demo of LinearB today.
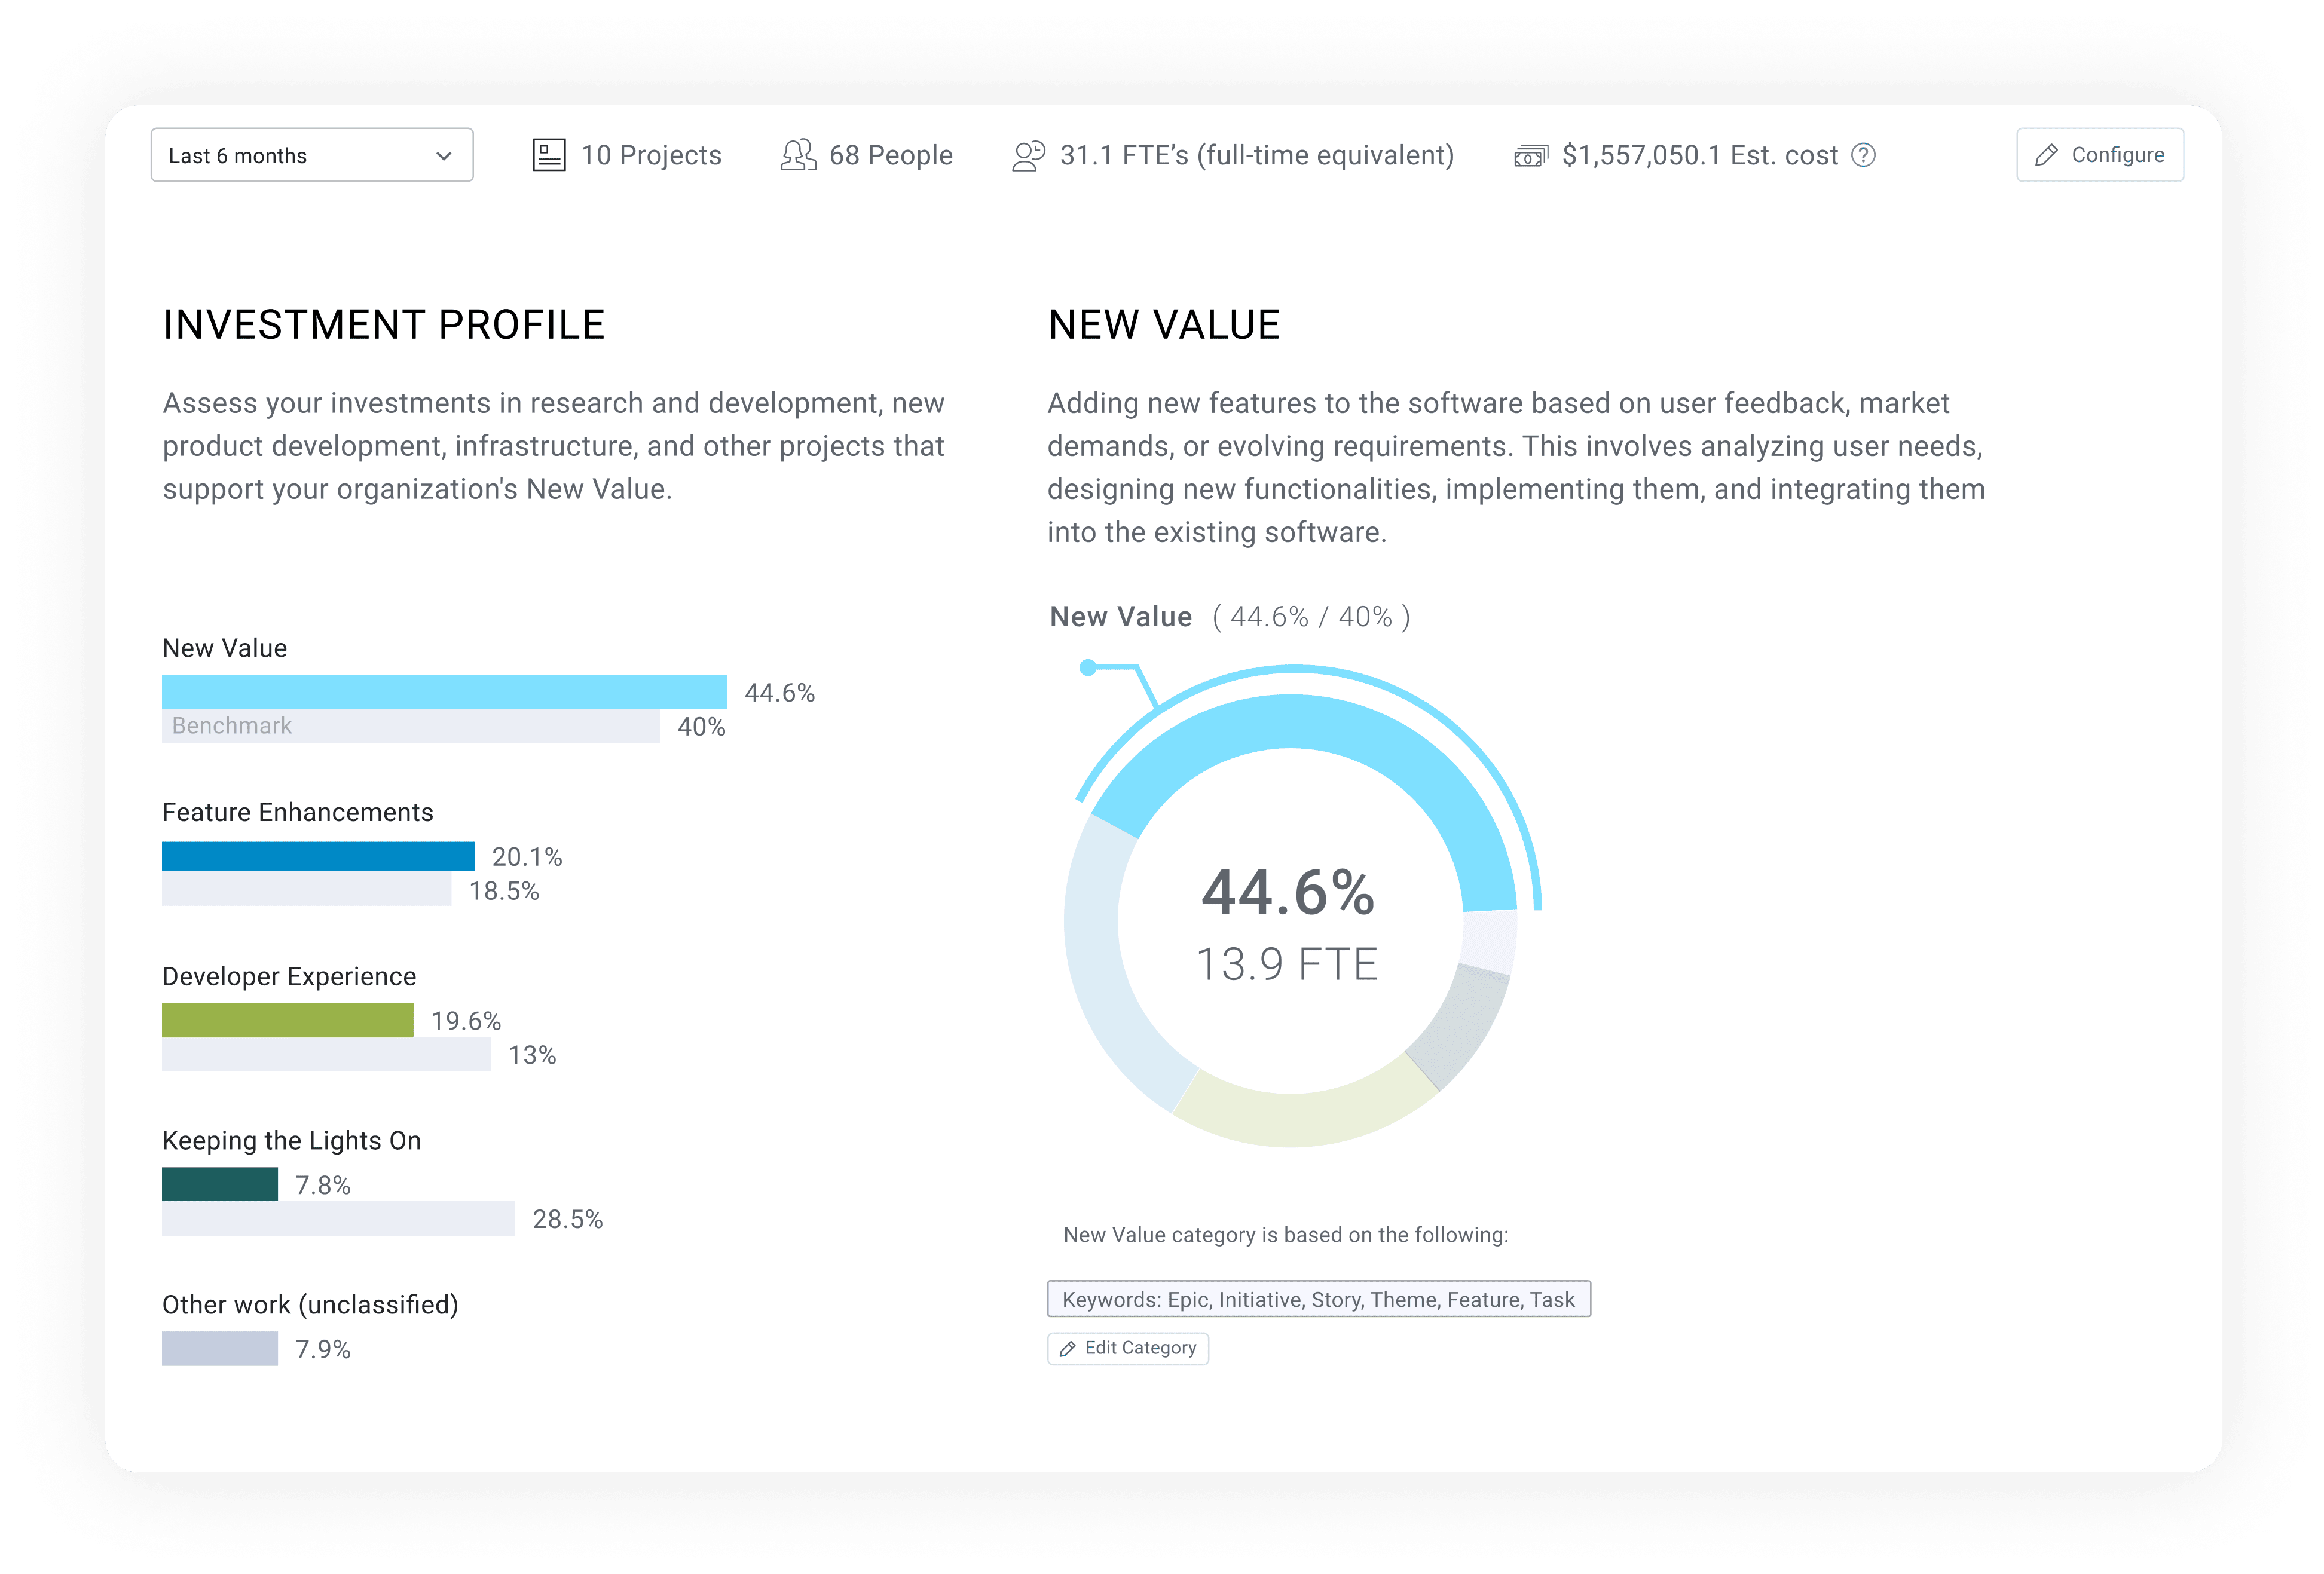
7. Investment Profile
Investment Profile measures how development efforts are distributed across key categories like:
- KTLO (Keeping the Lights On): Minimum tasks a company is required to perform in order to stay operational, maintain stability, and meet stated SLAs, such as: Maintaining current security posture, issue and ticket monitoring/troubleshooting, maintaining promised uptime, etc.
- Developer Experience: Work that improves the productivity of development teams and their overall experience. Things like introducing better developer tooling, incorporating additional testing automation, restructuring code, and paying down tech debt to reduce KTLO bucket.
- Feature Enhancement: Work to enhance features or deliver a product that ensures customer satisfaction. This includes activities such as customer RFEs, improved performance / utilization, better scalability, quality days, and improved reliability or security, etc.
- New Value: Any investment in new features that increase revenue and growth by new customer acquisition or expansion. This might include activities such as: adding a new feature, supporting a new platform or partner application, implementing roadmap items, etc.
- Inefficiency Pool: Wasted effort due to common inefficiencies present in the SDLC—think context switching and/or idle time. This investment category is a prime candidate for reallocation of resources.
Producing new value for customers via new features and enhancements is a top priority, and so is maintaining security, core infrastructure, and application uptime. Engineering teams need to balance these priorities and make sure that the most precious resources–developer cycles–are spent according to the needs of the business.
LinearB provides a dedicated dashboard for Investment Profile that includes customizable benchmarks that take into account industry best practices as well as your engineering organization’s needs.
8. Work In Progress (WIP)
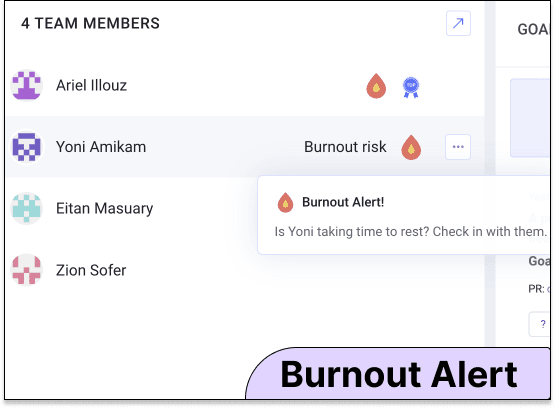
WIP shows you the open items assigned to a developer and how work is distributed across your team. Developer burnout comes from cognitive overload–usually stemming from too much context switching. This context switching starts with too much WIP. Just like the context switching metric, too many open items makes it very difficult to focus and complete tasks.
If you’re a Kanban team, you know that controlling WIP and keeping it consistent is a primary focus to maintain healthy teams and efficient operations.
LinearB not only provides visibility into WIP, it also provides automated alerts and burnout indicators for when a member of your team has too much on their plate.
9. Planning Accuracy
Planning accuracy measures how effectively teams meet their planned work commitments, serving as a key indicator of engineering predictability. High Planning Accuracy signals a high level of predictability and an ability to hit deadlines, whereas low Planning Accuracy indicates that scope creep and unplanned work are taking up too much time which can cause delays.
Measuring Planning Accuracy helps you accurately forecast project delivery and determine if timelines can be moved up.
10. Capacity Accuracy
Capacity Accuracy measures how many issues or story points a team completed in an iteration (planned or unplanned) compared to the amount planned for that iteration. It helps answer questions like:
- Are teams taking on an amount of work they can reasonably accomplish in an iteration? Low Capacity Accuracy may indicate overcommitment during planning.
- Are teams “playing it safe” and under-committing to always hit the mark? This would lead to high Capacity Accuracy.
- Do we have a good grasp of the team’s work capacity and can predictably deliver that capacity sprint over sprint? Unstable Capacity Accuracy that swings from low to high shows that the team hasn’t found its pace yet and cannot predict the amount of work they can deliver.
How to Get the Most Out of Engineering Metrics
Keeping track of all these metrics can be a time-consuming process–especially if you’re doing it manually. It can be even more time consuming to figure out how to action any insights you gain from engineering metrics. And time is a luxury that most teams don’t have. So what can you do to solve this issue?
LinearB SEI+ provides valuable operational and business alignment insight to development teams, allowing them to perfect their software delivery process and deliver more value, more quickly. But beyond that, it includes powerful workflow automation that makes it easy to actually do something with these metrics and benchmarks–driving sustained improvement in efficiency and overall team health.
The platform combines core operational data, engineering resourcing and cost telemetry, external metrics from CI/CD and APM tools, and project forecasting intelligence to provide you with a holistic view of the SDLC–as well as how to improve it.
The Benefits of Engineering Metrics
Engineering metrics provide valuable benefits for software development teams.
- They can increase developer productivity by surfacing bottlenecks
- They can help increase the overall quality of the products you ship
- Metrics can even help you reduce costs by alerting you early on about problems that may impact various stages of the software development life cycle
Implementing the right engineering metrics provides development leaders and business executives a shared language that both parties can align on–helping foster a better relationship between these groups, enabling engineering to meet business needs, and making it easier to prove engineering contribution to the bottom line.


