Over the past decade, DevOps has emerged as an organizational and strategic bridge between the development and operations processes within the software delivery cycle. The DevOps approach has created measurable business value and improved quality of life for individual contributors whose roles fall within these previously separate domains.
To formalize that measurement, DevOps Research and Assessment (DORA) defines a set of key metrics that quantify a software company’s capability to deliver products efficiently. The objective of observing and analyzing these metrics is to remove sources of friction at each stage of the development and deployment processes, from the initial commit of work on a ticketed item to the release of that code to end users in production.
This course is designed for those interested in deepening their understanding of DORA metrics and how these metrics can help businesses succeed.
A brief overview of DORA metrics
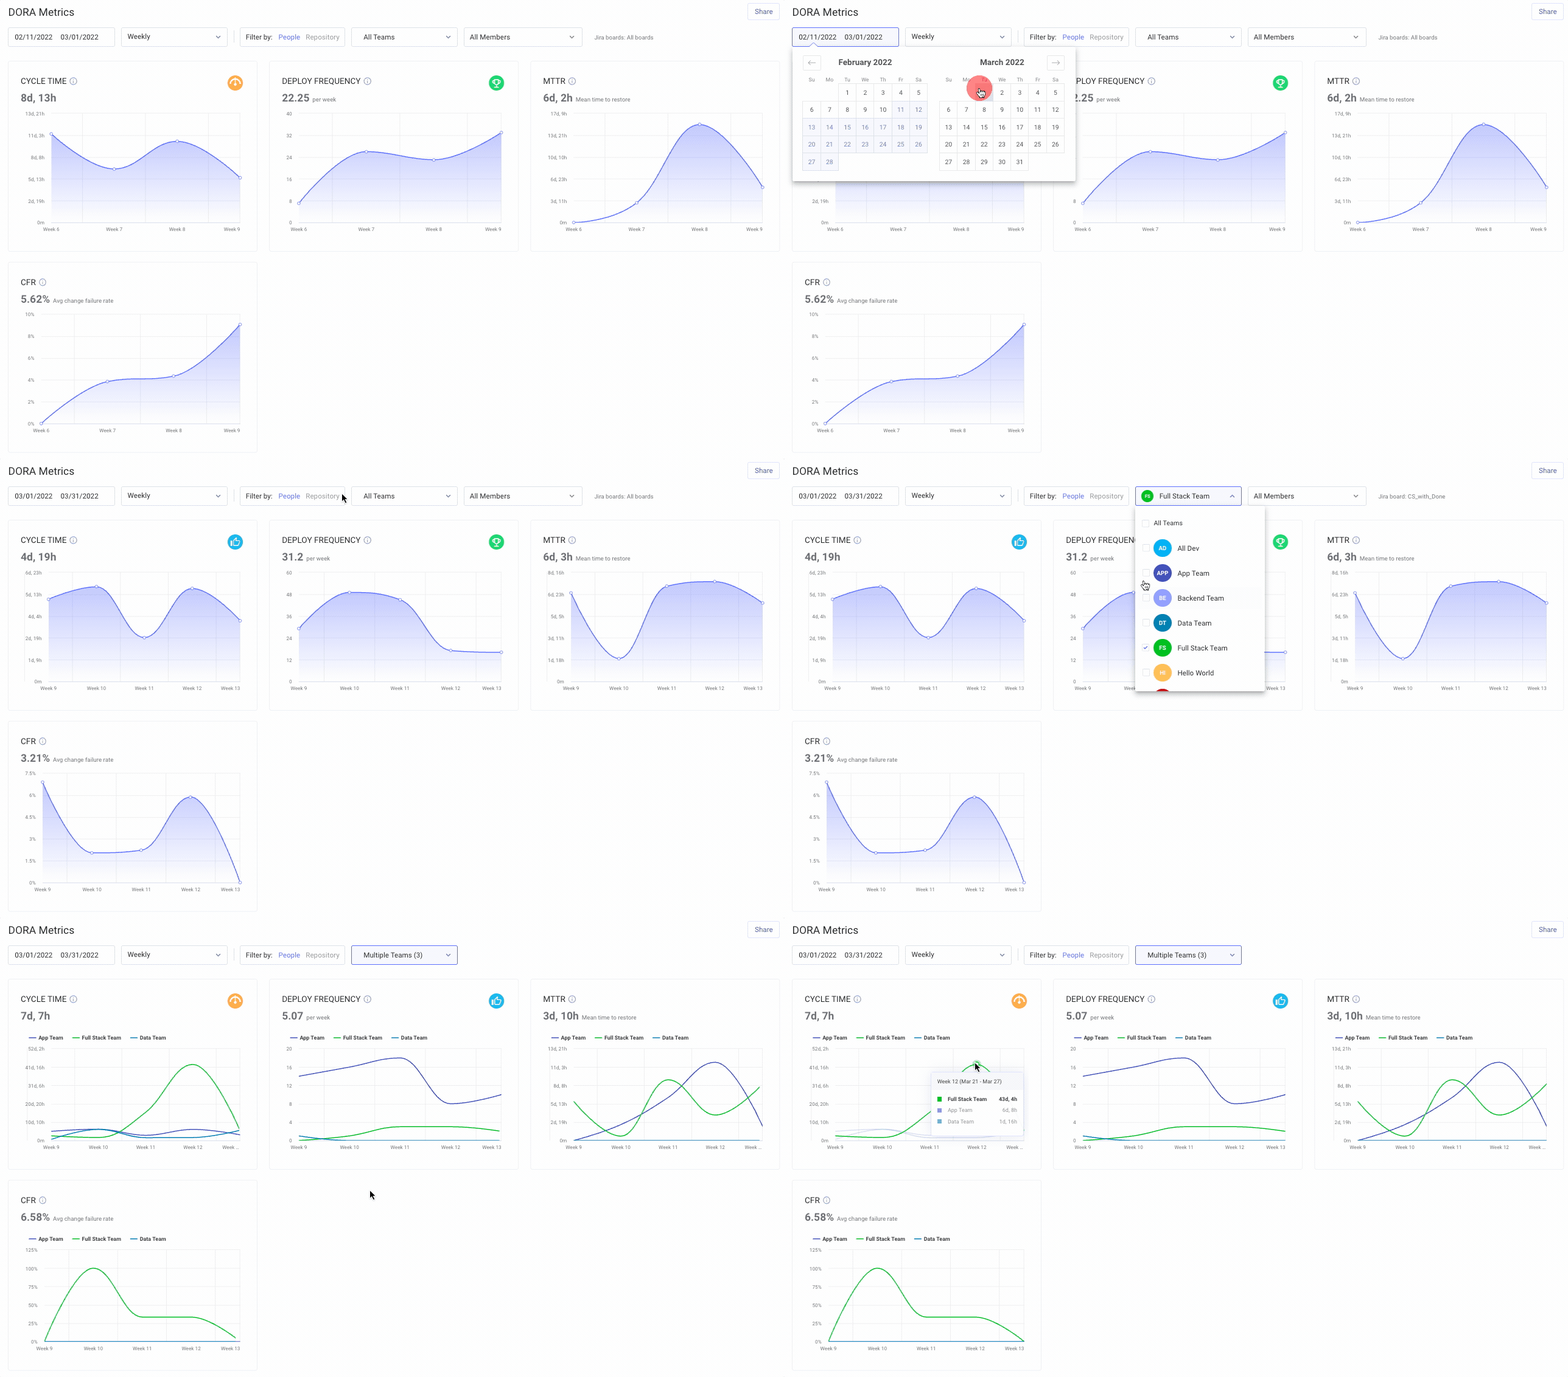 DORA metrics provide engineering leaders with finely tuned, real-time insights into bottlenecks and roadblocks as they emerge within their team’s delivery process. You can integrate them directly into your version-controlled continuous integration and continuous delivery (CI/CD) platforms.
There are four metrics that DORA captures to assess the performance of your organization’s development and operations processes:
- Lead Time for Changes — How long it takes your team to deliver code from the beginning of work to production deployment.
- Change Failure Rate — The rate at which new code deployments result in failures.
- Mean Time to Recovery (MTTR) — The average time it takes your team to resolve incidents in production.
- Deployment Frequency — How often your team successfully deploys code to production within a specified timeframe.
With its focus on team and organizational performance over that of individual contributors and its ability to identify worker overload and poorly scoped delivery tasks, DORA works to decrease burnout while building processes that increase productivity and team members’ job satisfaction.
And because DORA gathers this data from many thousands of software delivery teams and organizations, we can see engineering benchmarks to compare your business’ software delivery process with your competitors and partners across the industry — enabling you to identify areas for targeted improvement.
Course prerequisites
This course will give you deeper insight into the key DORA metrics and what they can teach you about improving your organization’s software delivery process. You’ll learn to harness the power of metrics platforms to turn those insights into action and generate real value for your business while reducing burnout and increasing the effectiveness of your development and operations teams.
To get the most out of this course, you should understand current development and DevOps tools and practices, including version control systems like Git, project management tools, and CI/CD solutions.
Course sections
This course on mastering DORA covers each metric with details on the core ways they apply to engineering teams, how to analyze them, and most importantly, how to improve them.
1- How To Improve Lead Time For Changes (aka Cycle Time)
2- How To Improve Change Failure Rate
3- How To Improve Mean Time To Recovery (MTTR)
4- How To Improve Deployment Frequency
Tools for mastering DORA metrics
At LinearB, we provide engineering leaders with a powerful and highly customizable suite of tools, dashboards, and visualizations that integrate with your existing project management, version control, and CI/CD platforms. Measuring and analyzing your organization’s DORA metrics lets you take action to improve the productivity and satisfaction of your teams.
These tools include:
- LinearB Metrics, which provides an analytic and predictive metrics platform to view and share your team’s DORA data with stakeholders
- gitStream, which integrates with your version control system to streamline and eliminate bottlenecks from the code review and release processes
- WorkerB, which automates your development and communication process by integrating with your existing project management, version control, and CI/CD platforms to eliminate manual work
Getting started with LinearB
To capture and analyze your team’s DORA metrics for free, create an account. Our metrics dashboard integrates with your existing project management solutions like Jira Software, source code control systems like GitHub and GitLab, CI/CD platforms including Jenkins and CircleCI, and communications platforms like Slack and Microsoft Teams.
To learn how to connect LinearB to your Git provider, check out the LinearB docs, and to connect to your project management platform, follow the instructions here.
Once you’ve connected these tools to your account, you can begin experiencing the power of our finely tuned metrics and automation solutions.
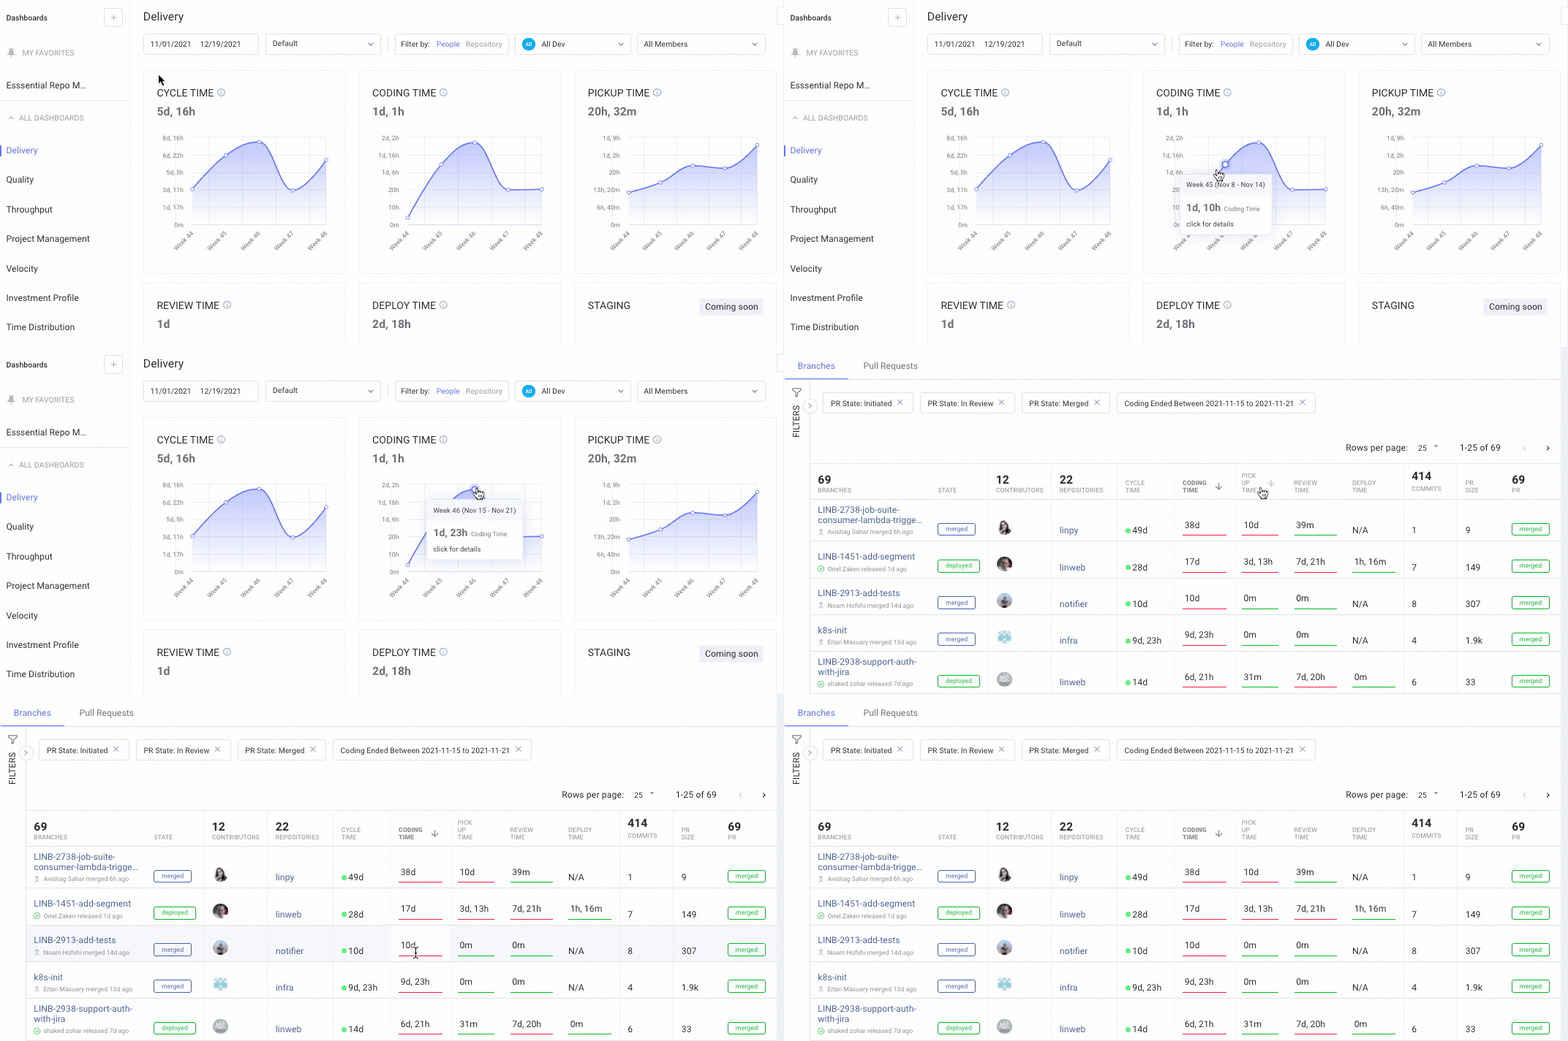
What comes after mastering each DORA metric?
Once you’ve established a DevOps Research and Assessment (DORA) analytics practice within your team and have explored your different metric ratings, you’ll want to do the following:
- Create an improvement plan — Creating an improvement plan is crucial once you’ve established a DORA analytics practice within your team and explored your metric ratings. Use engineering benchmarks to identify areas of weakness or where metrics are lacking, set clear, obtainable goals for new performance objectives, and implement targeted strategies for enhanced performance and efficiency.
- Expand metrics and monitoring — To further strengthen your analytics practice, expand metrics and monitoring capabilities. Embrace a comprehensive approach by incorporating additional relevant metrics, providing a more nuanced understanding of your team’s workflow and areas for optimization.
- Integrate DORA metrics with business metrics — Integrate DORA metrics with business metrics to align technical practices with overarching business objectives.
Pitching improvements to leadership
With this information, you’re ready to pitch your improvements to your engineering leadership and get recognition for your efforts. Remember that while these DORA metric values may seem inherently valuable to you and your development team, leadership may not find these insights as apparent.
Let’s review how you can leverage LinearB to visualize and present this information to leadership in a clear, persuasive way that highlights business value — and draws attention to your contributions.
Quantifying the business impact
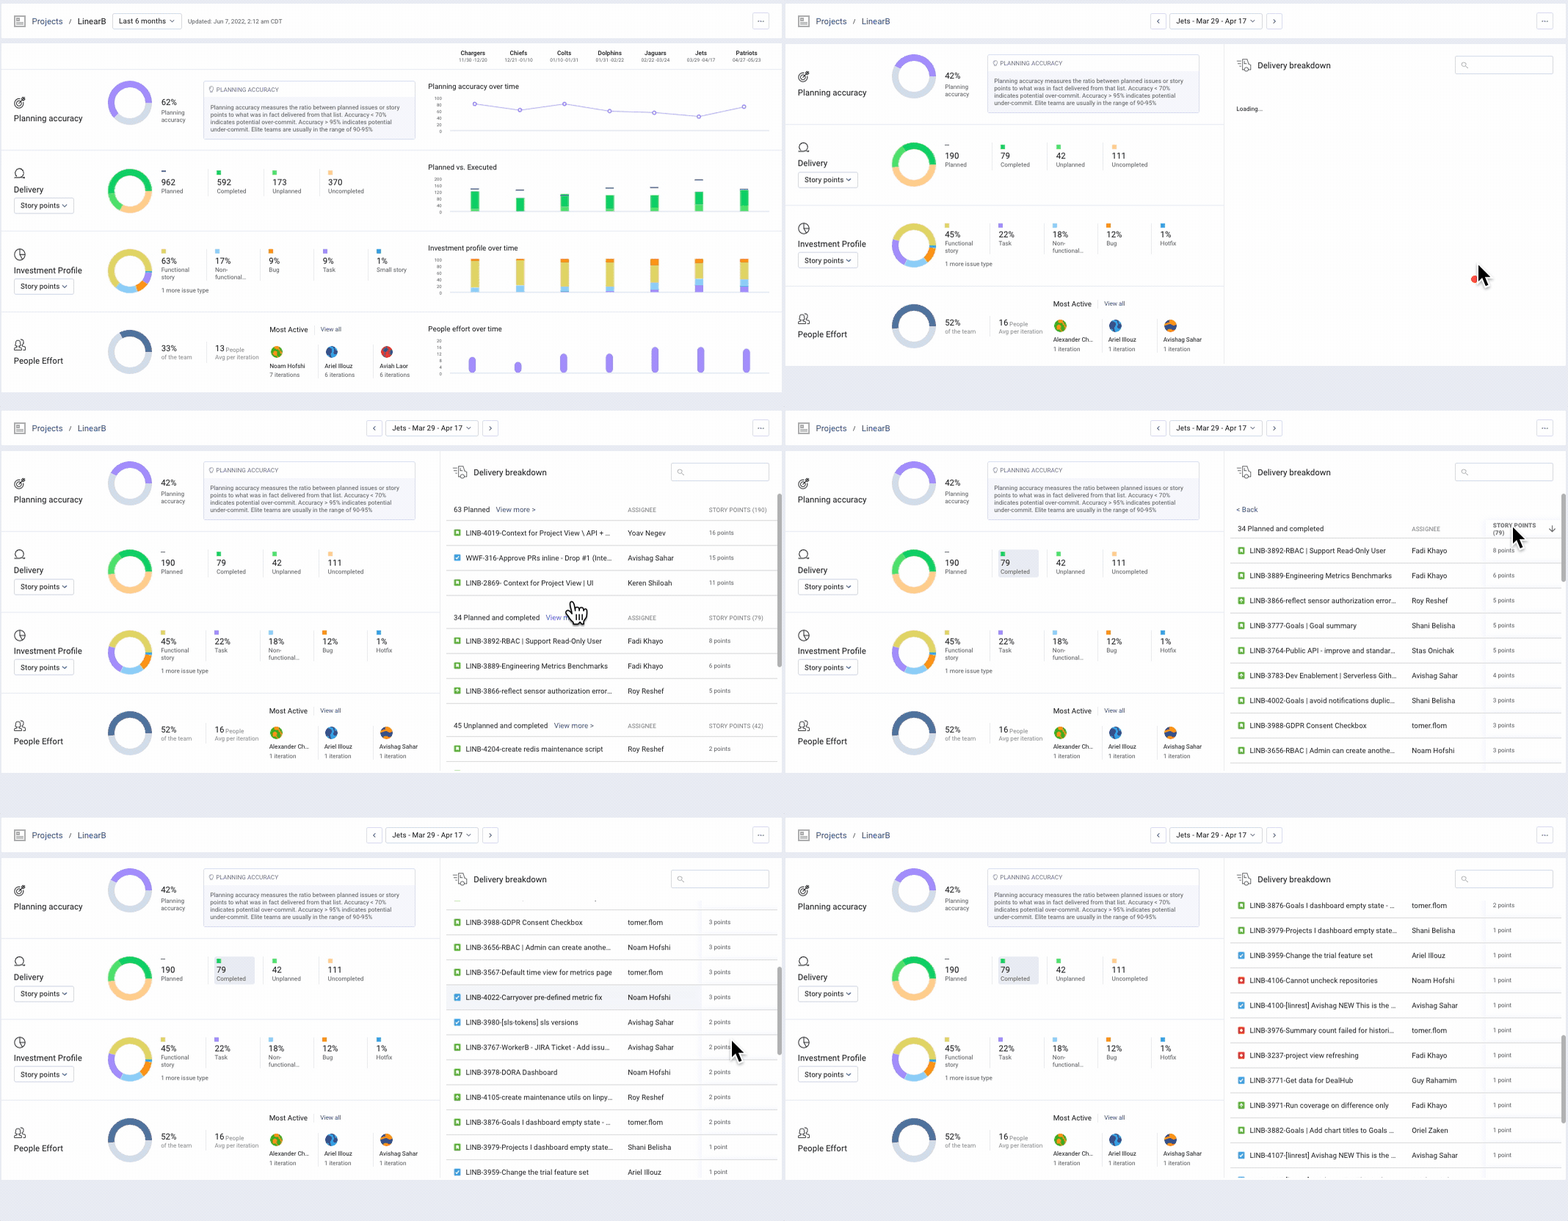
When you’re ready to go beyond the basics of tracking your organization’s DORA metrics, several more robust tools are available from help translate improvements in engineering efficiency directly into business value. Project delivery dashboards overlay engineering metrics with project management timelines to provide a higher degree of accuracy in forecasting product delivery, helping to scope tasks and capture the impact of unplanned work.
![]()
And you can drill into each project to capture detailed historical data on metrics like sprint goal commitments, work prioritization, and people effort per sprint.
Relating DORA metrics to larger business goals
Resource allocation tools allow you to relate DORA goals to broader business goals, demonstrating that improving upon your engineering department’s DORA metrics aids the company as a whole.
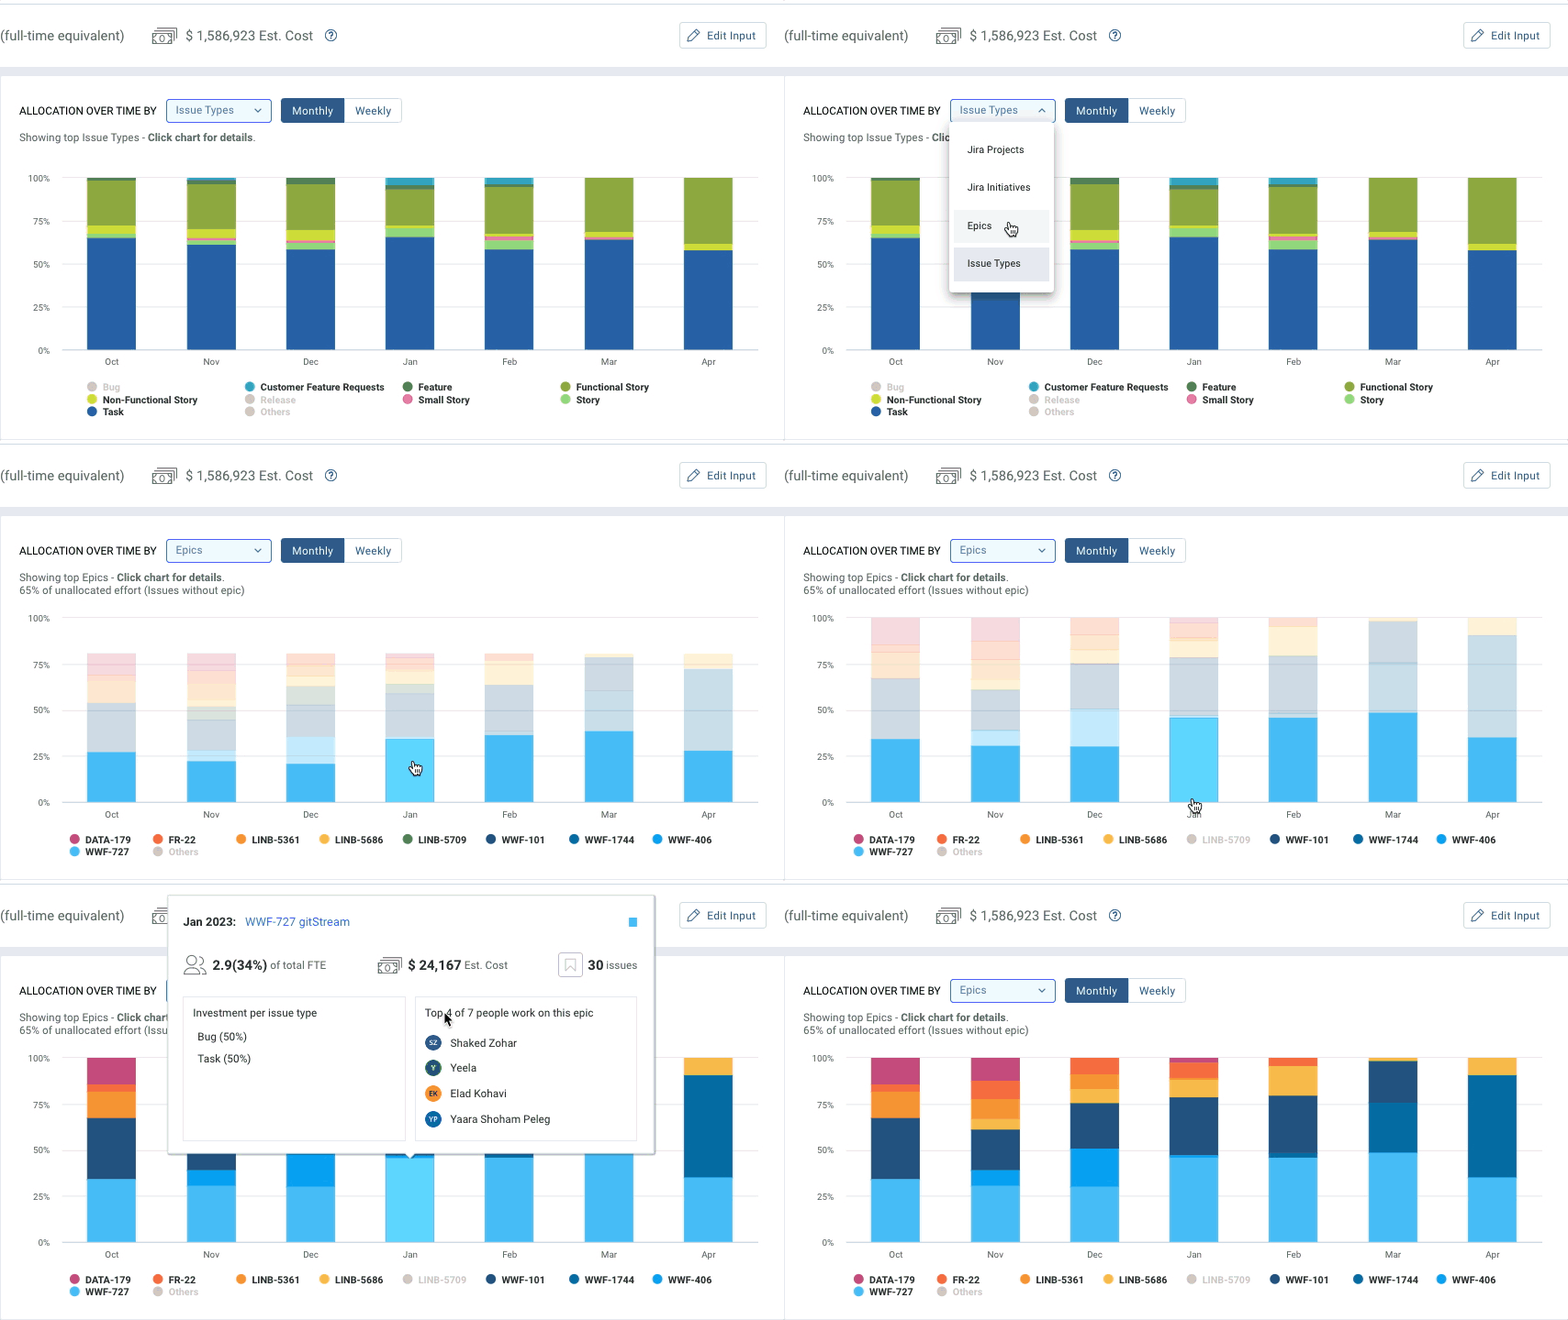
As you begin using these metrics to support your business goals, learn more about resource allocation tools and how they can help you use DORA metrics to support this process.
Congratulations! You're ready to lead an elite engineering organization.
And with that, we’ve concluded your course on the DevOps Research and Assessment metrics. You know what they are, their impact on business, and strategies for improving -- and optimizing -- your Lead Time for Changes, Change Failure Rate, Mean Time to Recovery, and Deployment Frequency metrics.


