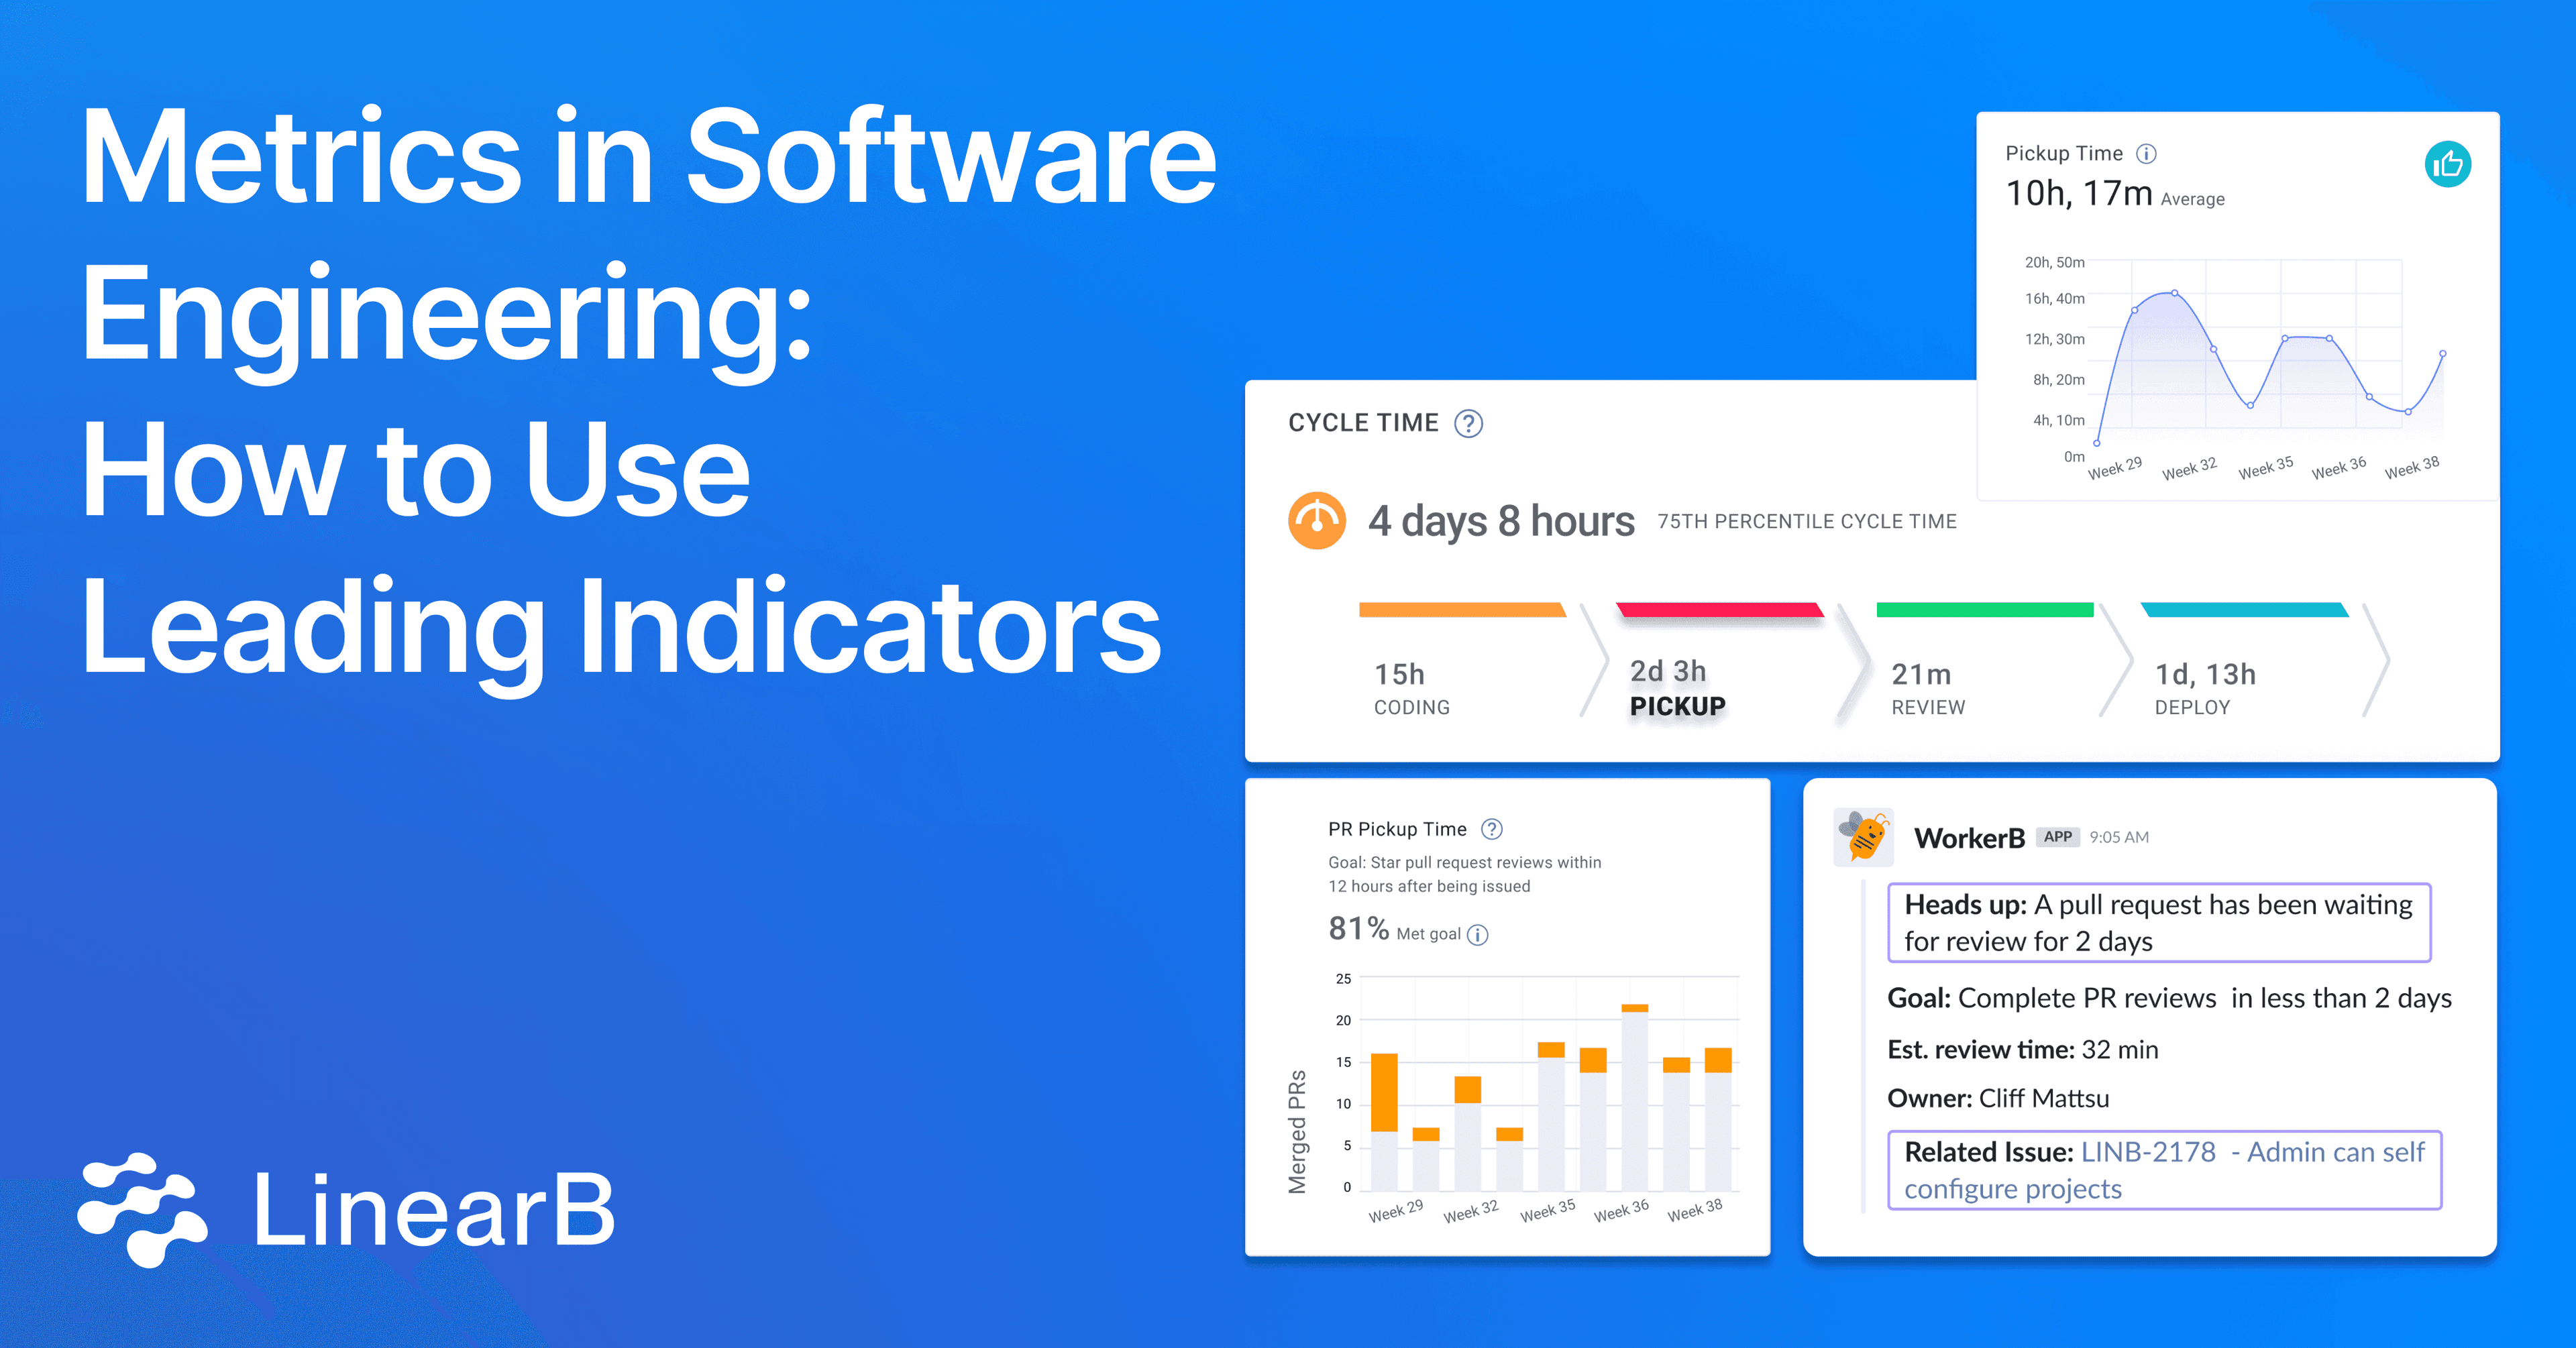
Once you get a baseline understanding of the different metrics in software engineering, you need to use them to improve engineering team performance and code quality. To start your improvement journey, you have to understand the distinction between lagging indicators that show past performance like the DORA Metrics, and leading indicators that predict future performance.
When applied effectively, engineering teams can enhance engineering efficiency and code quality through the focused improvement of leading indicators like:
- Pull Request (PR) Size
- PR Review Time
- PR Pickup Time
- Rework Rate
- Refactor Rate
- Review Depth
- PRs Merged Without Review
This blog will cover leading quantitative indicators and how to leverage them to improve your engineering team’s performance.
Leading Indicators That Affect Engineering Efficiency
PR Size
Definition: PR size measures the average amount of code changes in a pull request.
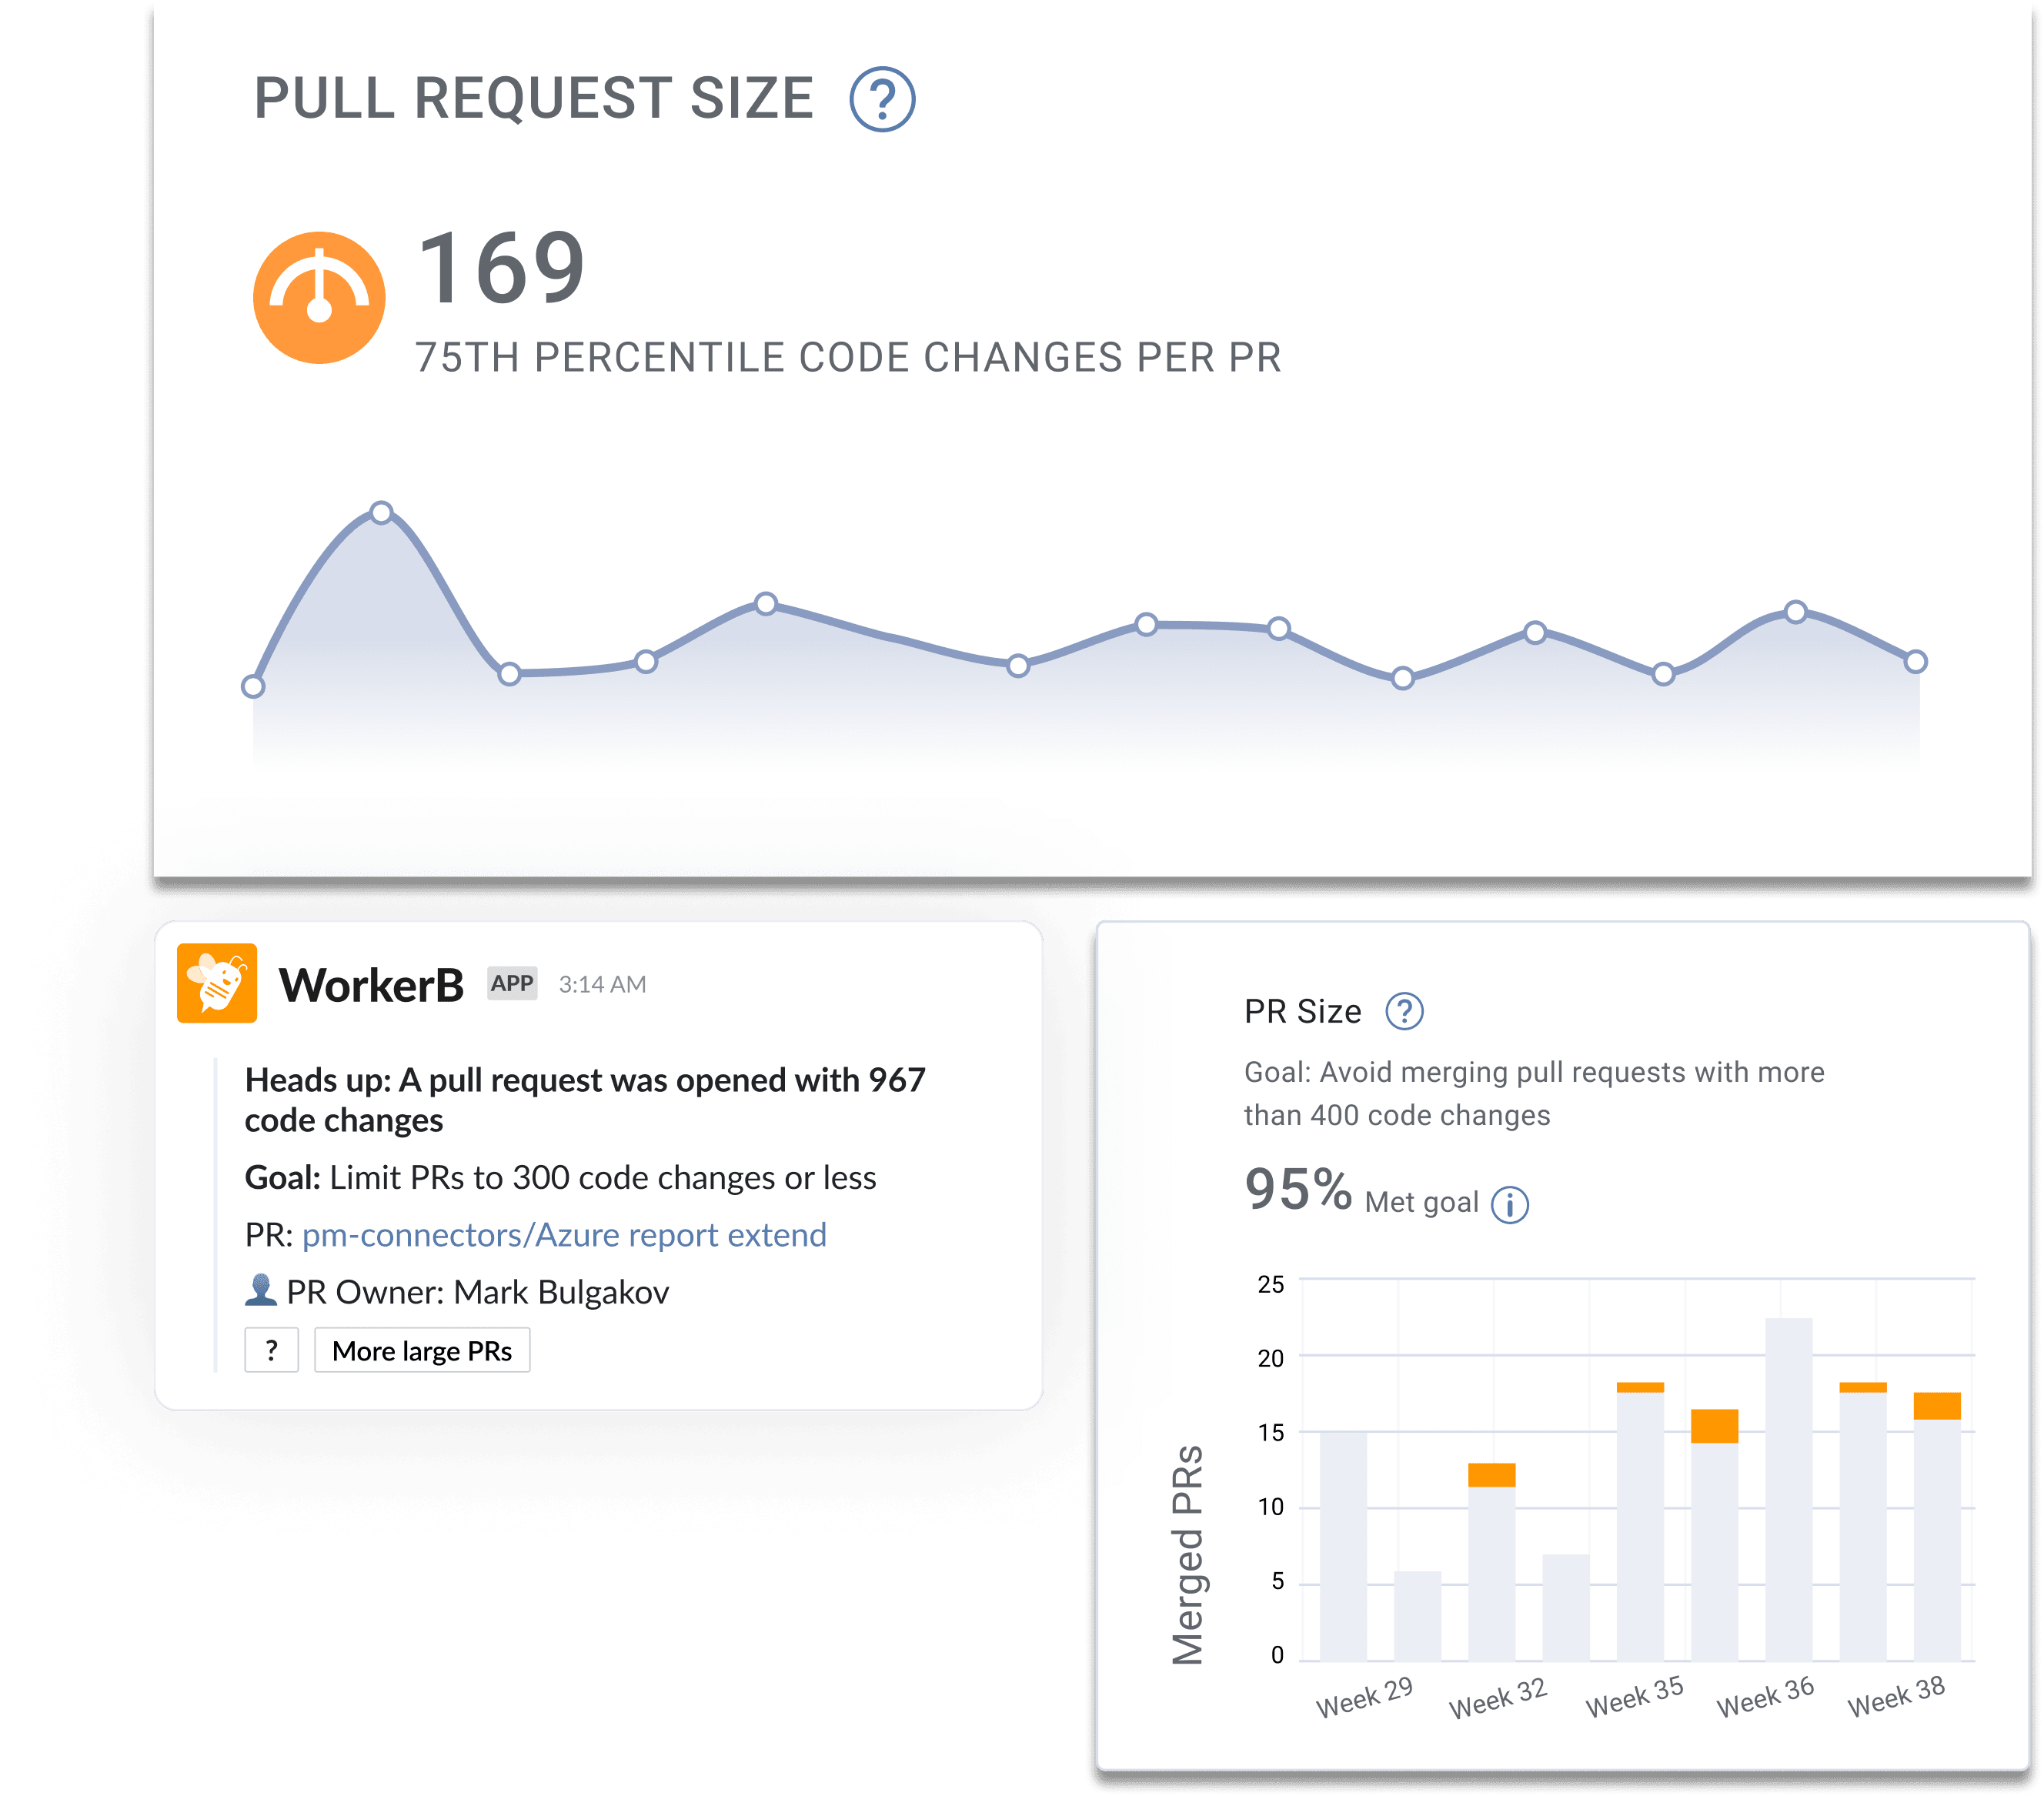
PR size is a leading indicator for cycle time and code quality. Our Software Engineering Benchmarks research shows that smaller PRs are easier to test and review, get picked up faster, and help drive your team’s engineering efficiency.
Smaller PRs also allow for more thorough reviews because developers aren't overwhelmed by numerous changes. This increases the likelihood of identifying problems within the code, improves code quality, and enhances collaboration.
Engineering leaders can create a more productive development environment by encouraging and tracking smaller PRs, which will lead to more reliable software delivery.
Recommendation: Teams should keep PR size to less than 98 code changes.
PR Pickup Time
Definition: Pickup time is the time between when someone creates a PR and when a code review has started.
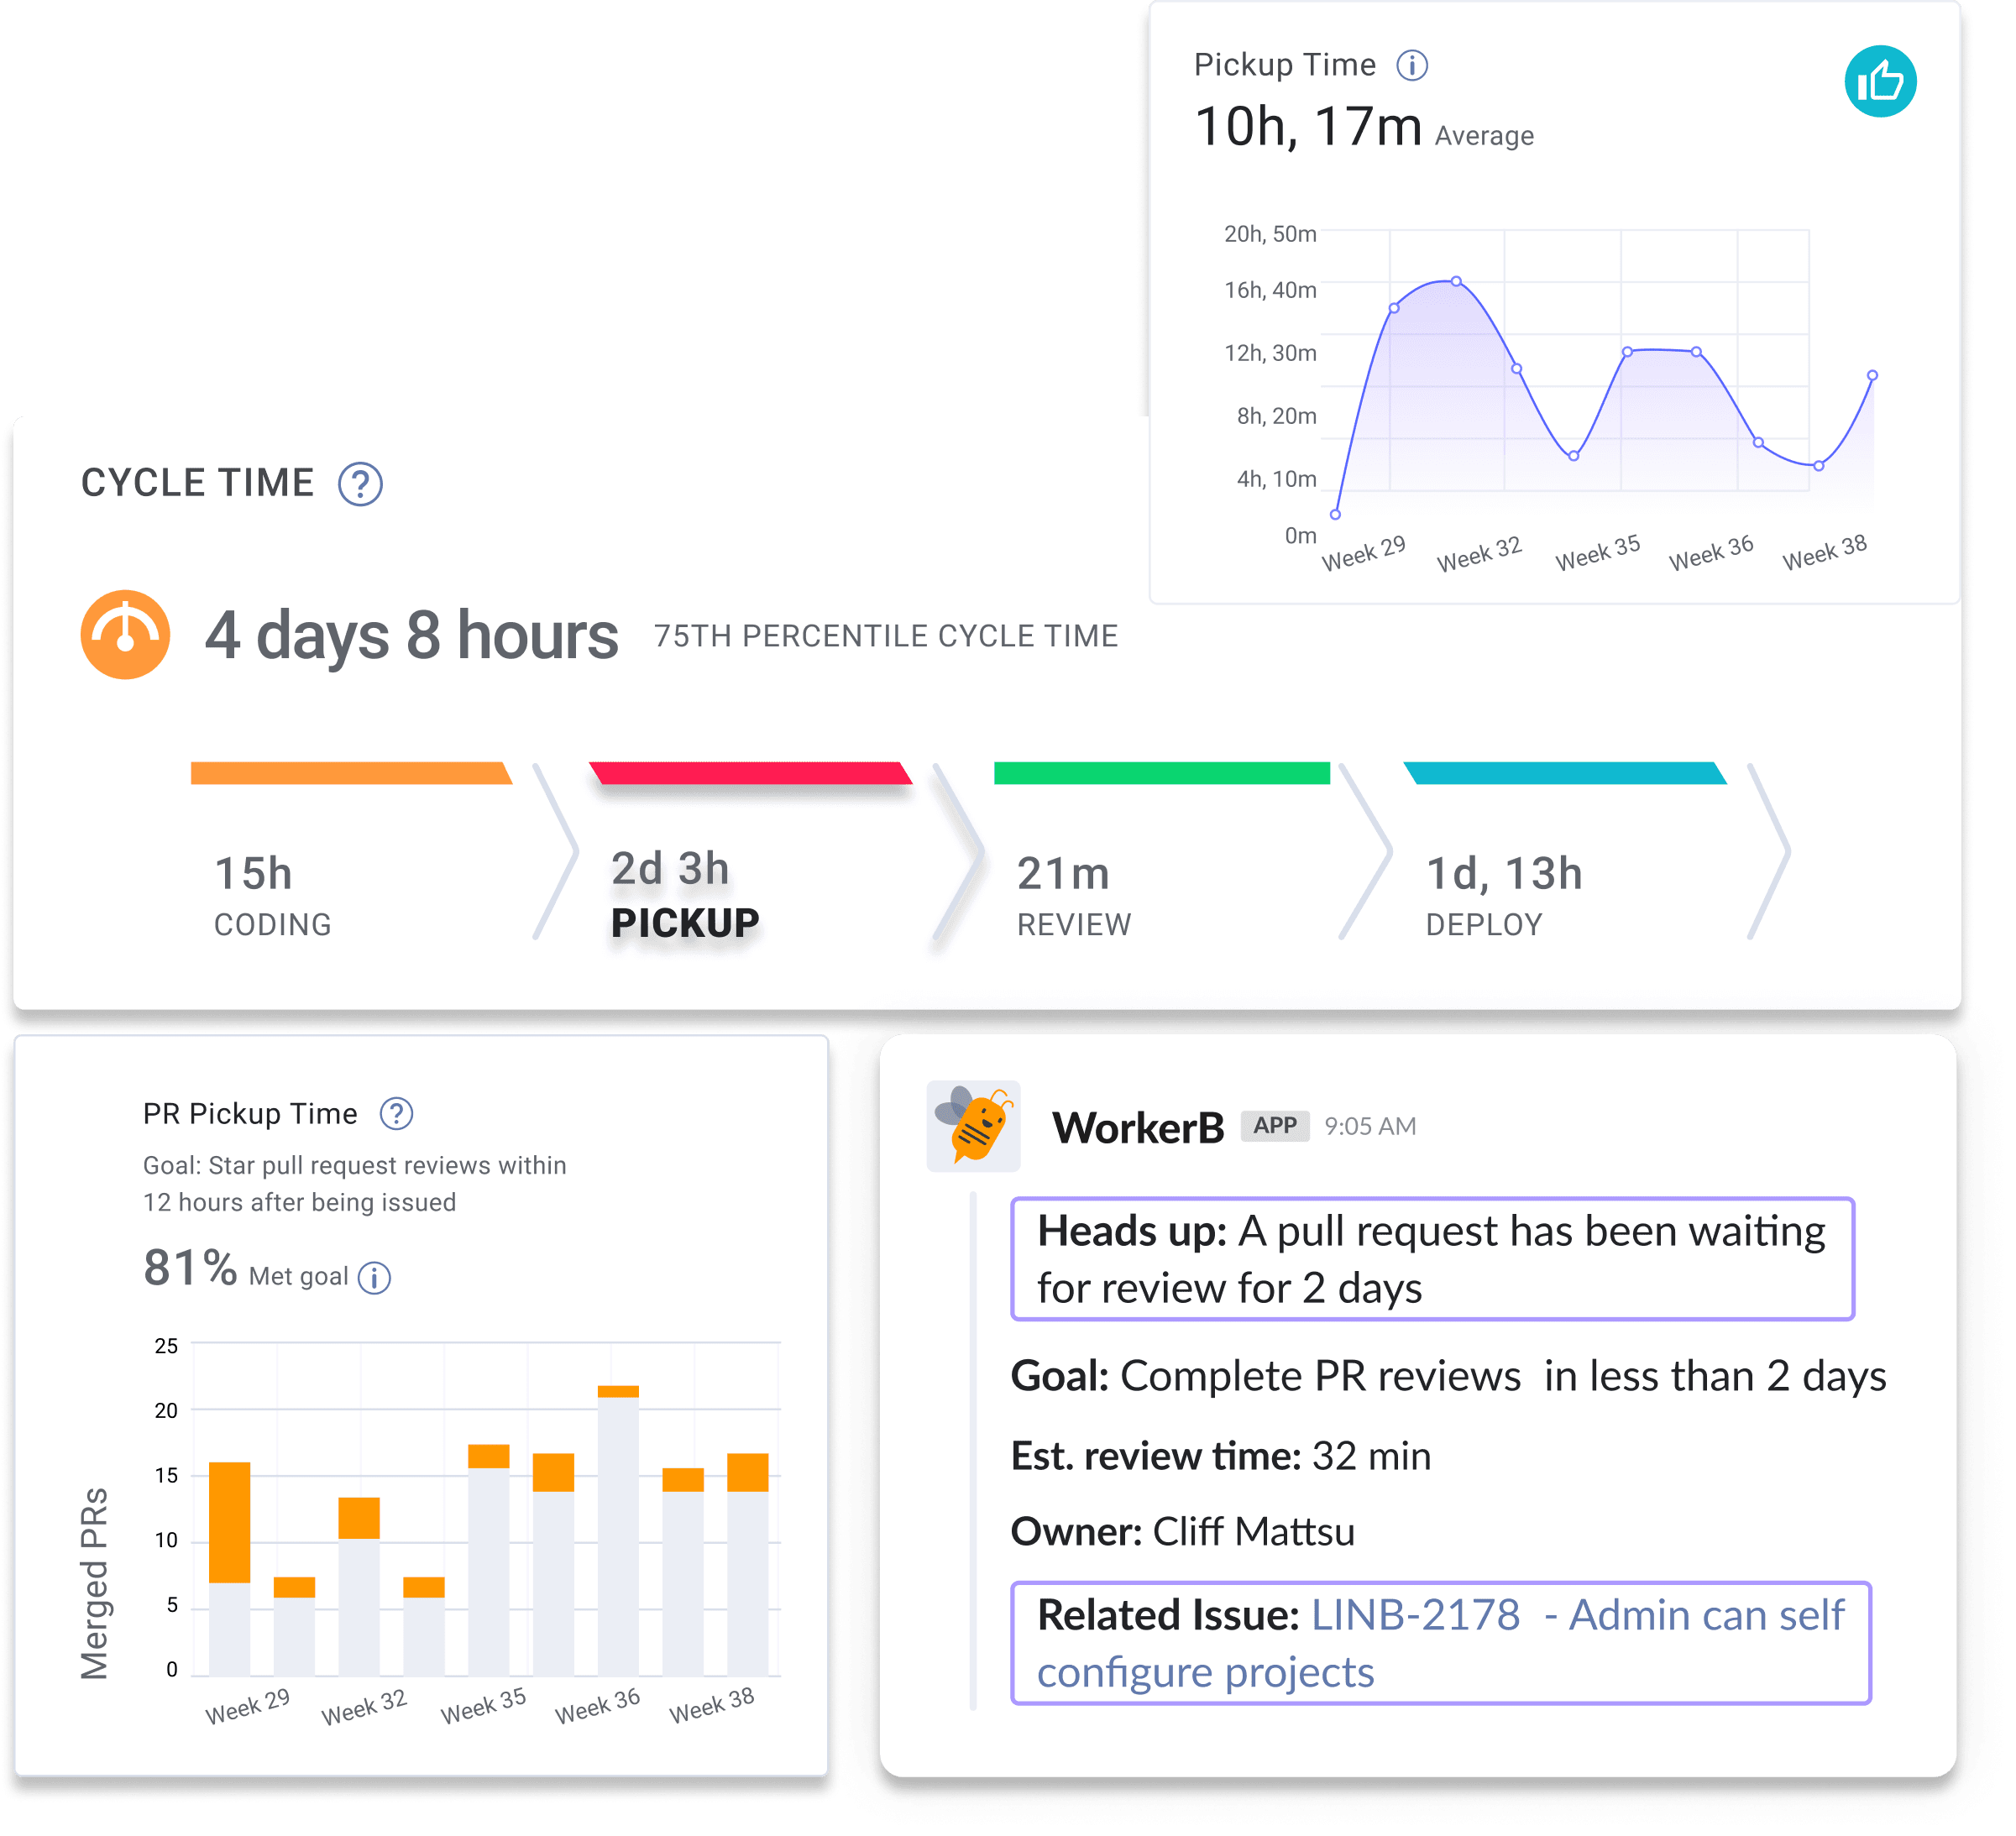
Research shows that PR pickup and review time are the most frequent sources of software delivery inefficiency. Long pickup times reduce developer productivity and negatively impact developer experience by hurting developers’ ability to achieve a flow state.
Improving pickup and review time is one of the quickest paths to improvement in software delivery efficiency.
Recommendation: Teams should keep PR pickup time to an hour or less.
PR Review Time
Definition: Review time is the time between the start of a code review and when someone merges the code.
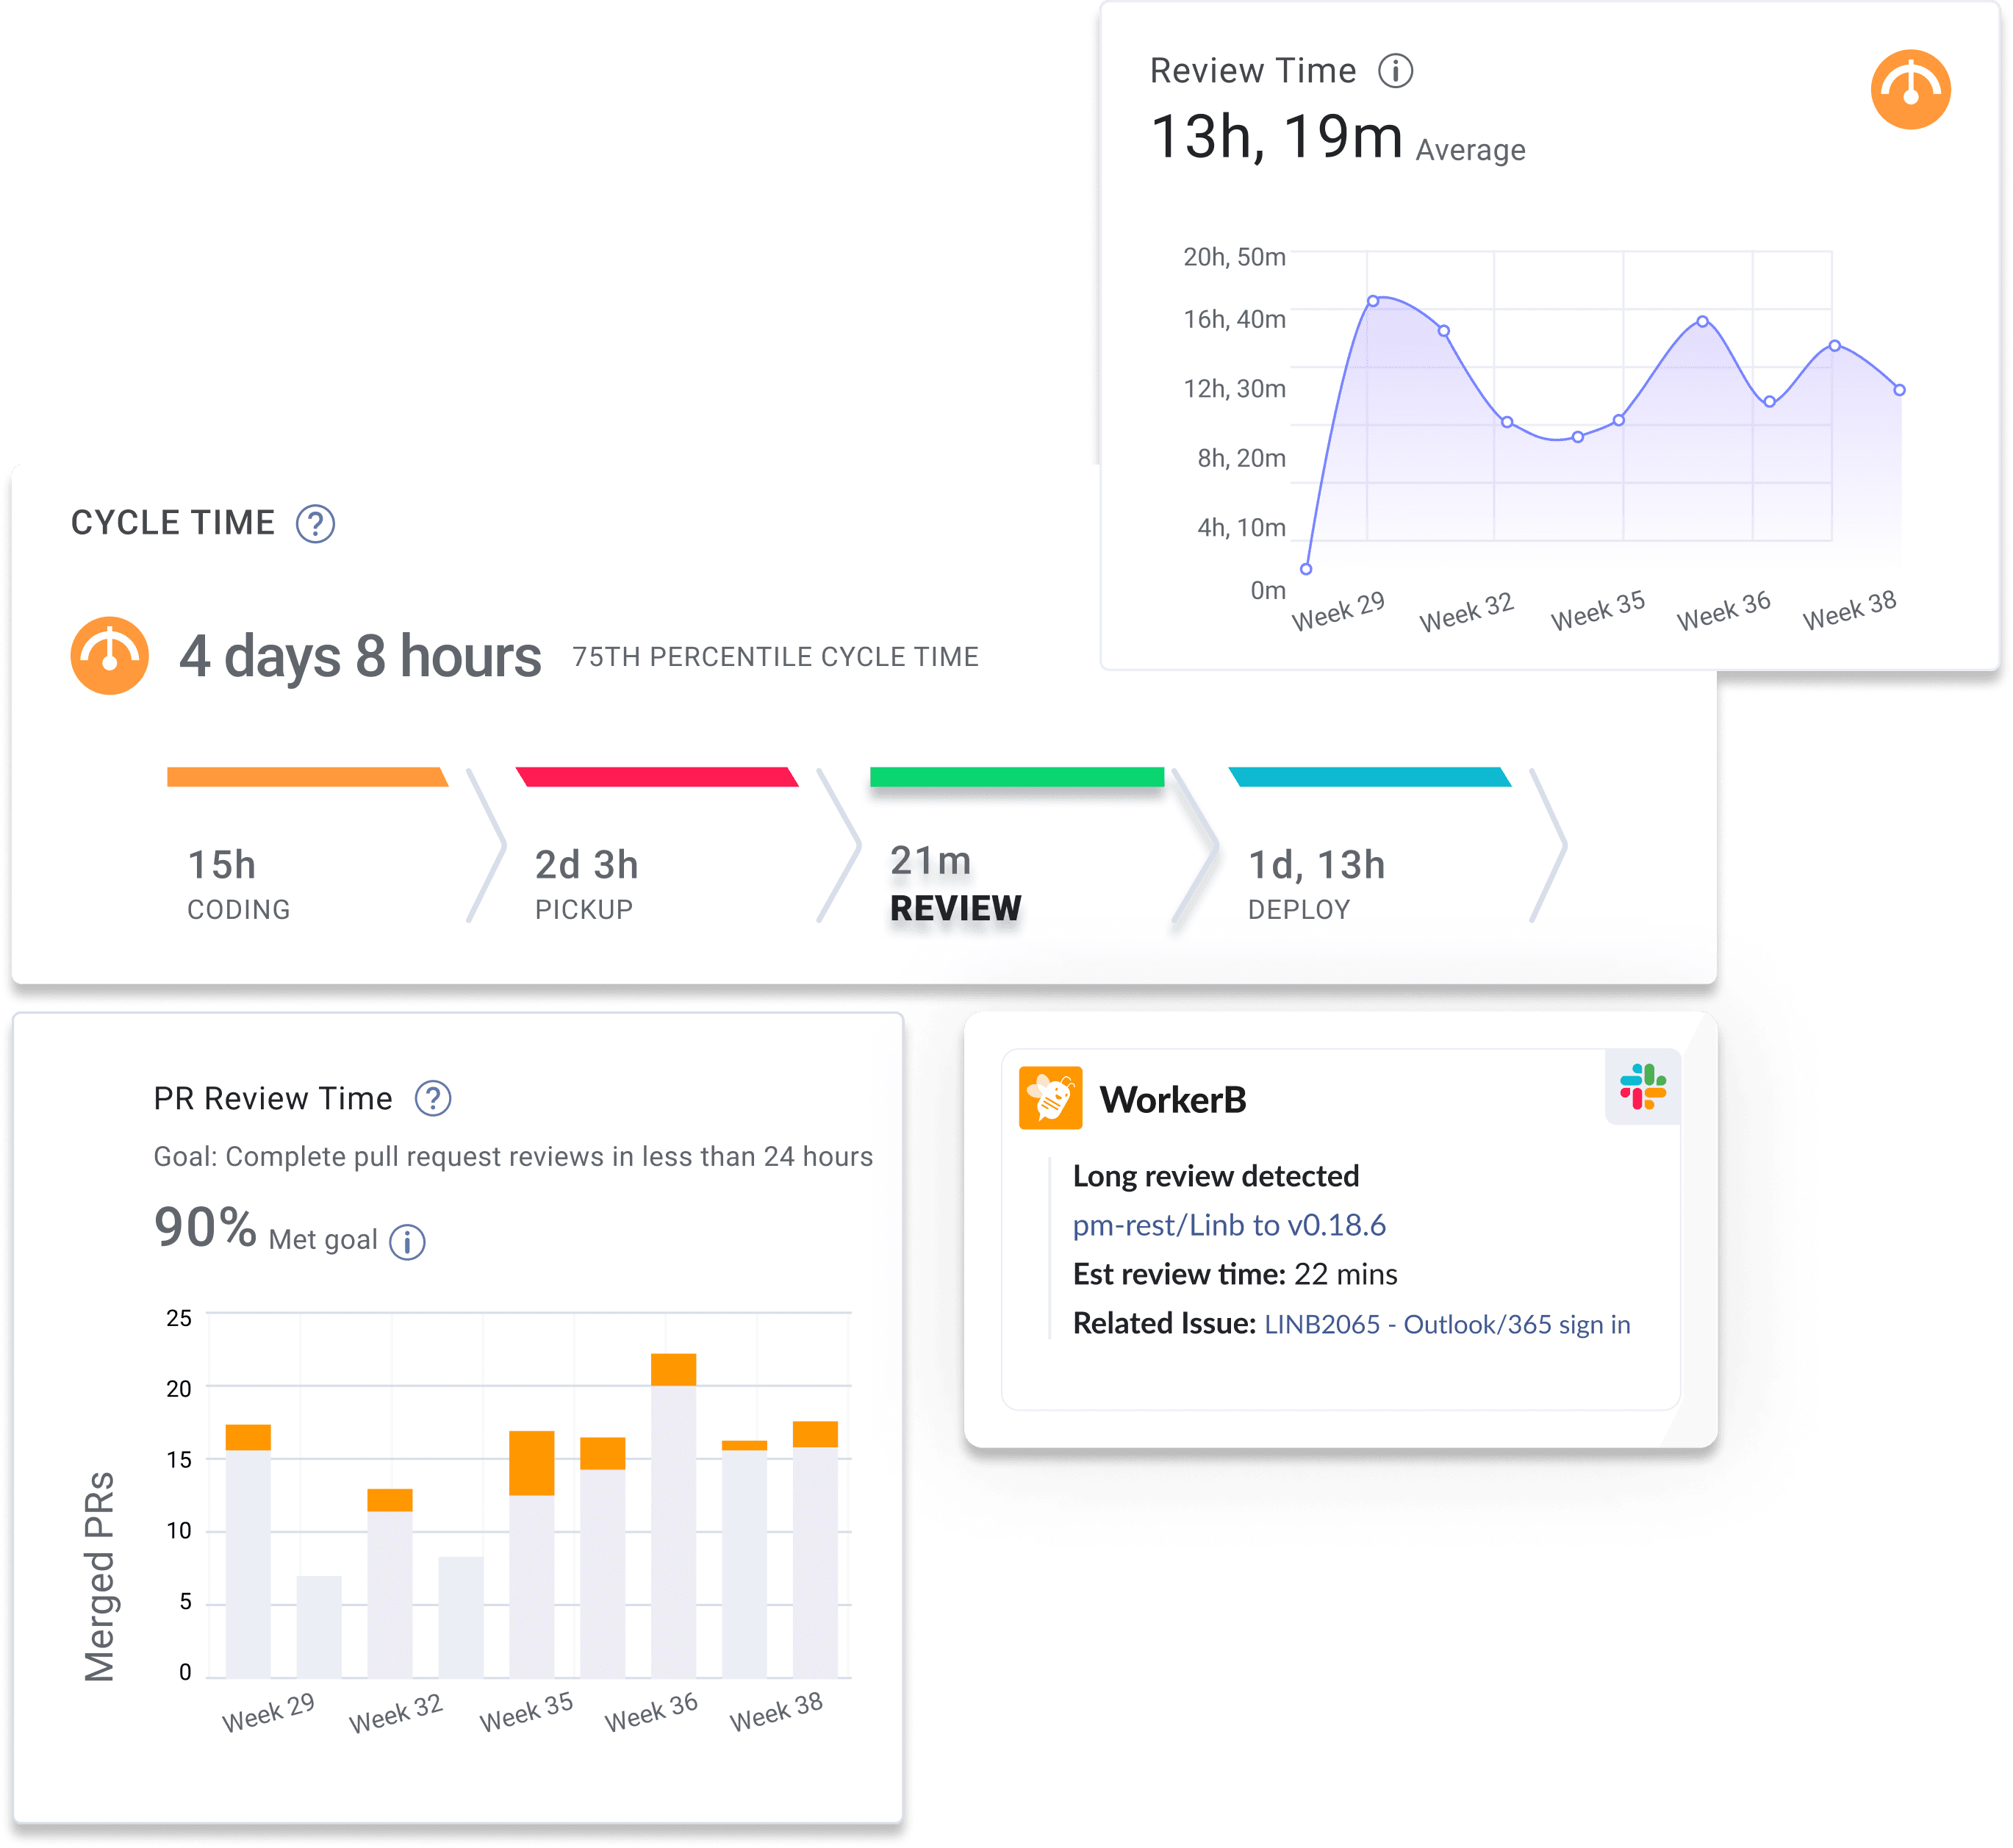
Long review times hamper both developer productivity and developer experience. When your team has long review times, it can indicate that they are overworked, more code expertise is needed to distribute review responsibilities, or your organization might have unclear policies and processes for the merge process.
Recommendation: Teams should keep PR review time to a half hour or less.
Insights on the PR Review Process
The PR review process is a critical component of the software development lifecycle, influencing engineering efficiency and code quality. Longer PR pickup and review times can lead to delays and decreased developer productivity.
The longer a PR sits waiting for a review, the more likely it is for the developer to move onto another line of work. The longer a developer spends away from a PR they authored, the less fresh the code’s context will be in their mind when they receive feedback When the review actually starts, it takes the developer longer to address comments and move the PR along, reducing efficiency.
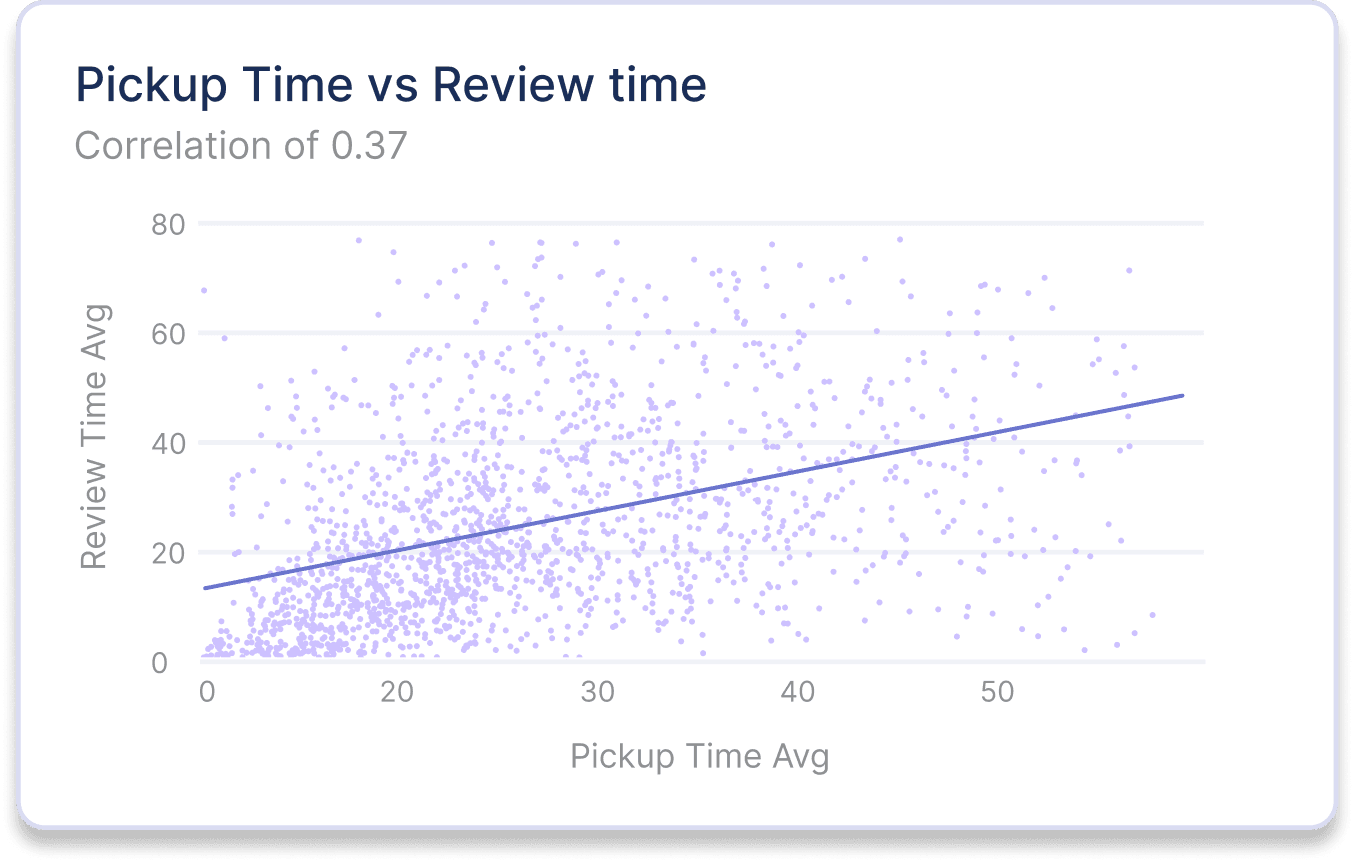
Key Insights:
Correlation with Cycle Time: Extended review cycles often result in longer cycle times, affecting overall delivery speed.
Impact of Context Switching: Developers who frequently context switch struggle to review PRs efficiently, leading to longer review times.
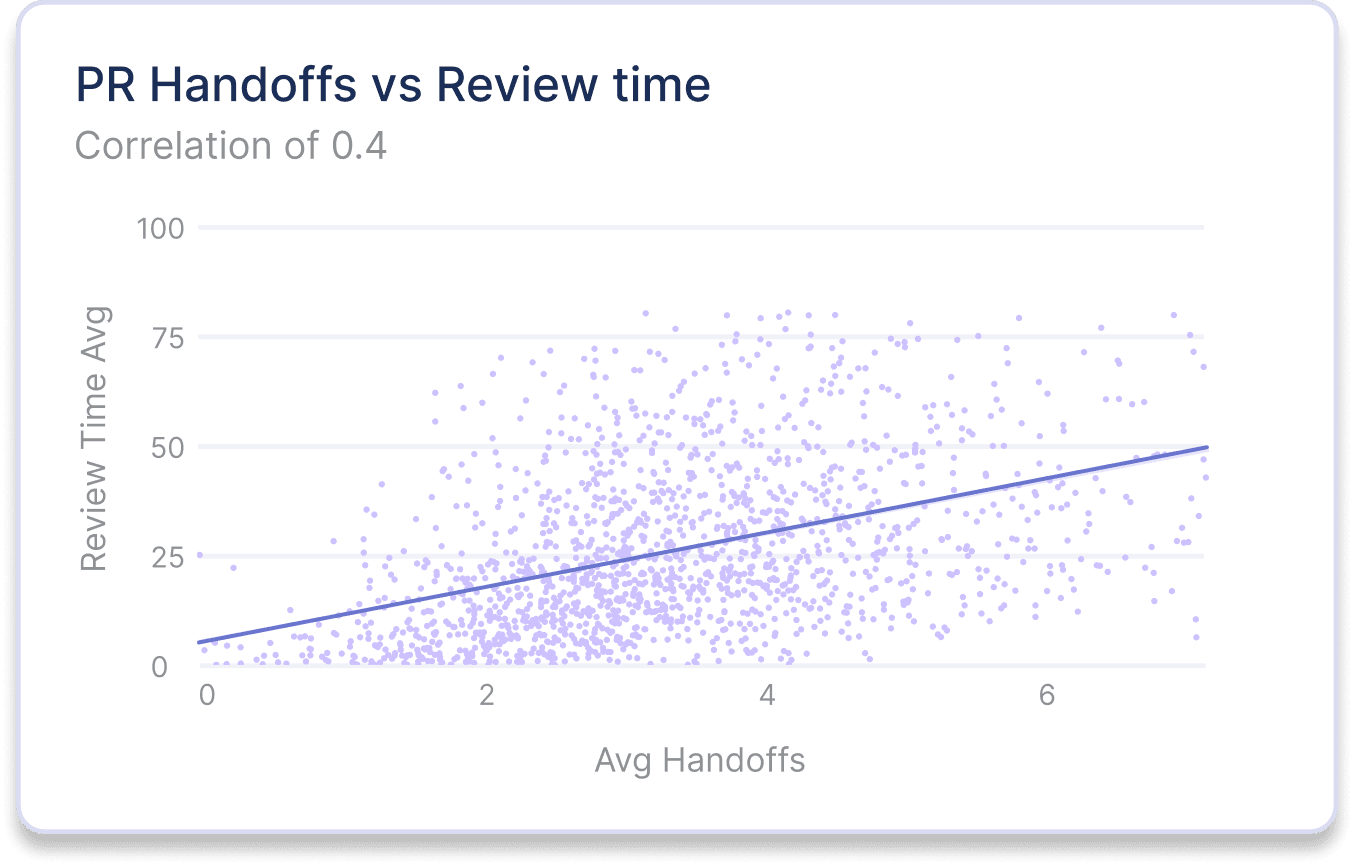
Number of Handoffs: PRs with a higher number of handoffs will have a longer review time.
Reducing PR Pickup and Review Time
Reducing PR pickup and review time is crucial for streamlining the software development lifecycle and maintaining a steady workflow. To improve these critical metrics in software engineering, we recommend implementing pull request routing. Pull request routing automates merge pathways to unblock code reviews while efficiently enforcing code quality standards.
We recommend these best practices:
1. Automate review responsibility allocation to balance distributing institutional knowledge with targeted expert reviews, ensuring breadth and depth in your code review capabilities. Ensure reviewers have all the information they need to make adequate decisions about code quality.
2. Reduce the cognitive load of code reviews through automation, static analysis, improved CI/CD pipelines, and contextual notifications to keep developers informed throughout development.
3. Automate security and compliance enforcement to minimize the burden of remembering complex processes and requirements. Implement guardrails that guide developers toward best practices during the code review process.
The Relationship Between Merge Frequency and PR Pickup and Review Time
Merge frequency is a leading indicator of developer experience and software delivery pipeline health. Teams with higher merge frequencies have fewer review cycle bottlenecks that frustrate developers and slow code delivery.
Recommendation: Optimizing for merge frequency is one of the most important steps in creating an elite developer experience and improving retention.
Research shows a negative correlation between merge frequency and pickup time, as well as merge frequency and review time. The longer a PR sits before getting picked up, the lower an organization’s merge frequency will be. Conversely, when PR review & pickup time lag, your team will merge fewer PRs over the same amount of time.
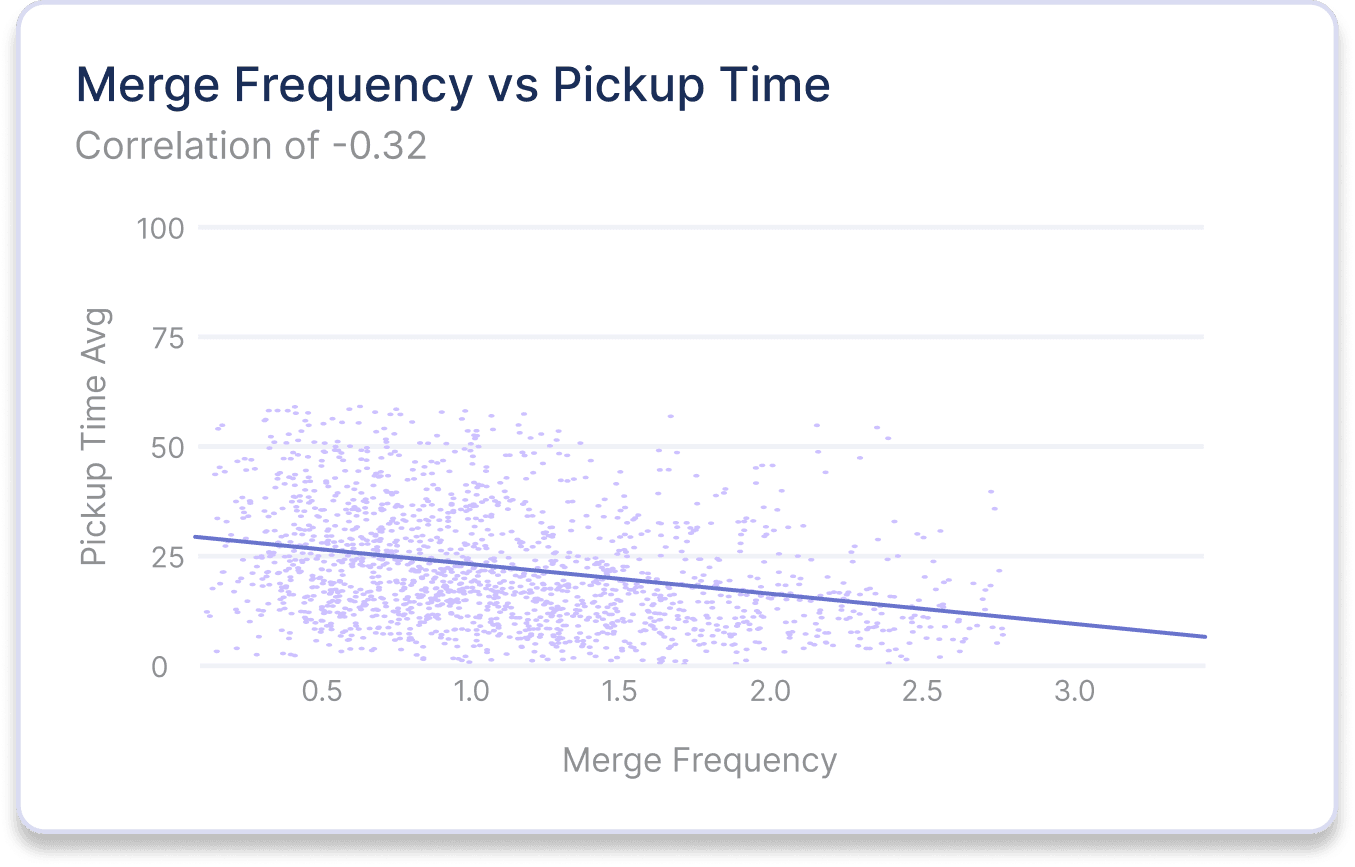

Of cycle time metrics in software engineering, PR pickup time has the strongest correlation with quantitative developer productivity measures. This suggests that PR pickup time is the primary metric of cycle time that affects inefficiencies and idle time.
Improvement Strategies:
Streamline your PR processes. Encourage small, frequent PRs to facilitate quicker reviews and merges.
Optimize your review workflows using automations to reduce delays and ensure timely reviews.
Foster a culture of teamwork, collaboration, and open communication to enhance merge frequency.
Leading Indicators That Affect Code Quality
Review Depth
Definition: Review depth measures the average number of comments per pull request review.
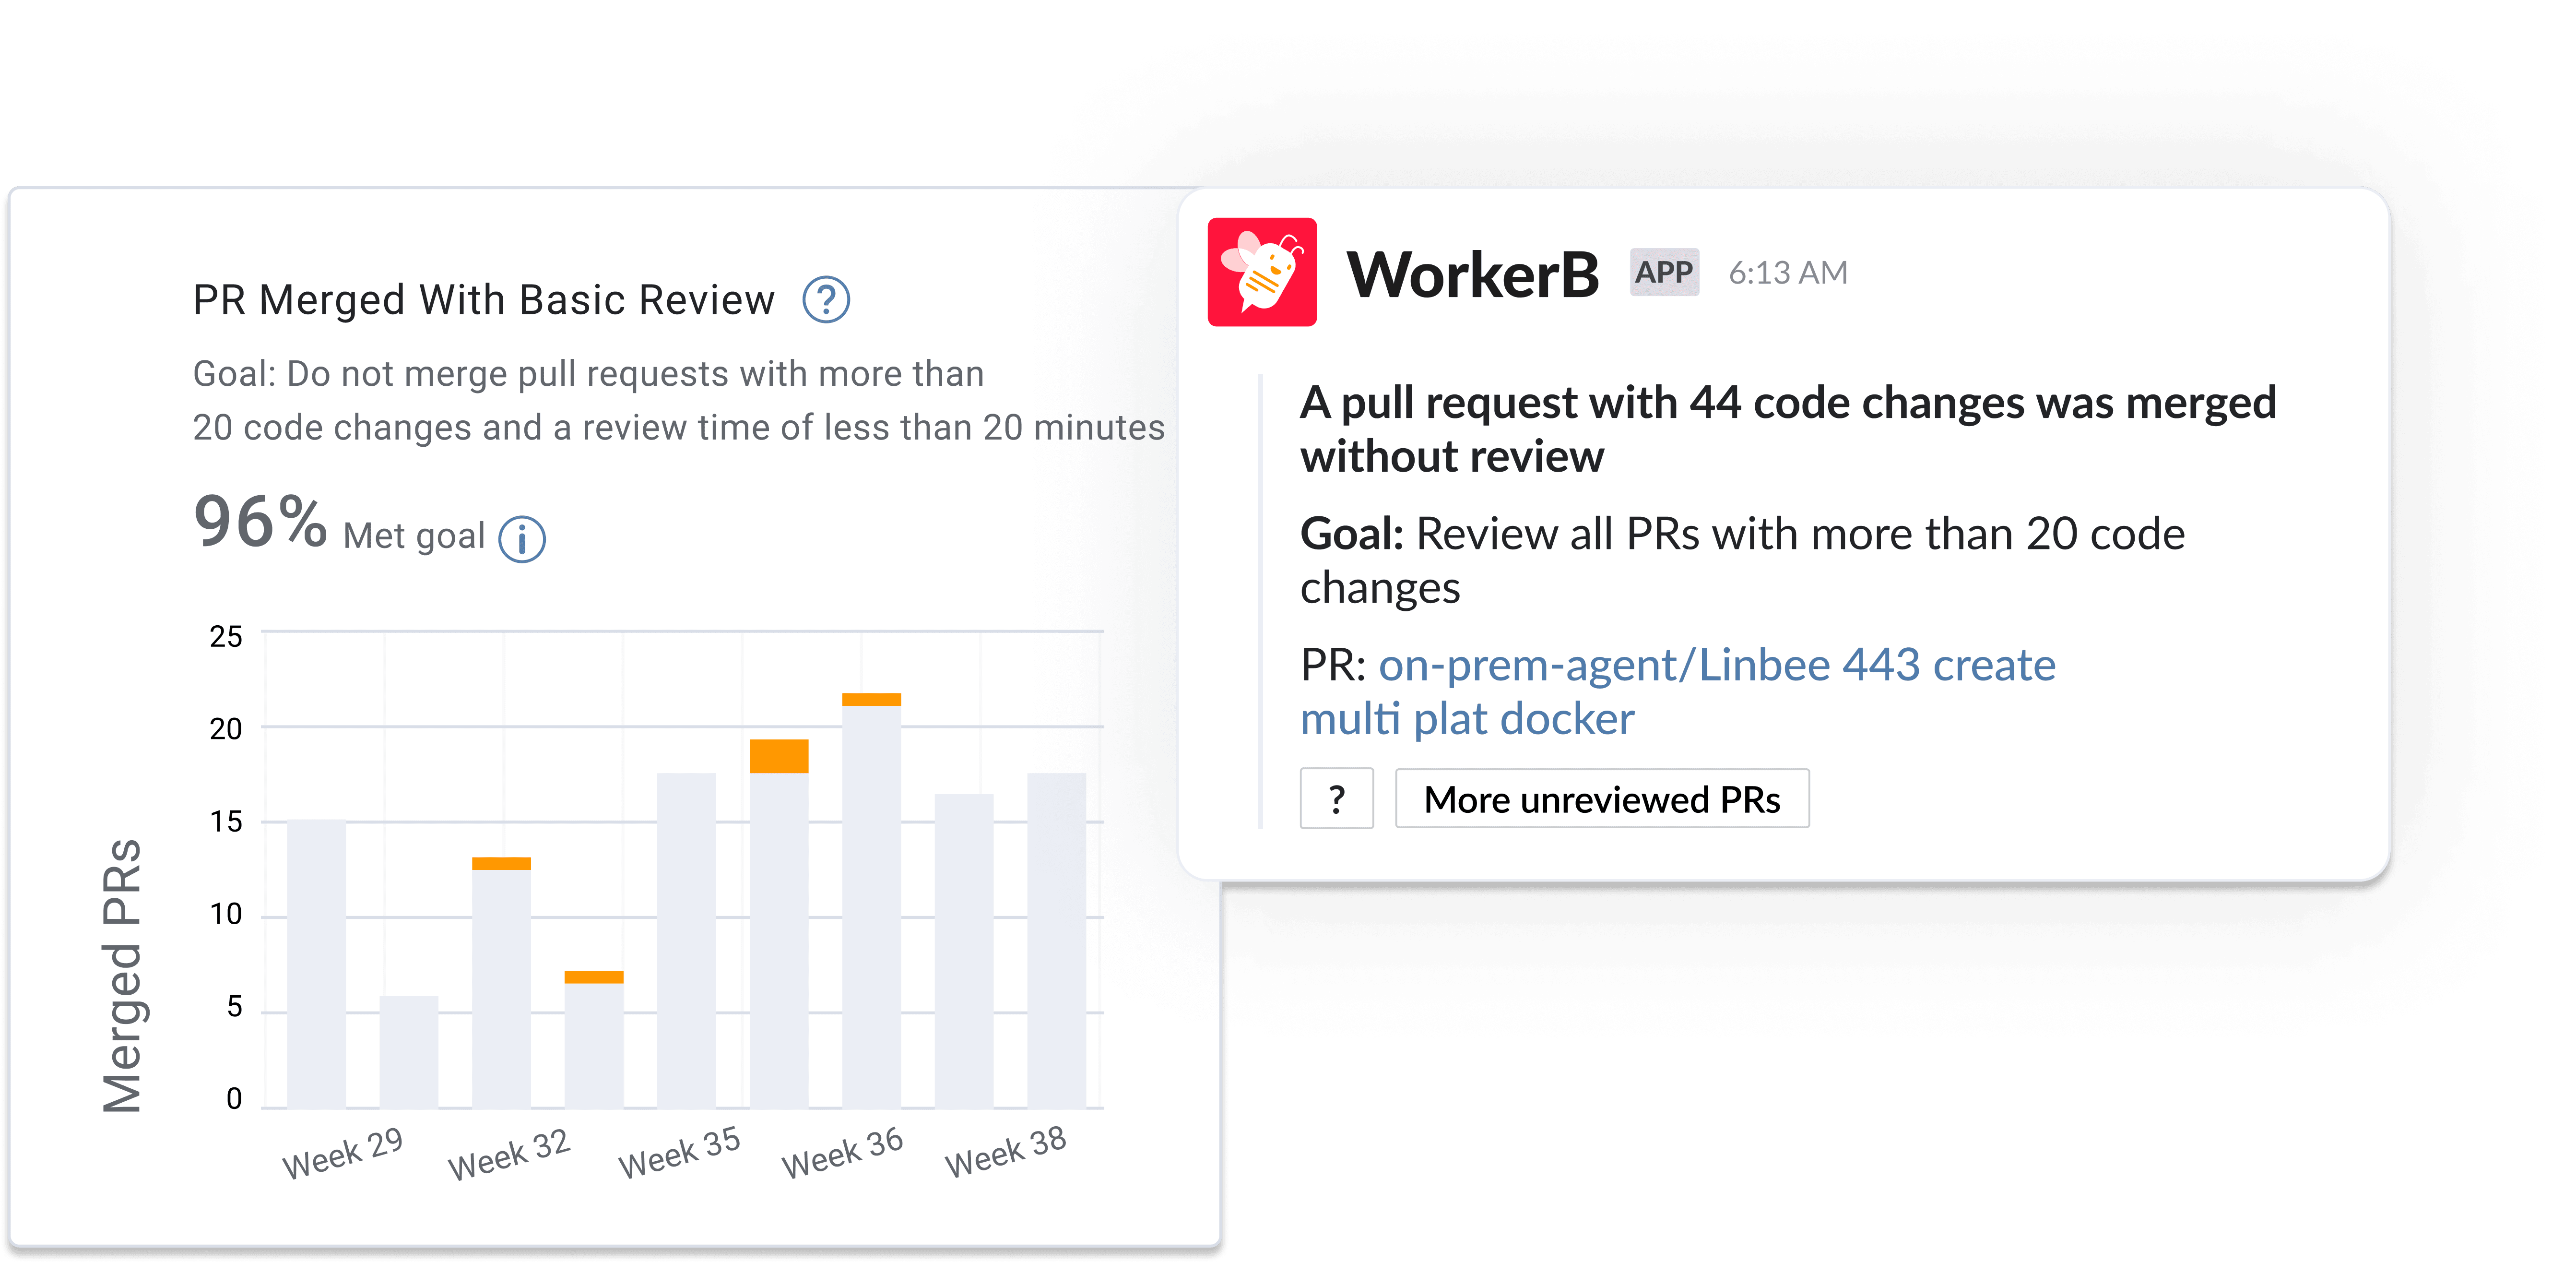
Code reviews are only helpful when each PR gets adequate attention. When developers are overworked, they often limit engagement with non-coding tasks like code reviews. Shallow code reviews indicate potential risk areas for code quality.
Review depth should not be a goal in itself; it should indicate areas to investigate. Changes that affect documentation, test automation, non-production systems, and other low-risk areas often require little to no scrutiny, so review depth is less significant in these situations.
How do you improve review depth?
1. Utilize dashboards to visualize review depth. Find teams, projects, or initiatives with a high rate of PRs merged with little to no review for further investigation.
2. Work with engineering managers to establish working agreements related to code reviews. Create standards for code review metrics in software engineering, such as review depth, pickup time, and review time. Track progress towards achieving PR review goals and notify your team when PRs risk not meeting goals.
3. Optimize merge pathways by automatically distributing code review responsibilities. Ensure you aren’t over-relying on a small number of developers for reviews. Use static analysis, test automation, and other workflow automations to minimize common errors and avoid over-notifying your developers for reviews you can automate.
Rework Rate
Definition: Reworked code is relatively new code that is modified in a PR, and rework rate is the percent of total code that has been reworked over a specified period.
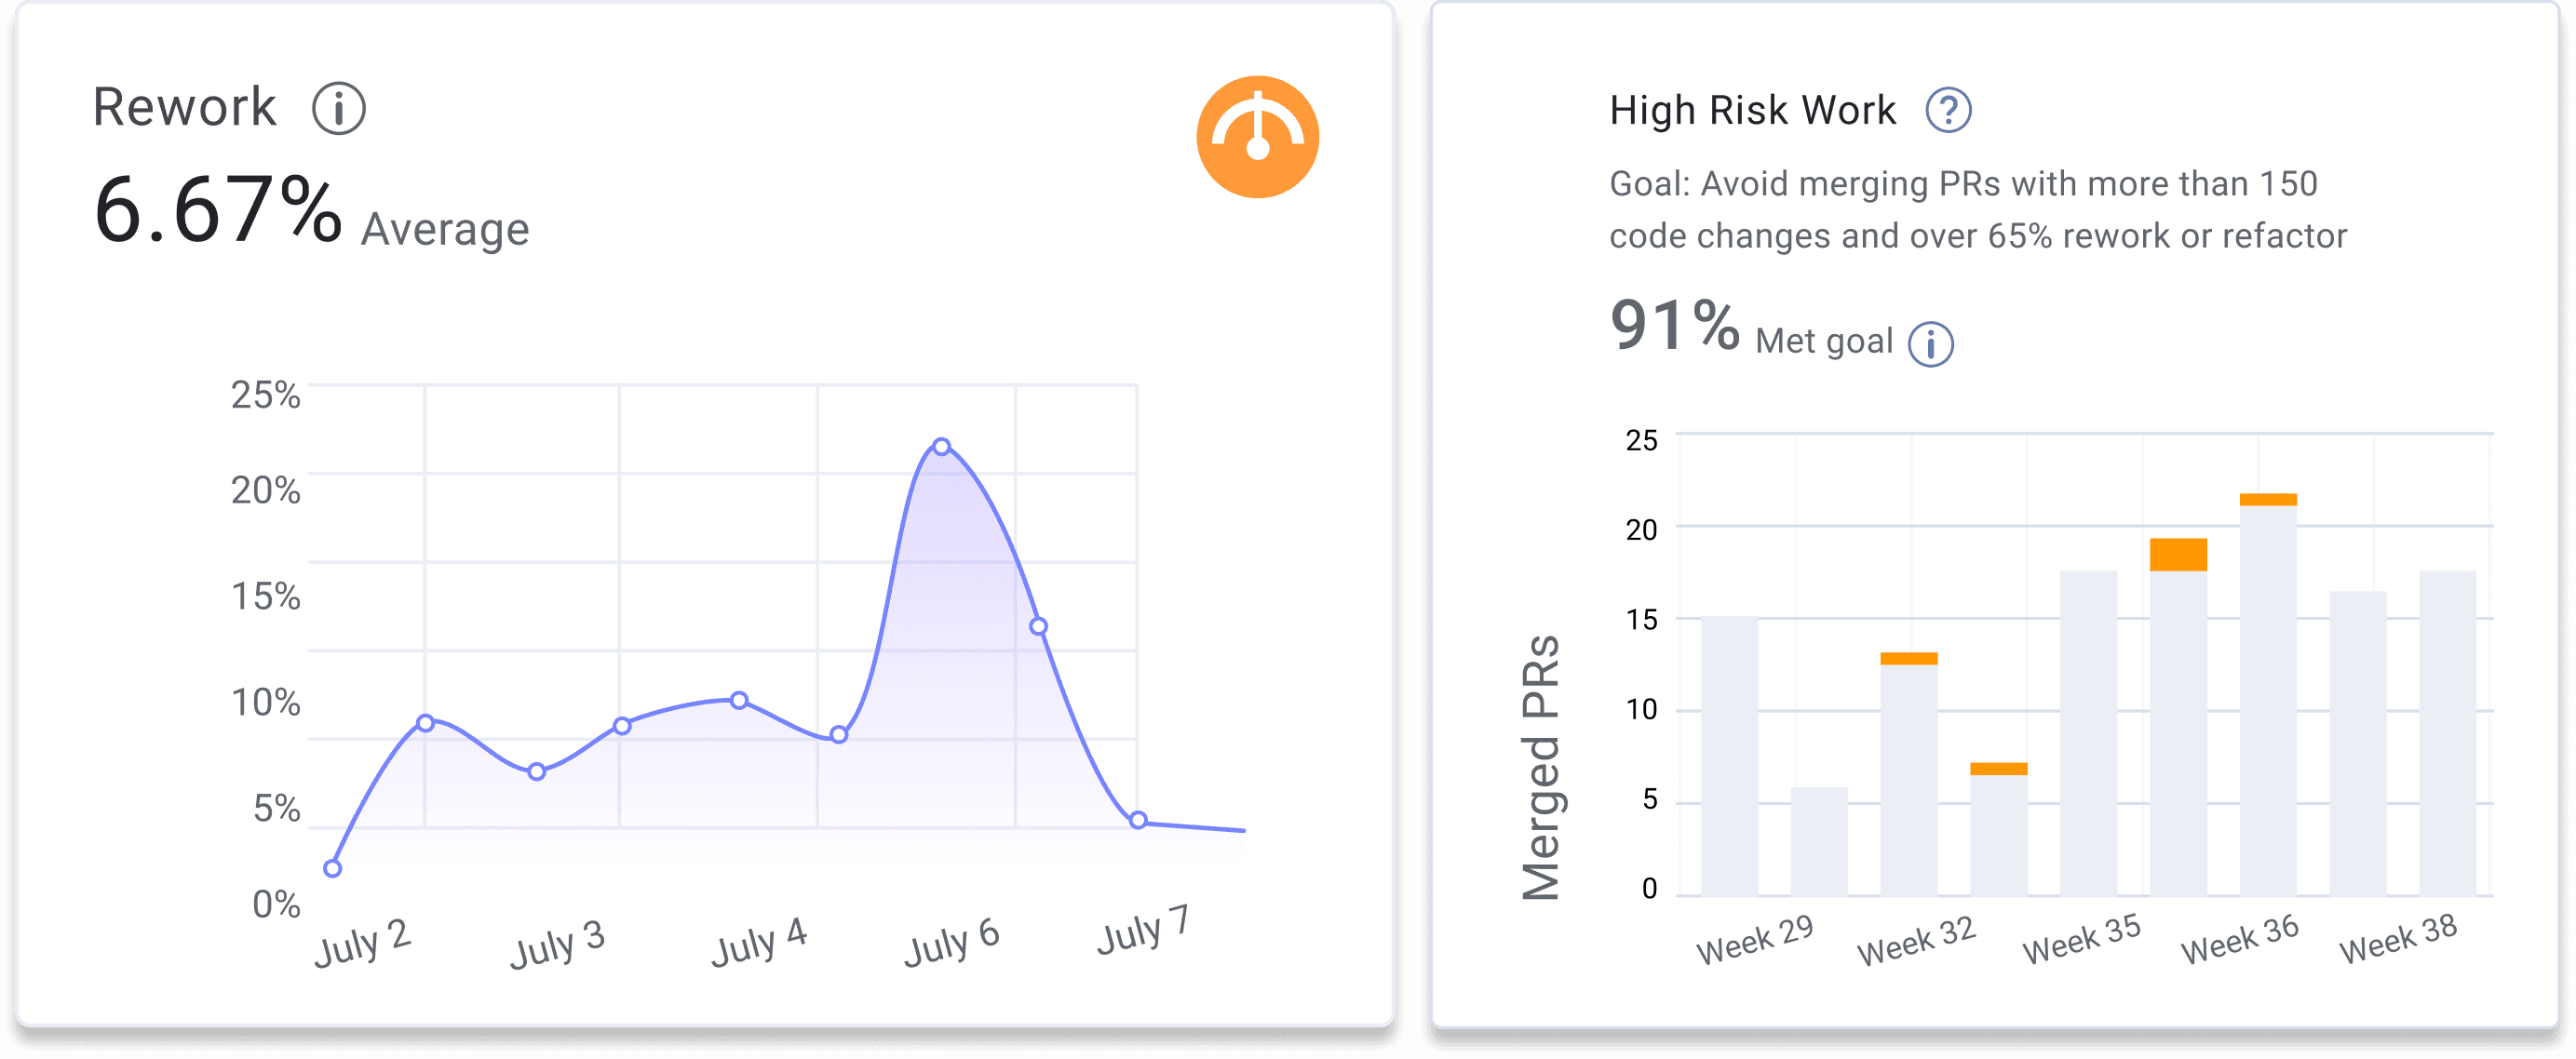
Rework rate is a leading indicator of team frustration. It is often a symptom of a misalignment between product and development. This misalignment can stem from:
- Process failures
- Incomplete requirements
- Skill gaps
- Poor communication
- Excessive tech debt
- Inadequate testing
- Architectural issues
- High code complexity
High rework can also point to code quality issues – frequent code changes increase the risk of introducing new problems. It often correlates with a higher change failure rate and highlights the need for investing in CI/CD to catch errors earlier in the software development lifecycle.
How to Improve Rework Rate:
1. Evaluate your investments in developer experience. Developers face more unexpected challenges due to long-term underinvestments in tooling, platforms, test automation, technical debt, and more.
2. Identify disruptive tasks: Monitor added, unplanned, and incomplete work each sprint. Investigate these tasks to uncover deeper issues like task scoping, code complexity, or knowledge gaps that affect productivity.
3. Investigate PRs with high rework rates to find opportunities to improve development guardrails. Use static analyzer tools, test automation, and code review workflows to help developers identify and resolve common mistakes and reduce the amount of errors introduced into production.
PRs Merged Without Review
Definition: PRs merged without review represent the number of code changes that enter production without peer review.
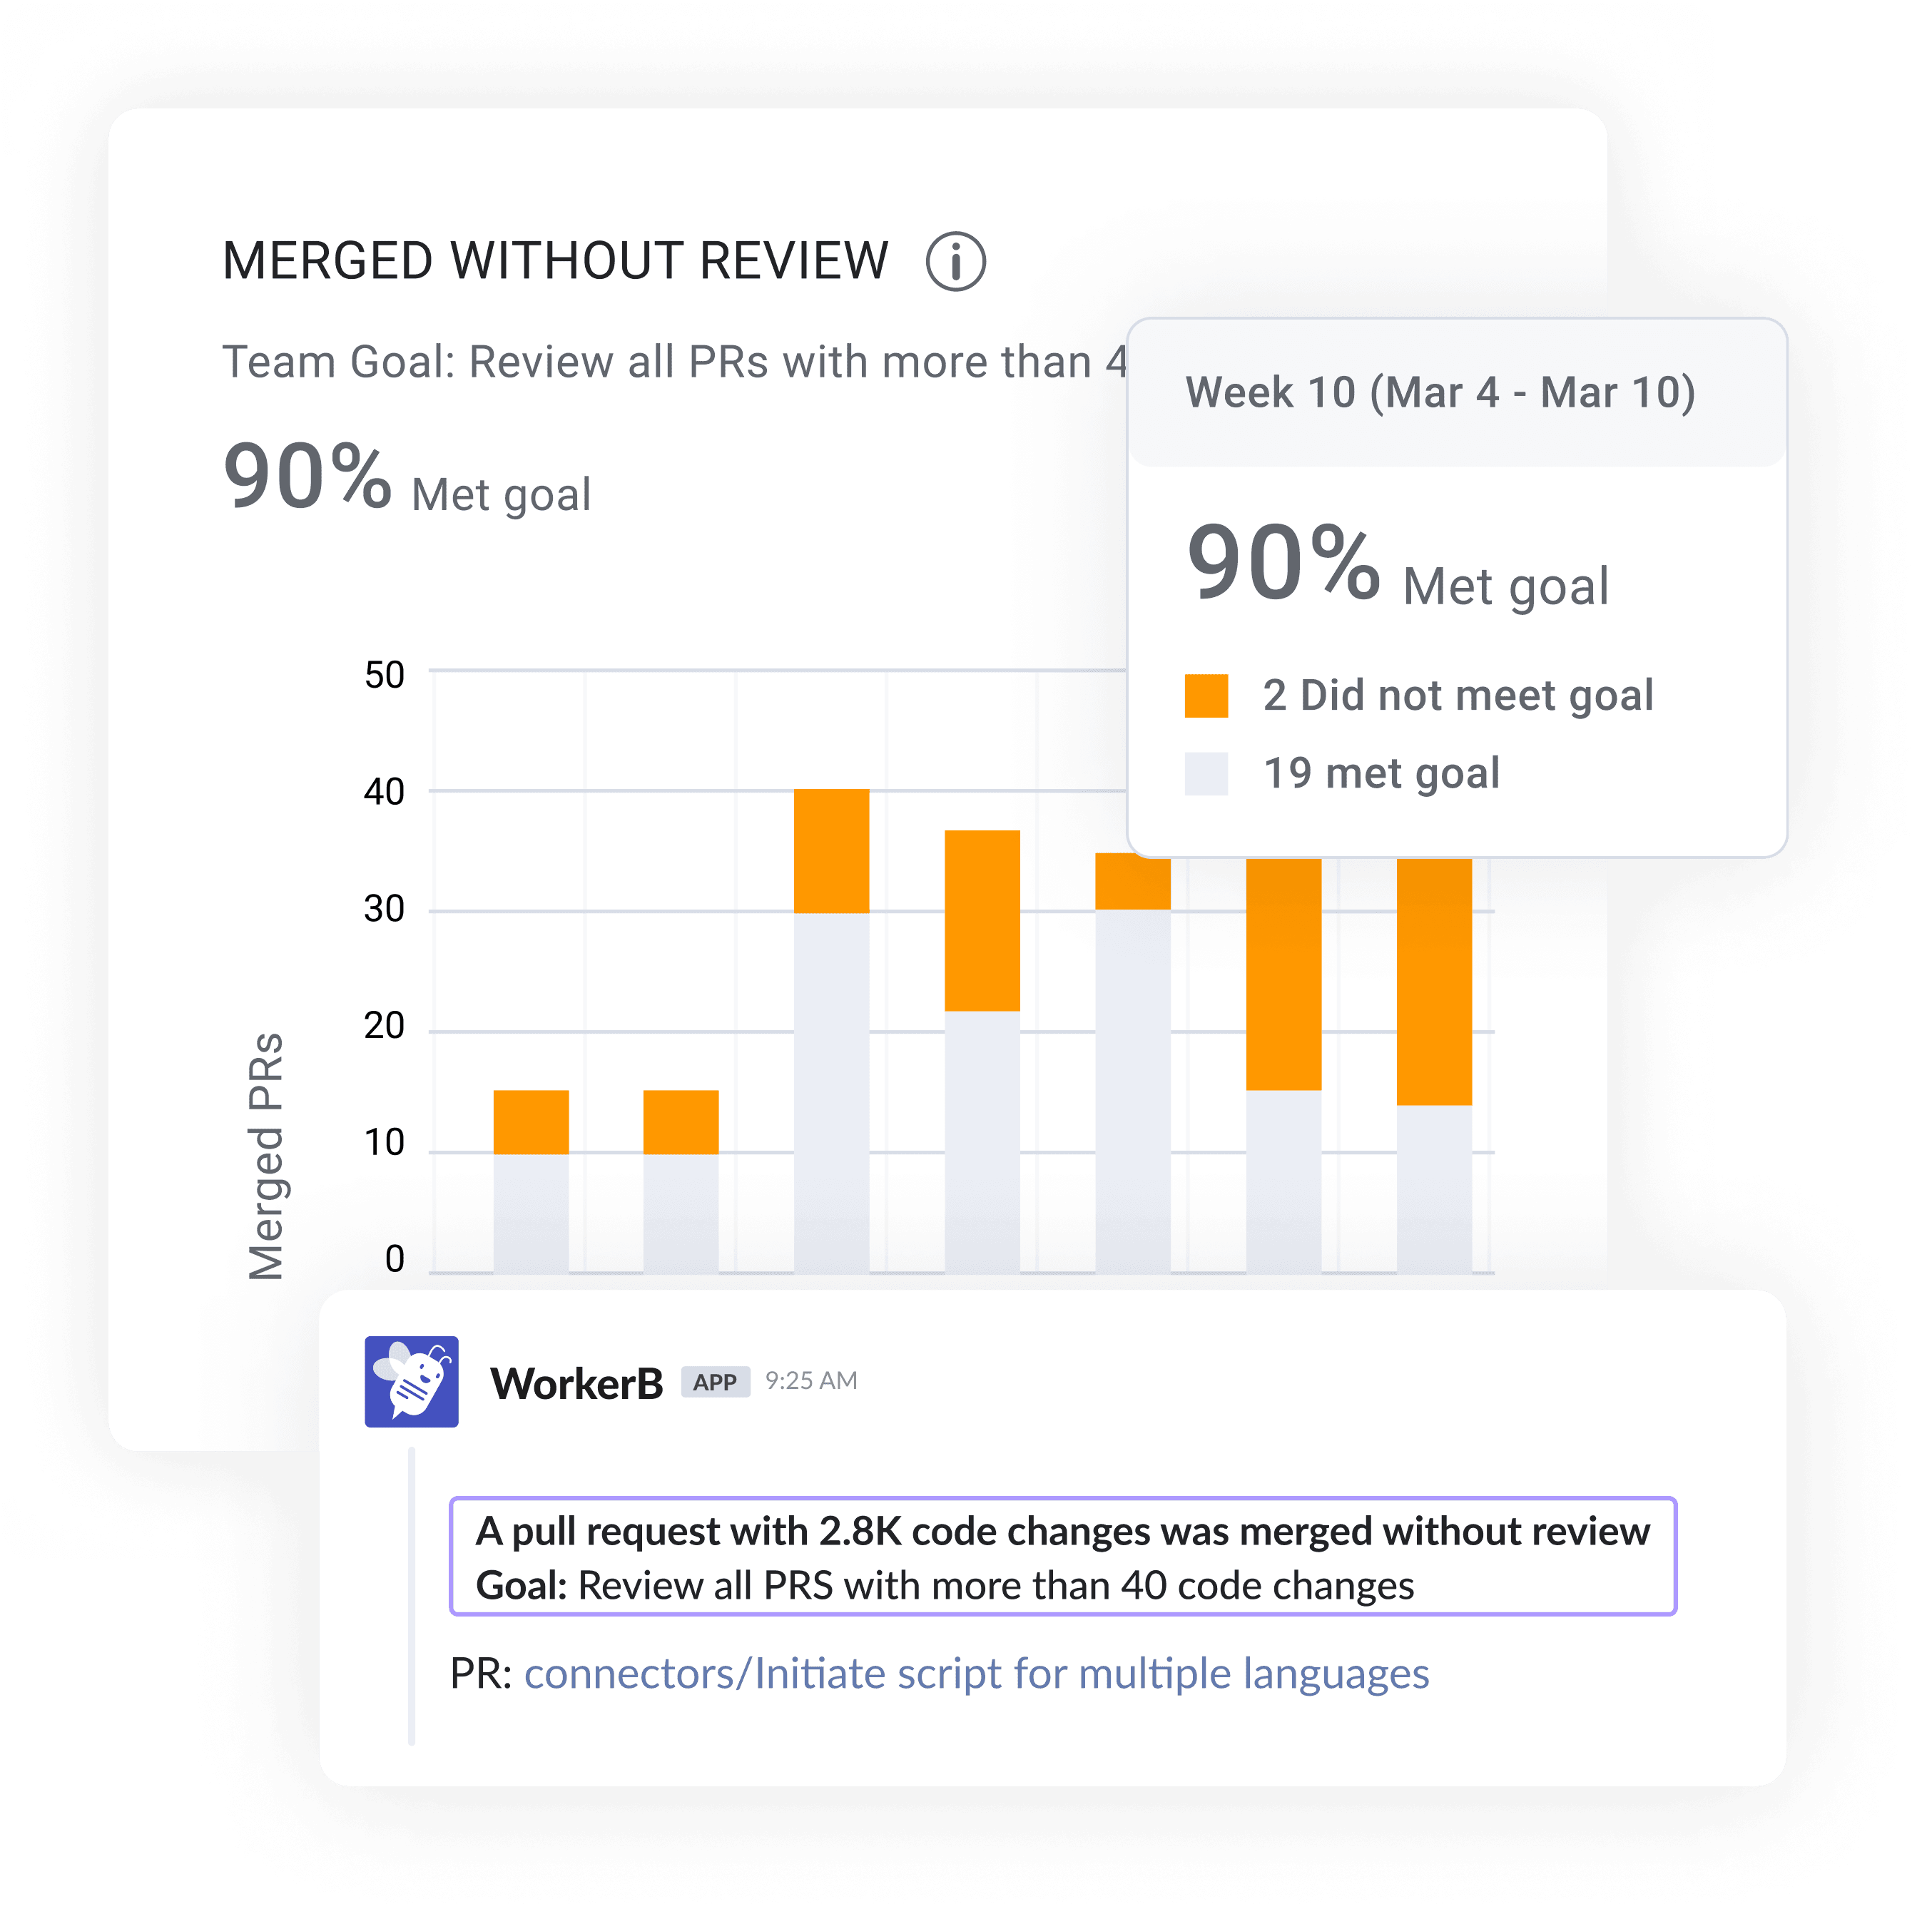
Robust code reviews are crucial for maintaining code quality – even the most skilled developers can overlook errors. Without formal review policies, you significantly increase the risk of bugs and other issues making it into production. A high number of pull requests without review often correlates with a higher change failure rate.
Recommendation: Improve your PRs merged without review by setting team working agreements related to the PR process and establishing standards for code review metrics.
How Org Size Affects Leading Indicators
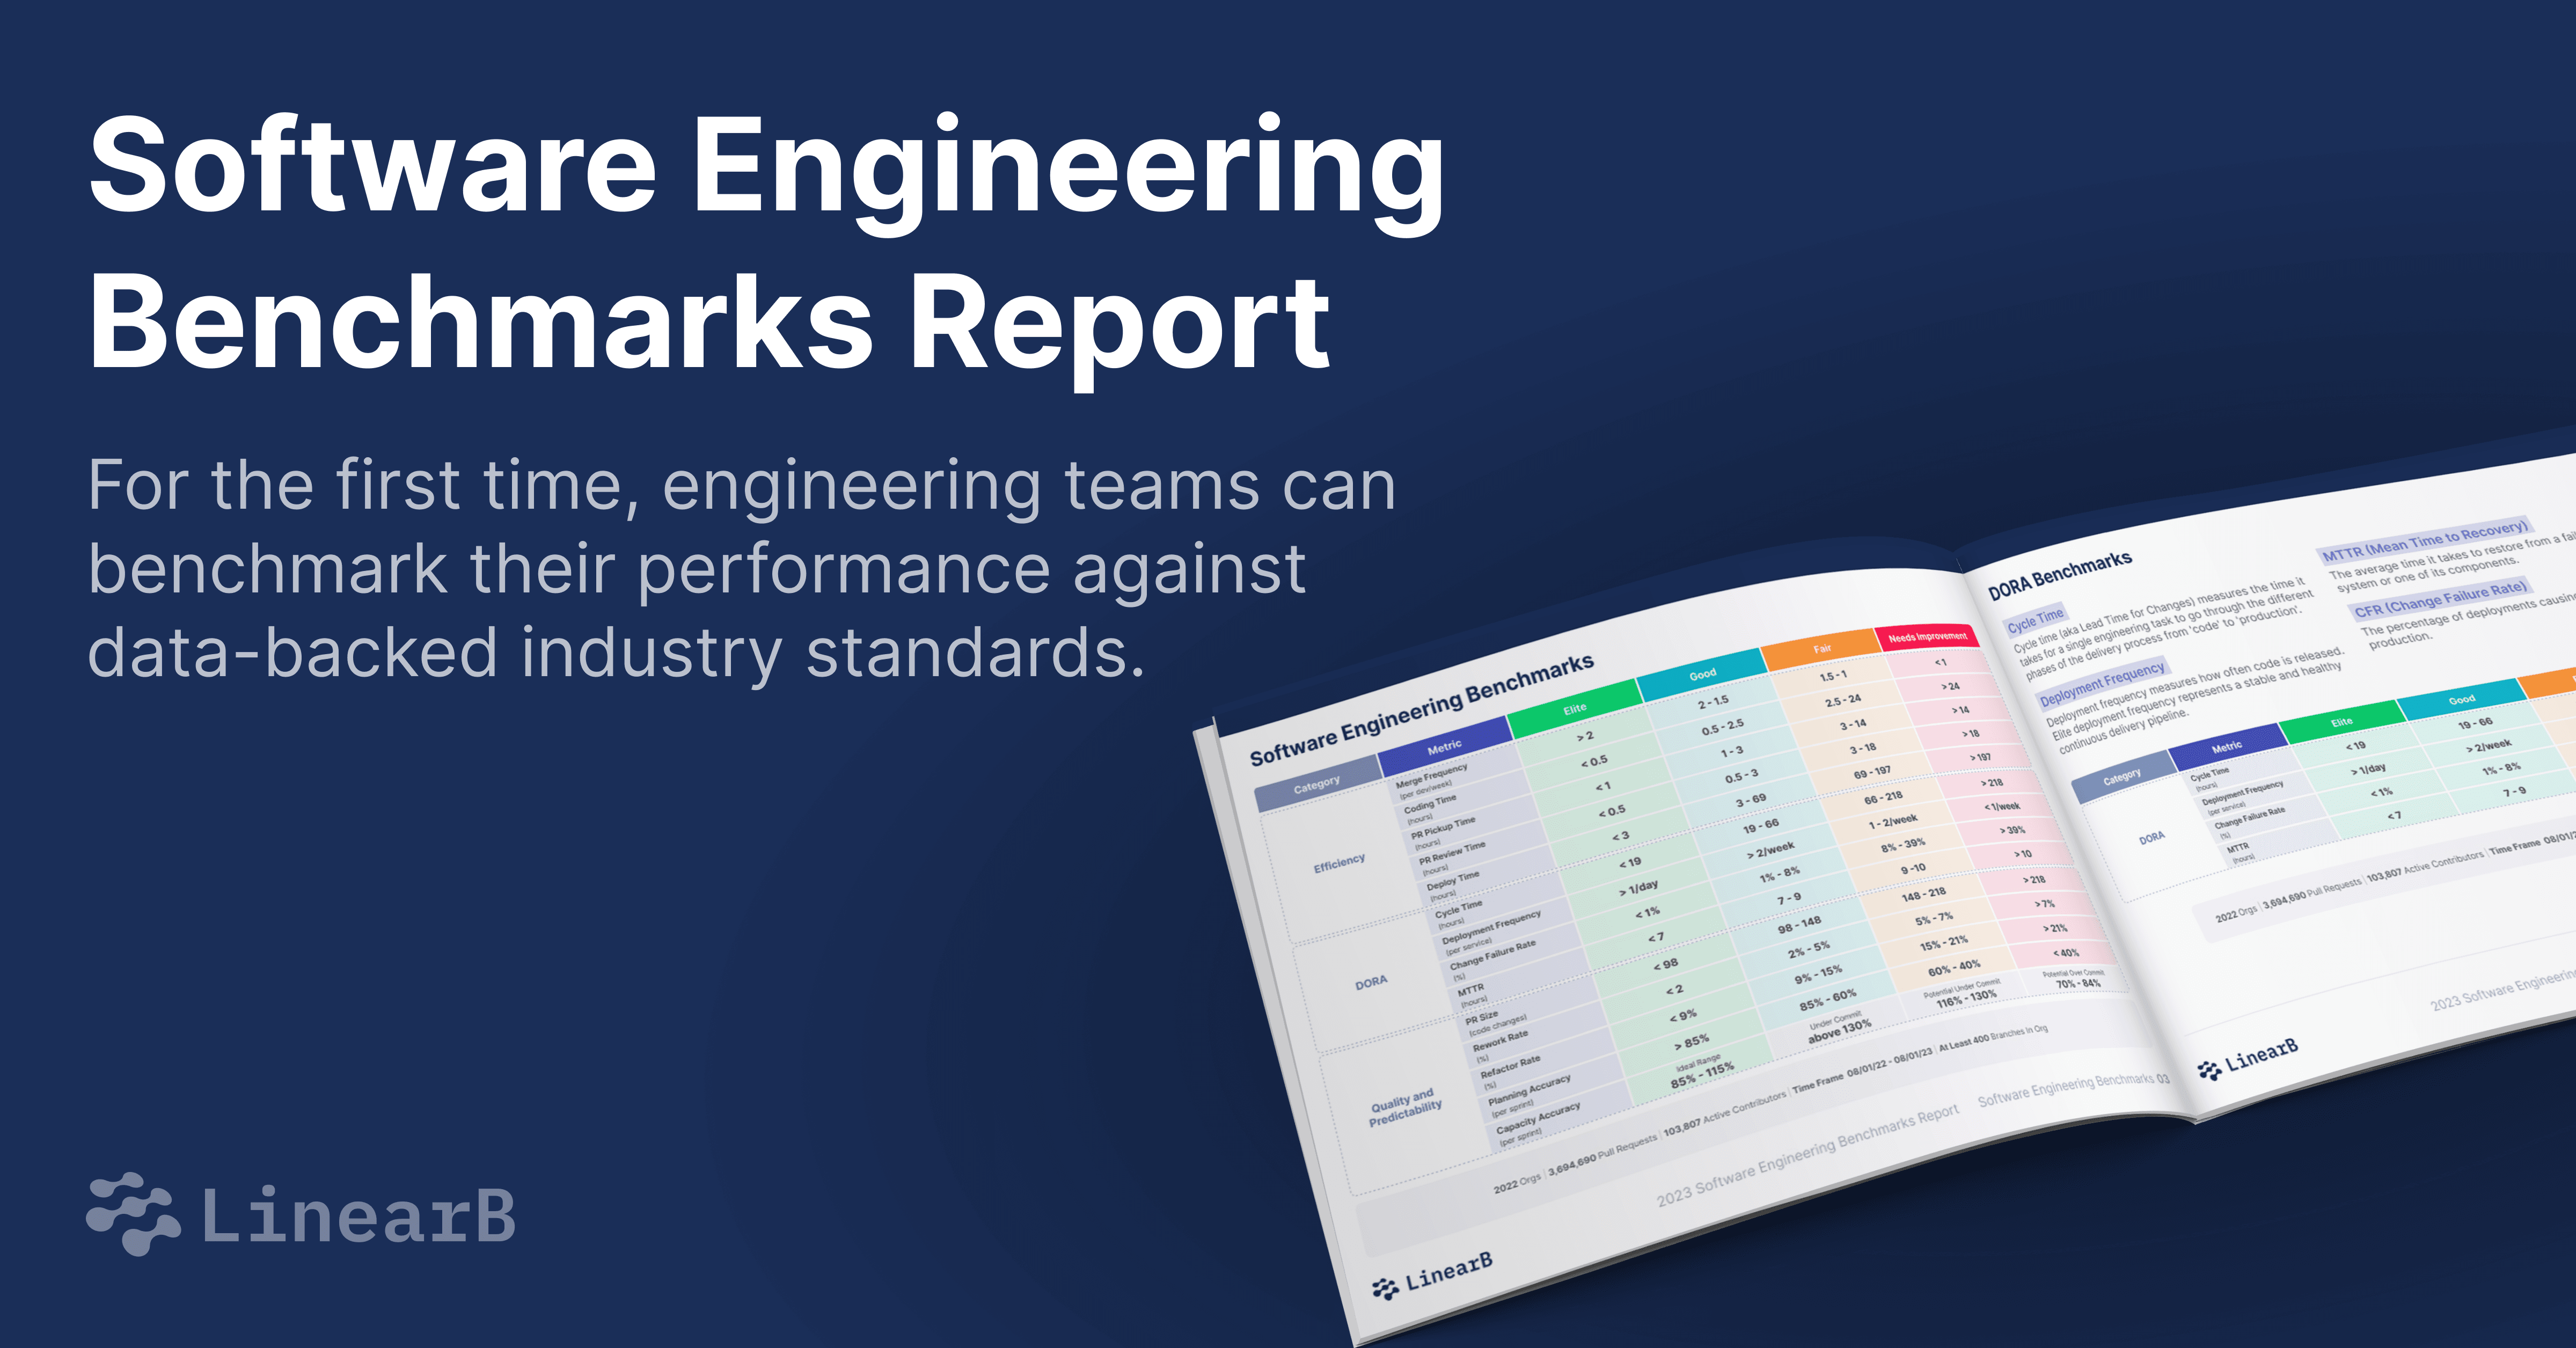
To gain context around your team's leading indicators, you need to benchmark your performance against industry standards. Benchmarking by org size, region, and industry offers insights into your performance against similar teams. This provides an added layer of reassurance that your improvement goals are realistic and lets you advocate for resources when necessary. To gather this benchmarking data, we conducted a study of 2,000+ teams, 100k+ contributors, and 3.7 million PRs. In our Software Engineering Benchmarks Report, you'll find all metrics segmented by organization size, geography, and industry.
When optimizing metrics in software engineering, different-sized organizations face unique challenges and opportunities. Understanding these differences is key to tailoring improvement strategies.
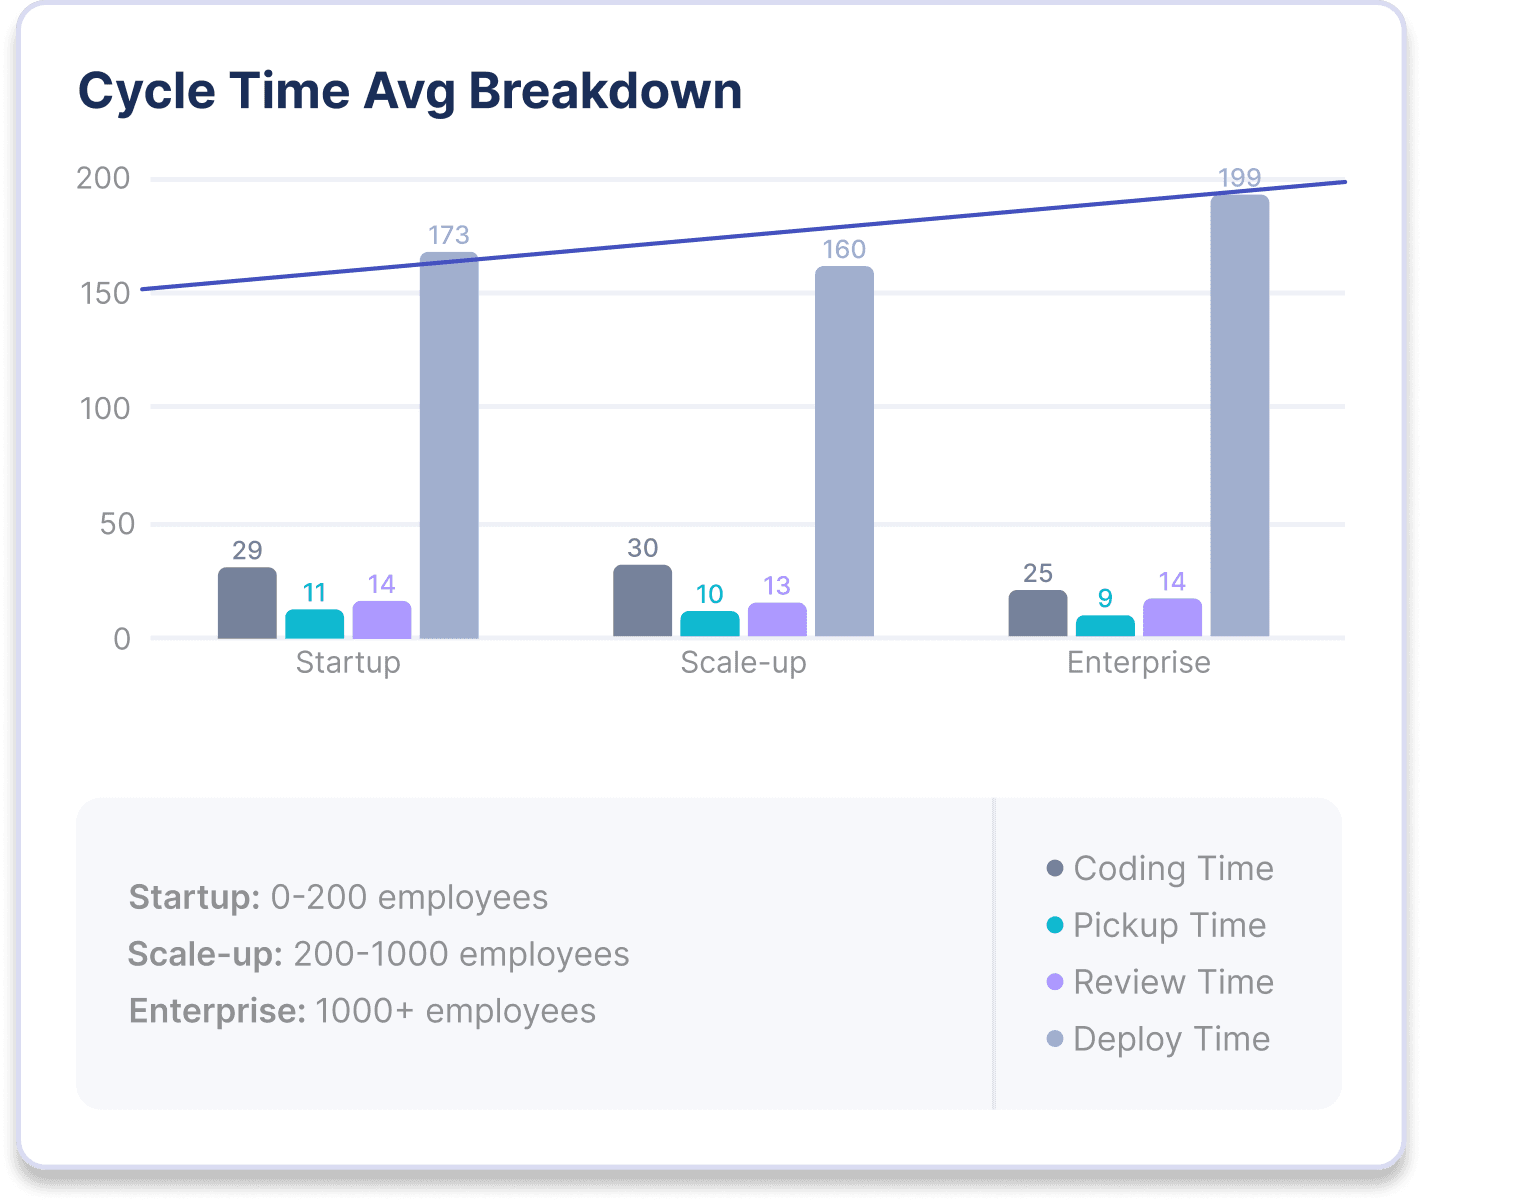
Efficiency Metrics by Org Size
- Startups: Startups excel in efficiency metrics such as high merge frequency and short coding time. Their lean operations and smaller teams facilitate rapid iteration and deployment.
- Scale-Ups: These organizations maintain competitive efficiency by investing in process optimizations and resource allocation. They benefit from a balance between speed and structure.
- Enterprises: Due to their size and complexity, enterprises may face efficiency challenges. However, they can improve by implementing workflow automation and reducing bureaucratic delays.
Code Quality Metrics by Org Size
- Startups: Although startups prioritize speed and innovation, they must carefully manage technical debt to maintain quality. Regular refactoring and code reviews are important to drive sustainability.
- Scale-Ups: Scale-ups focus on refining processes to improve predictability and quality as they grow. Implementing standardized review practices helps maintain consistency.
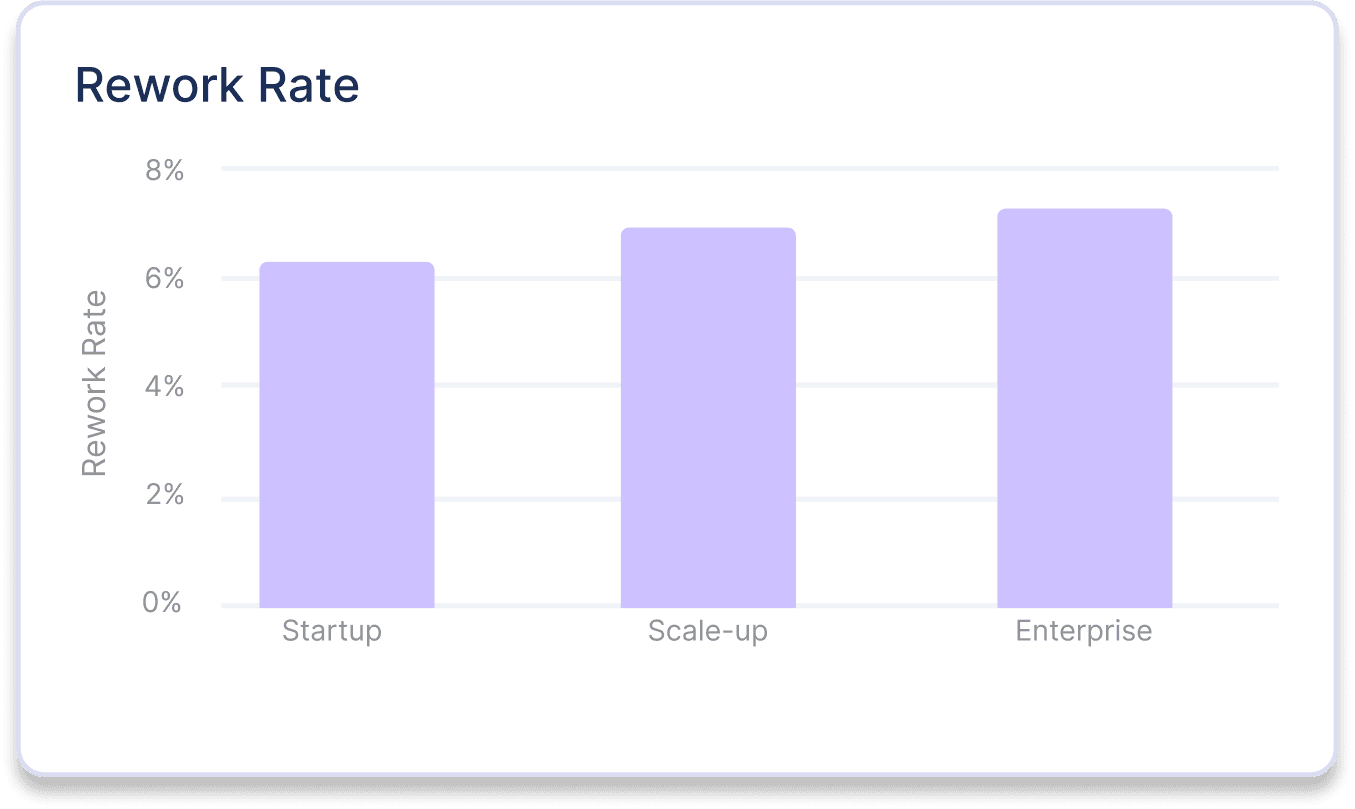
- Enterprises: Enterprises often struggle with cross-team collaboration and rework rates. Enhancing communication and visibility across teams can improve quality and reduce redundant work.
Working Hours and Merge Frequency by Org Size
There is a correlation between working hours, merge frequency, and organizational size, with startups often exhibiting longer workdays and higher merge frequencies.
- Startups: Work longer hours, driven by the urgency of achieving critical goals and resource constraints, resulting in higher merge frequencies.
- Scale-Ups and Enterprises: Tend to have more structured work schedules, which can impact merge frequency but also support sustainable growth and employee well-being.
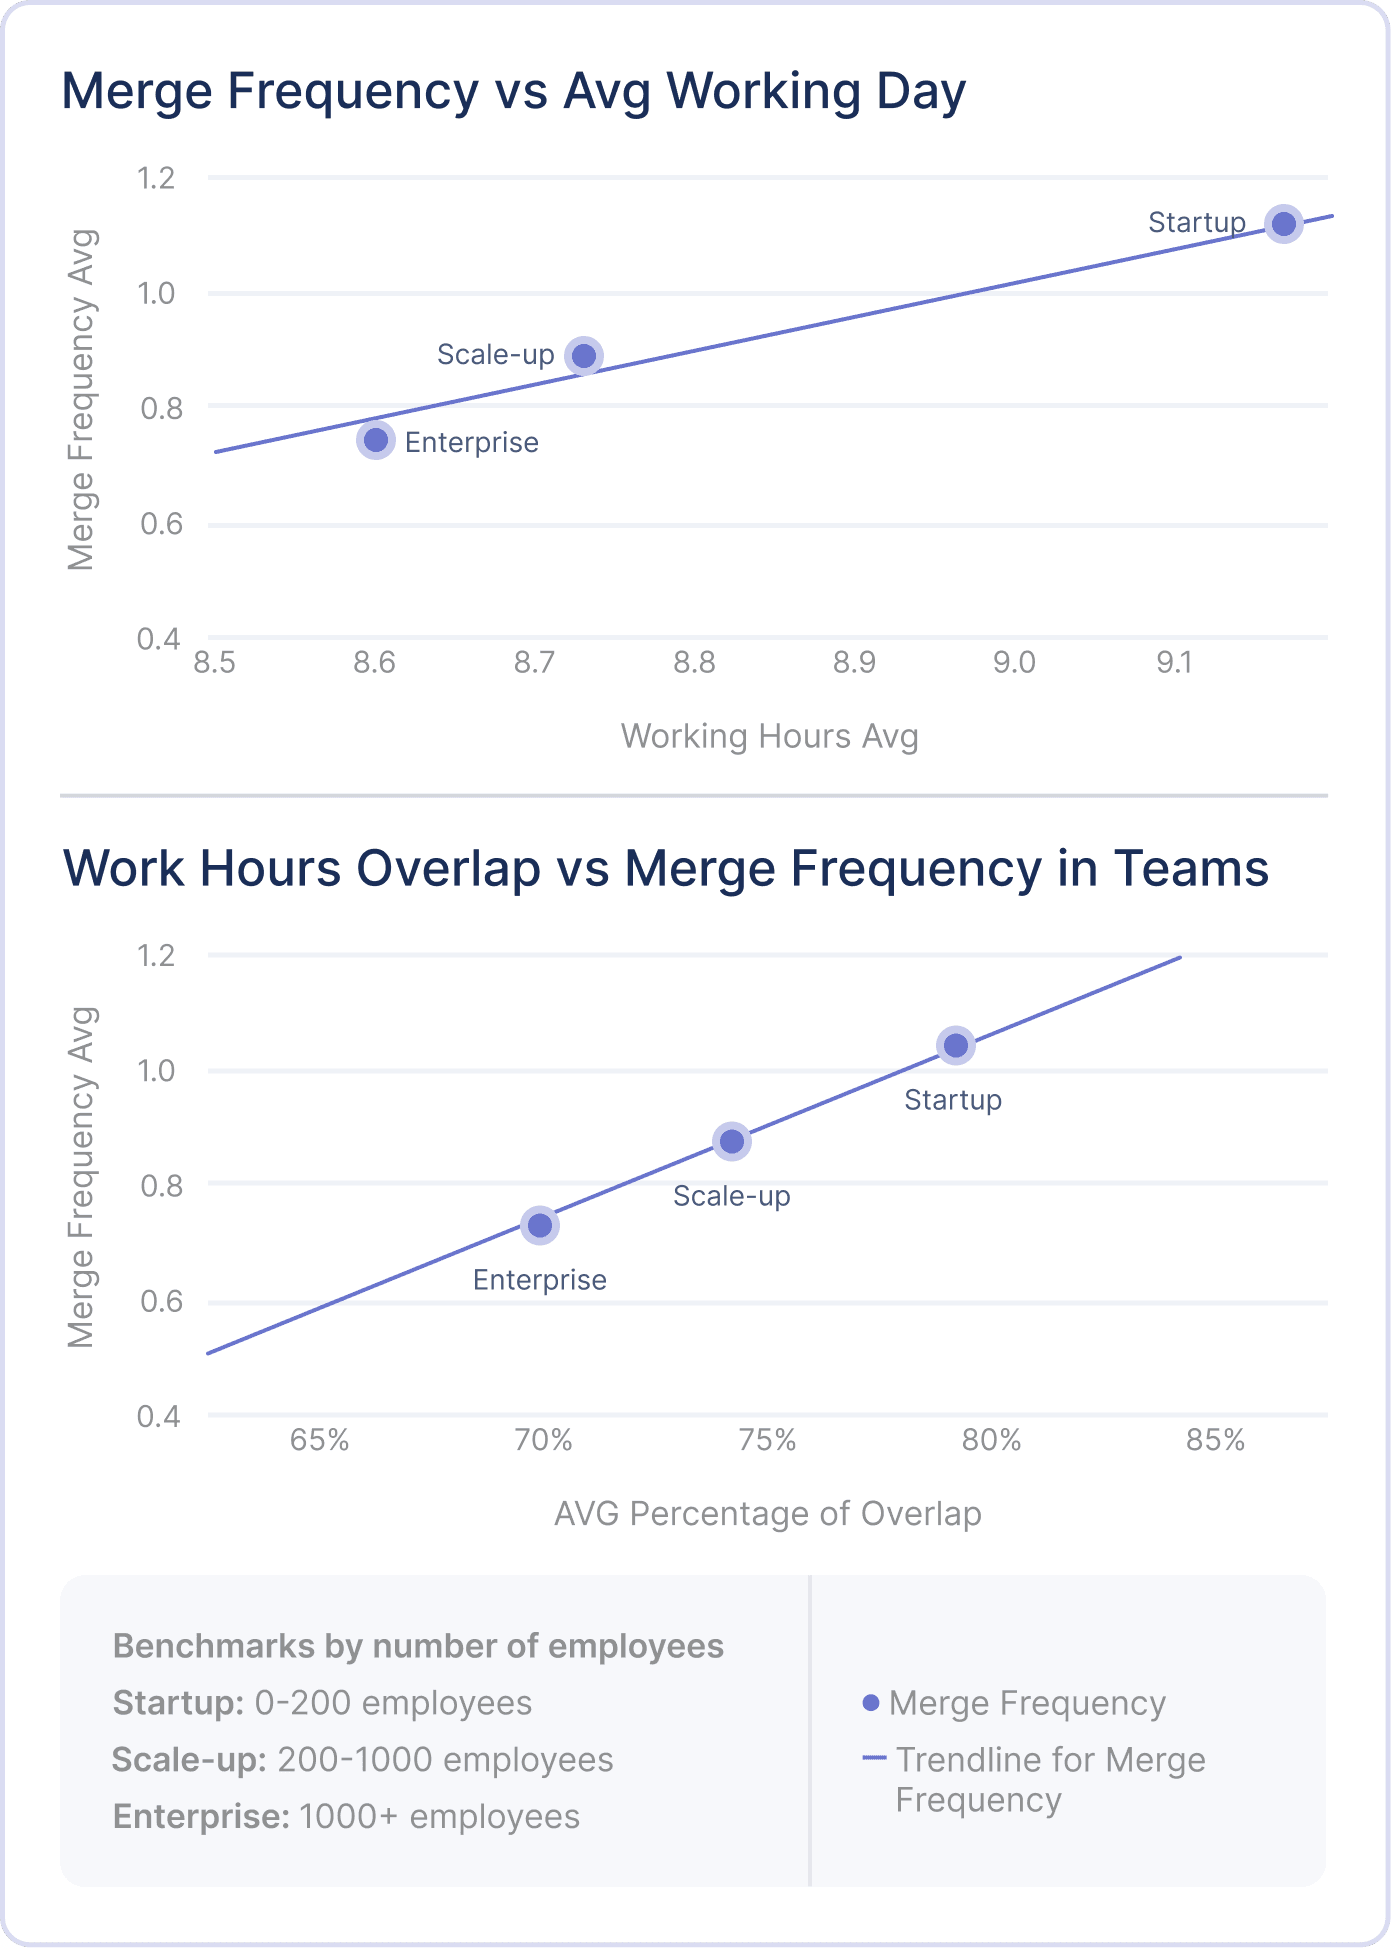
Key Takeaway: Real-time collaboration and overlapping work hours enhance merge frequency by facilitating effective communication and quick feedback loops.
Leveraging Metrics in Software Engineering
Leveraging leading indicators in software engineering is essential for improving engineering team performance and enhancing your software delivery lifecycle. By understanding and optimizing metrics such as PR size, pickup and review time, and rework rate, engineering teams can boost developer productivity and maintain high code quality.
Additionally, benchmarking against industry standards allows teams to set realistic improvement goals and secure necessary resources. Tailoring strategies to fit organizational size ensures that startups, scale-ups, and enterprises can all optimize their metrics effectively, balancing speed, code quality, and sustainability.
Want to learn more about Software Engineering Metrics Benchmarks? Download the full report here.
