Software engineering metrics are useful tools for evaluating engineering team performance and identifying areas for improvement. Implementing a software engineering metrics program can help you make informed decisions about engineering efficiency and code quality.
Qualitative and quantitative metrics in software engineering are essential to improving operational efficiency and aligning resources to company goals, but you can’t set realistic targets if you don’t have a baseline for what “good” means for your team.
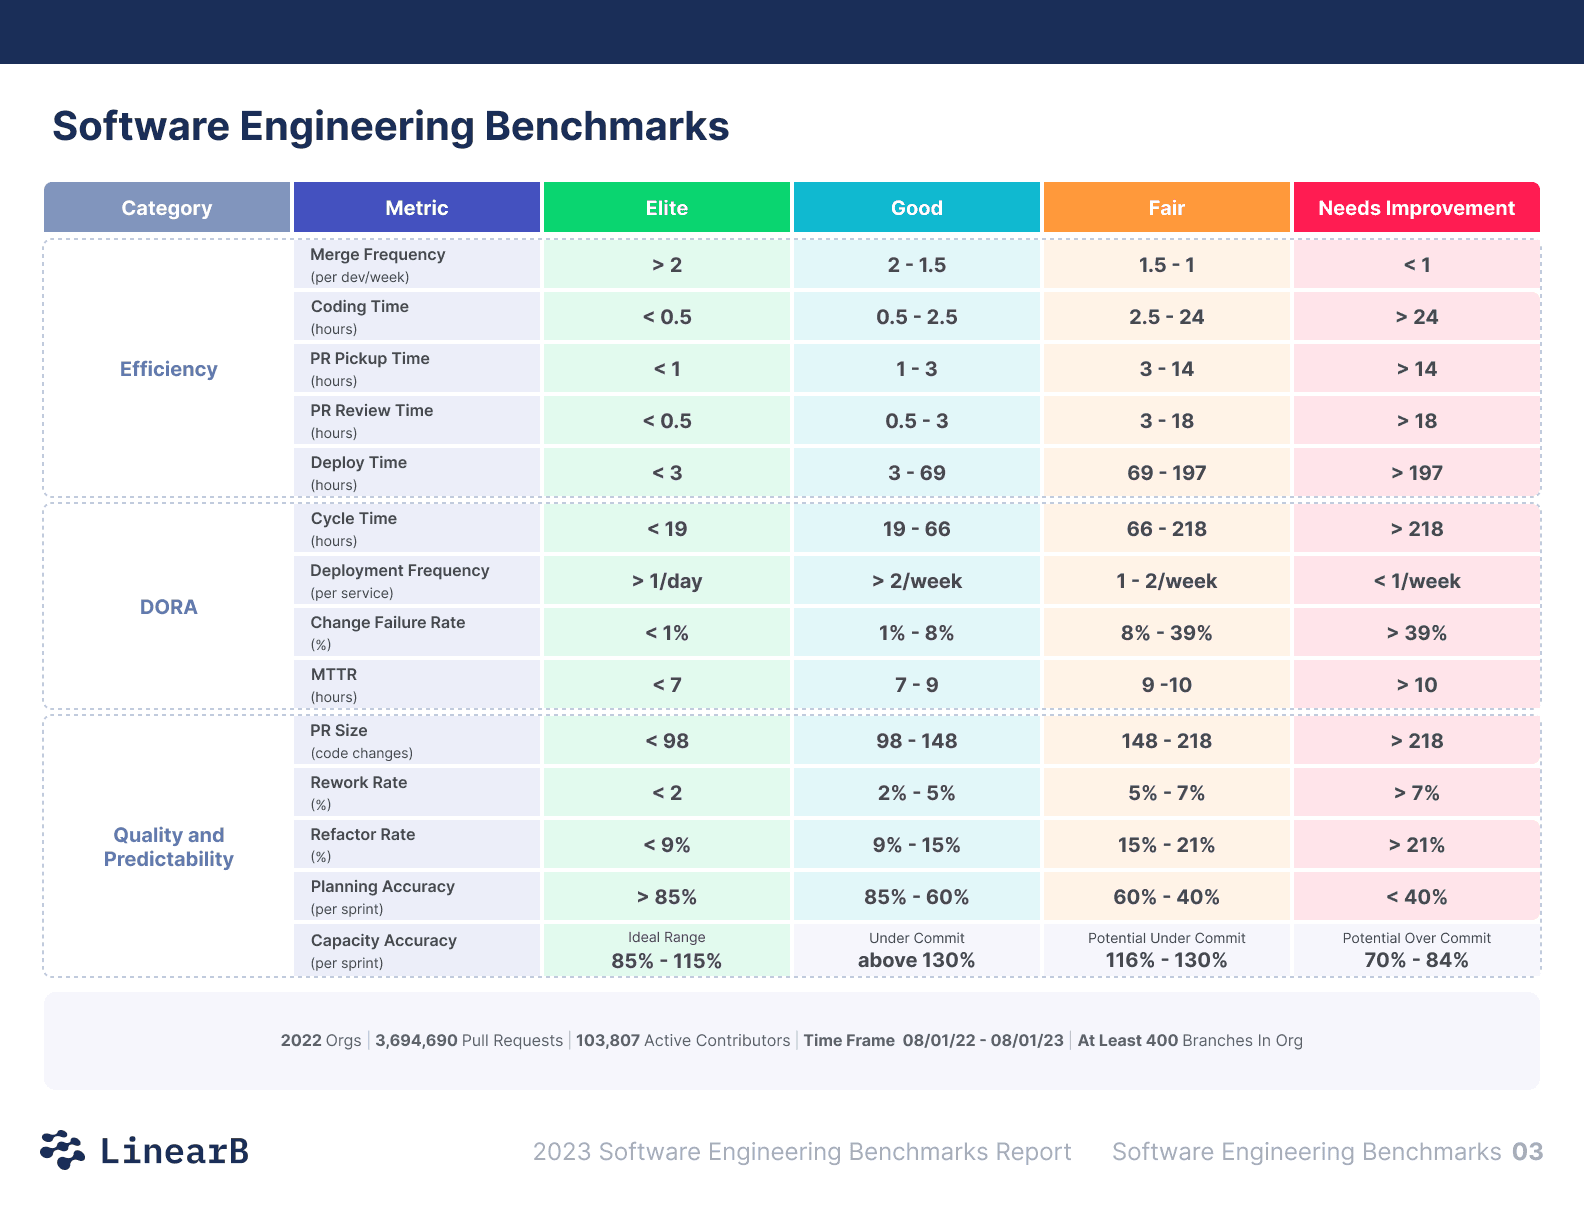
Software engineering metrics benchmarks provide a standardized and objective way to evaluate performance. By measuring high-impact metrics against industry peers, you can identify your team’s strengths, weaknesses, and workflow bottlenecks.
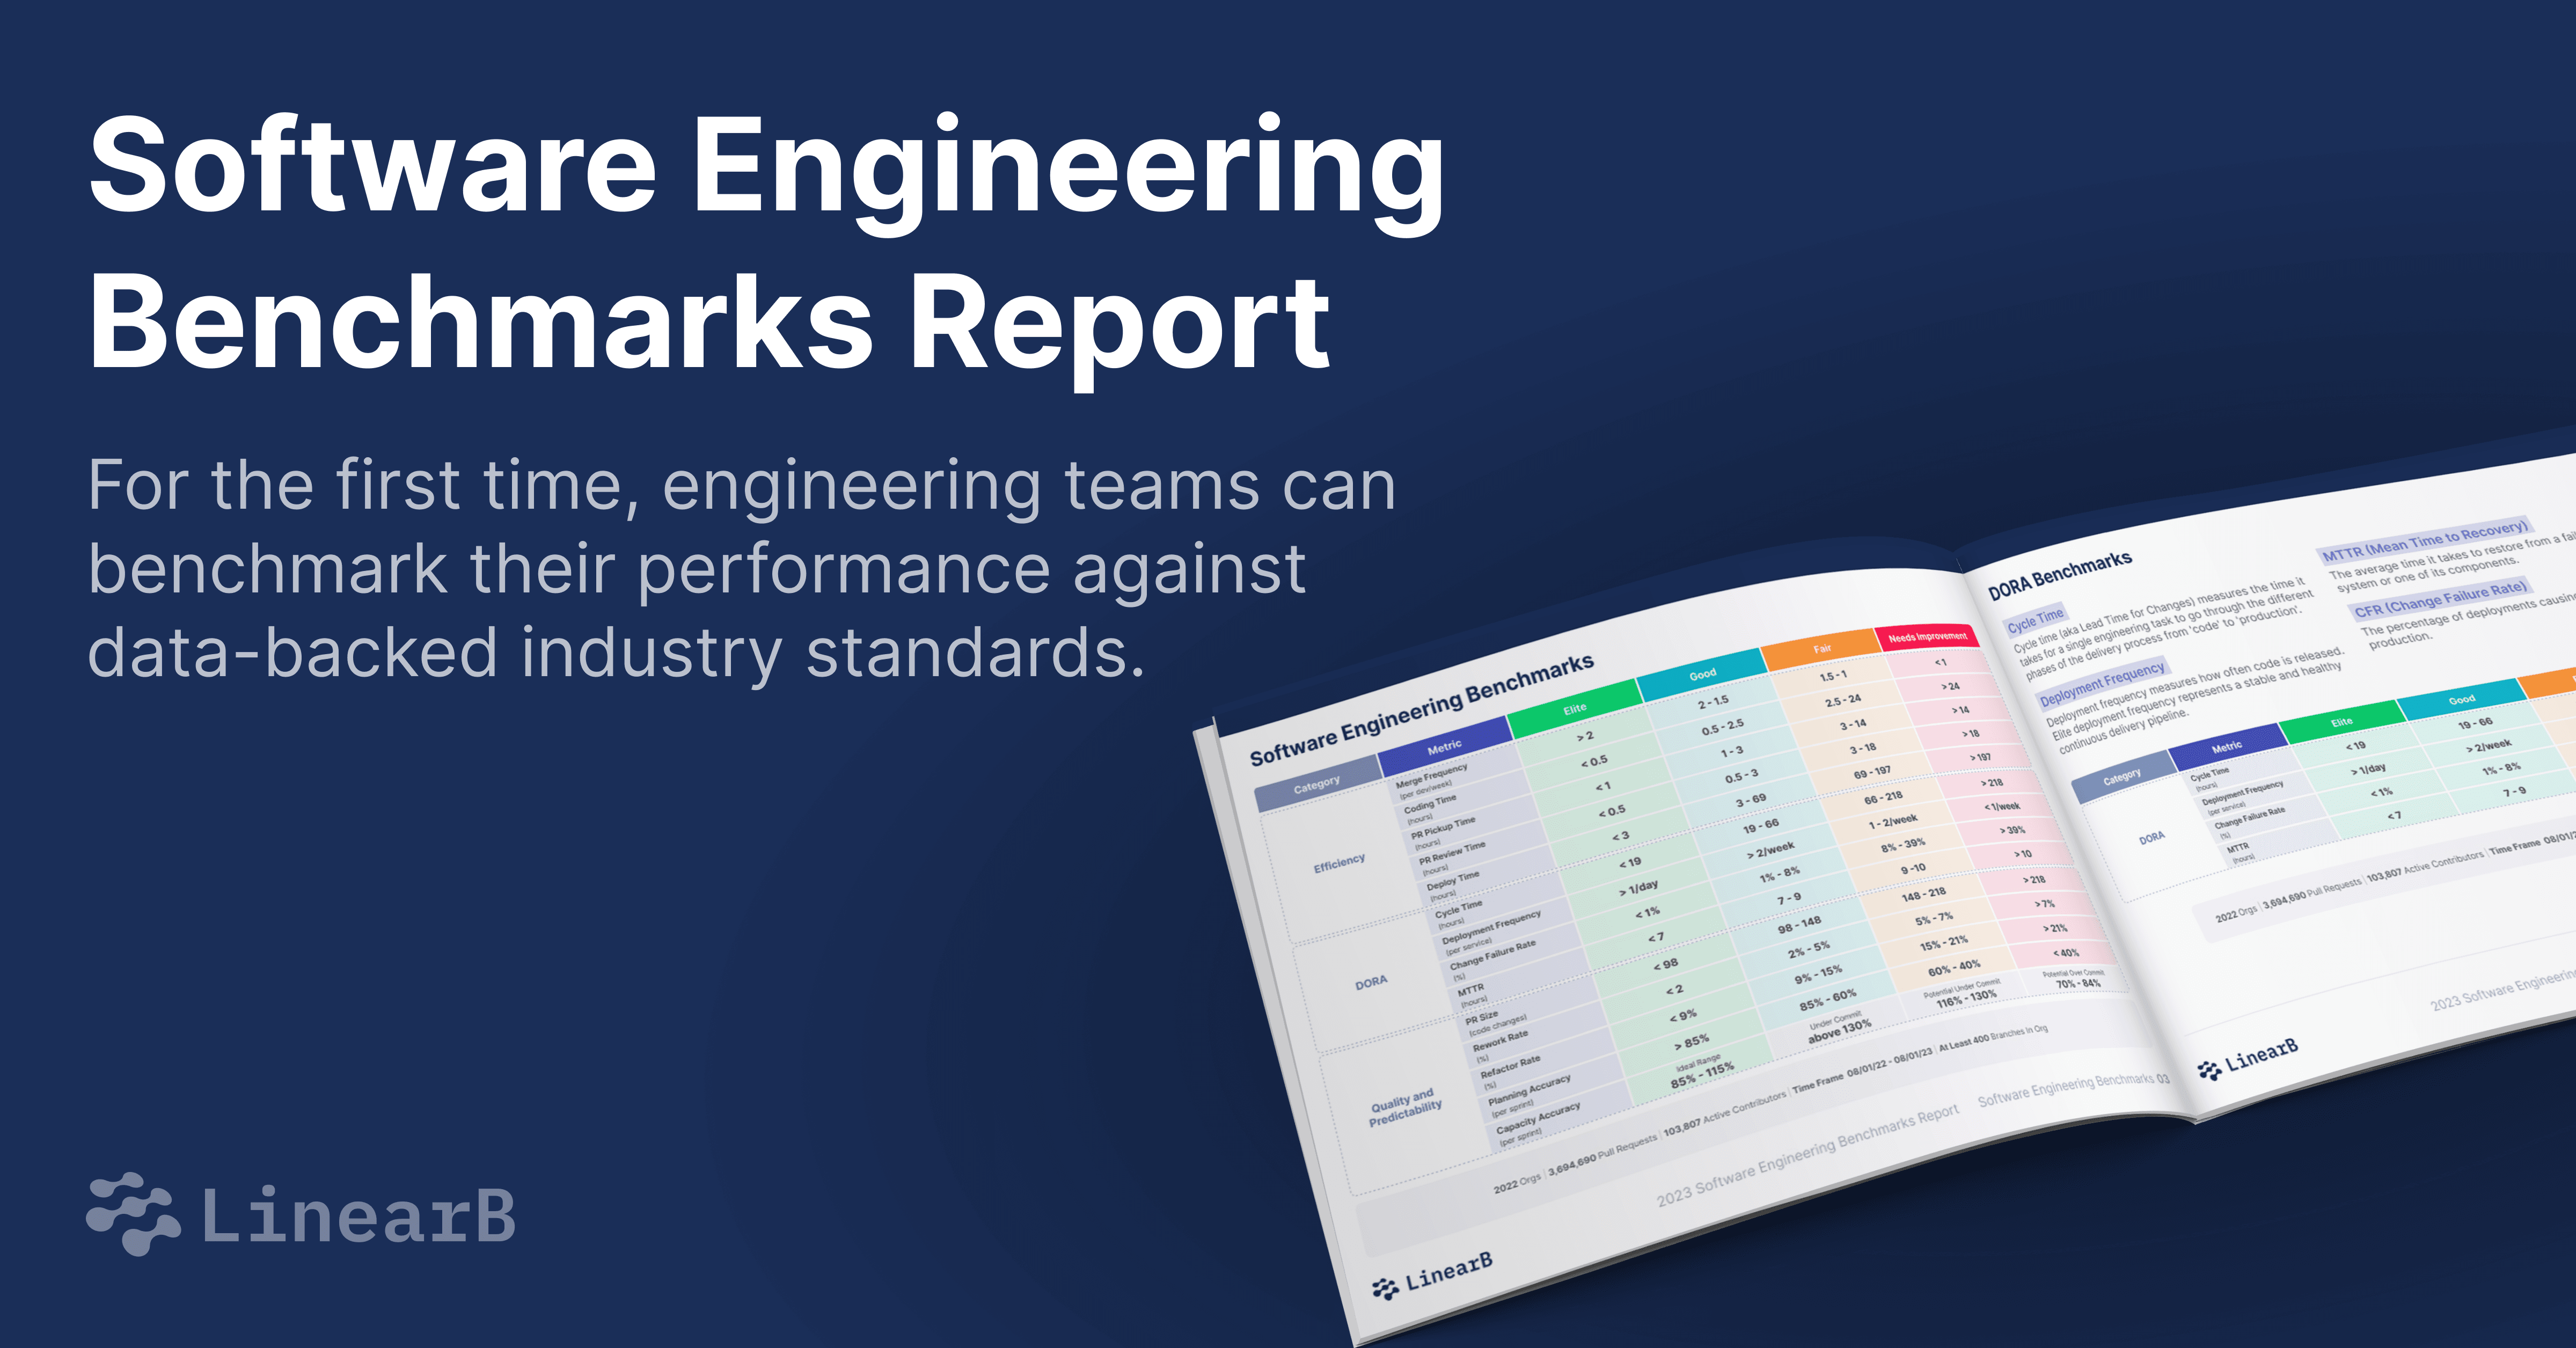
These are the reasons LinearB built the Software Engineering Benchmarks Report. LinearB data scientists compiled data from more than 2,000 teams, 100k contributors, and 3.7 million PRs. This blog will break down the engineering metrics benchmarks, their categories, and related insights.
Key Categories of Software Engineering Metrics
DORA Metrics
DORA (DevOps Research and Assessment) metrics in software engineering are key indicators of engineering team performance. These software engineering metrics focus on speed and stability, and showcase the effectiveness of your software delivery processes.
- Cycle Time (aka Lead Time for Changes): The time it takes for a single engineering task to go through the different phases of the delivery process from 'code' to 'production'.
- Short cycle times showcase a streamlined and efficient development process.
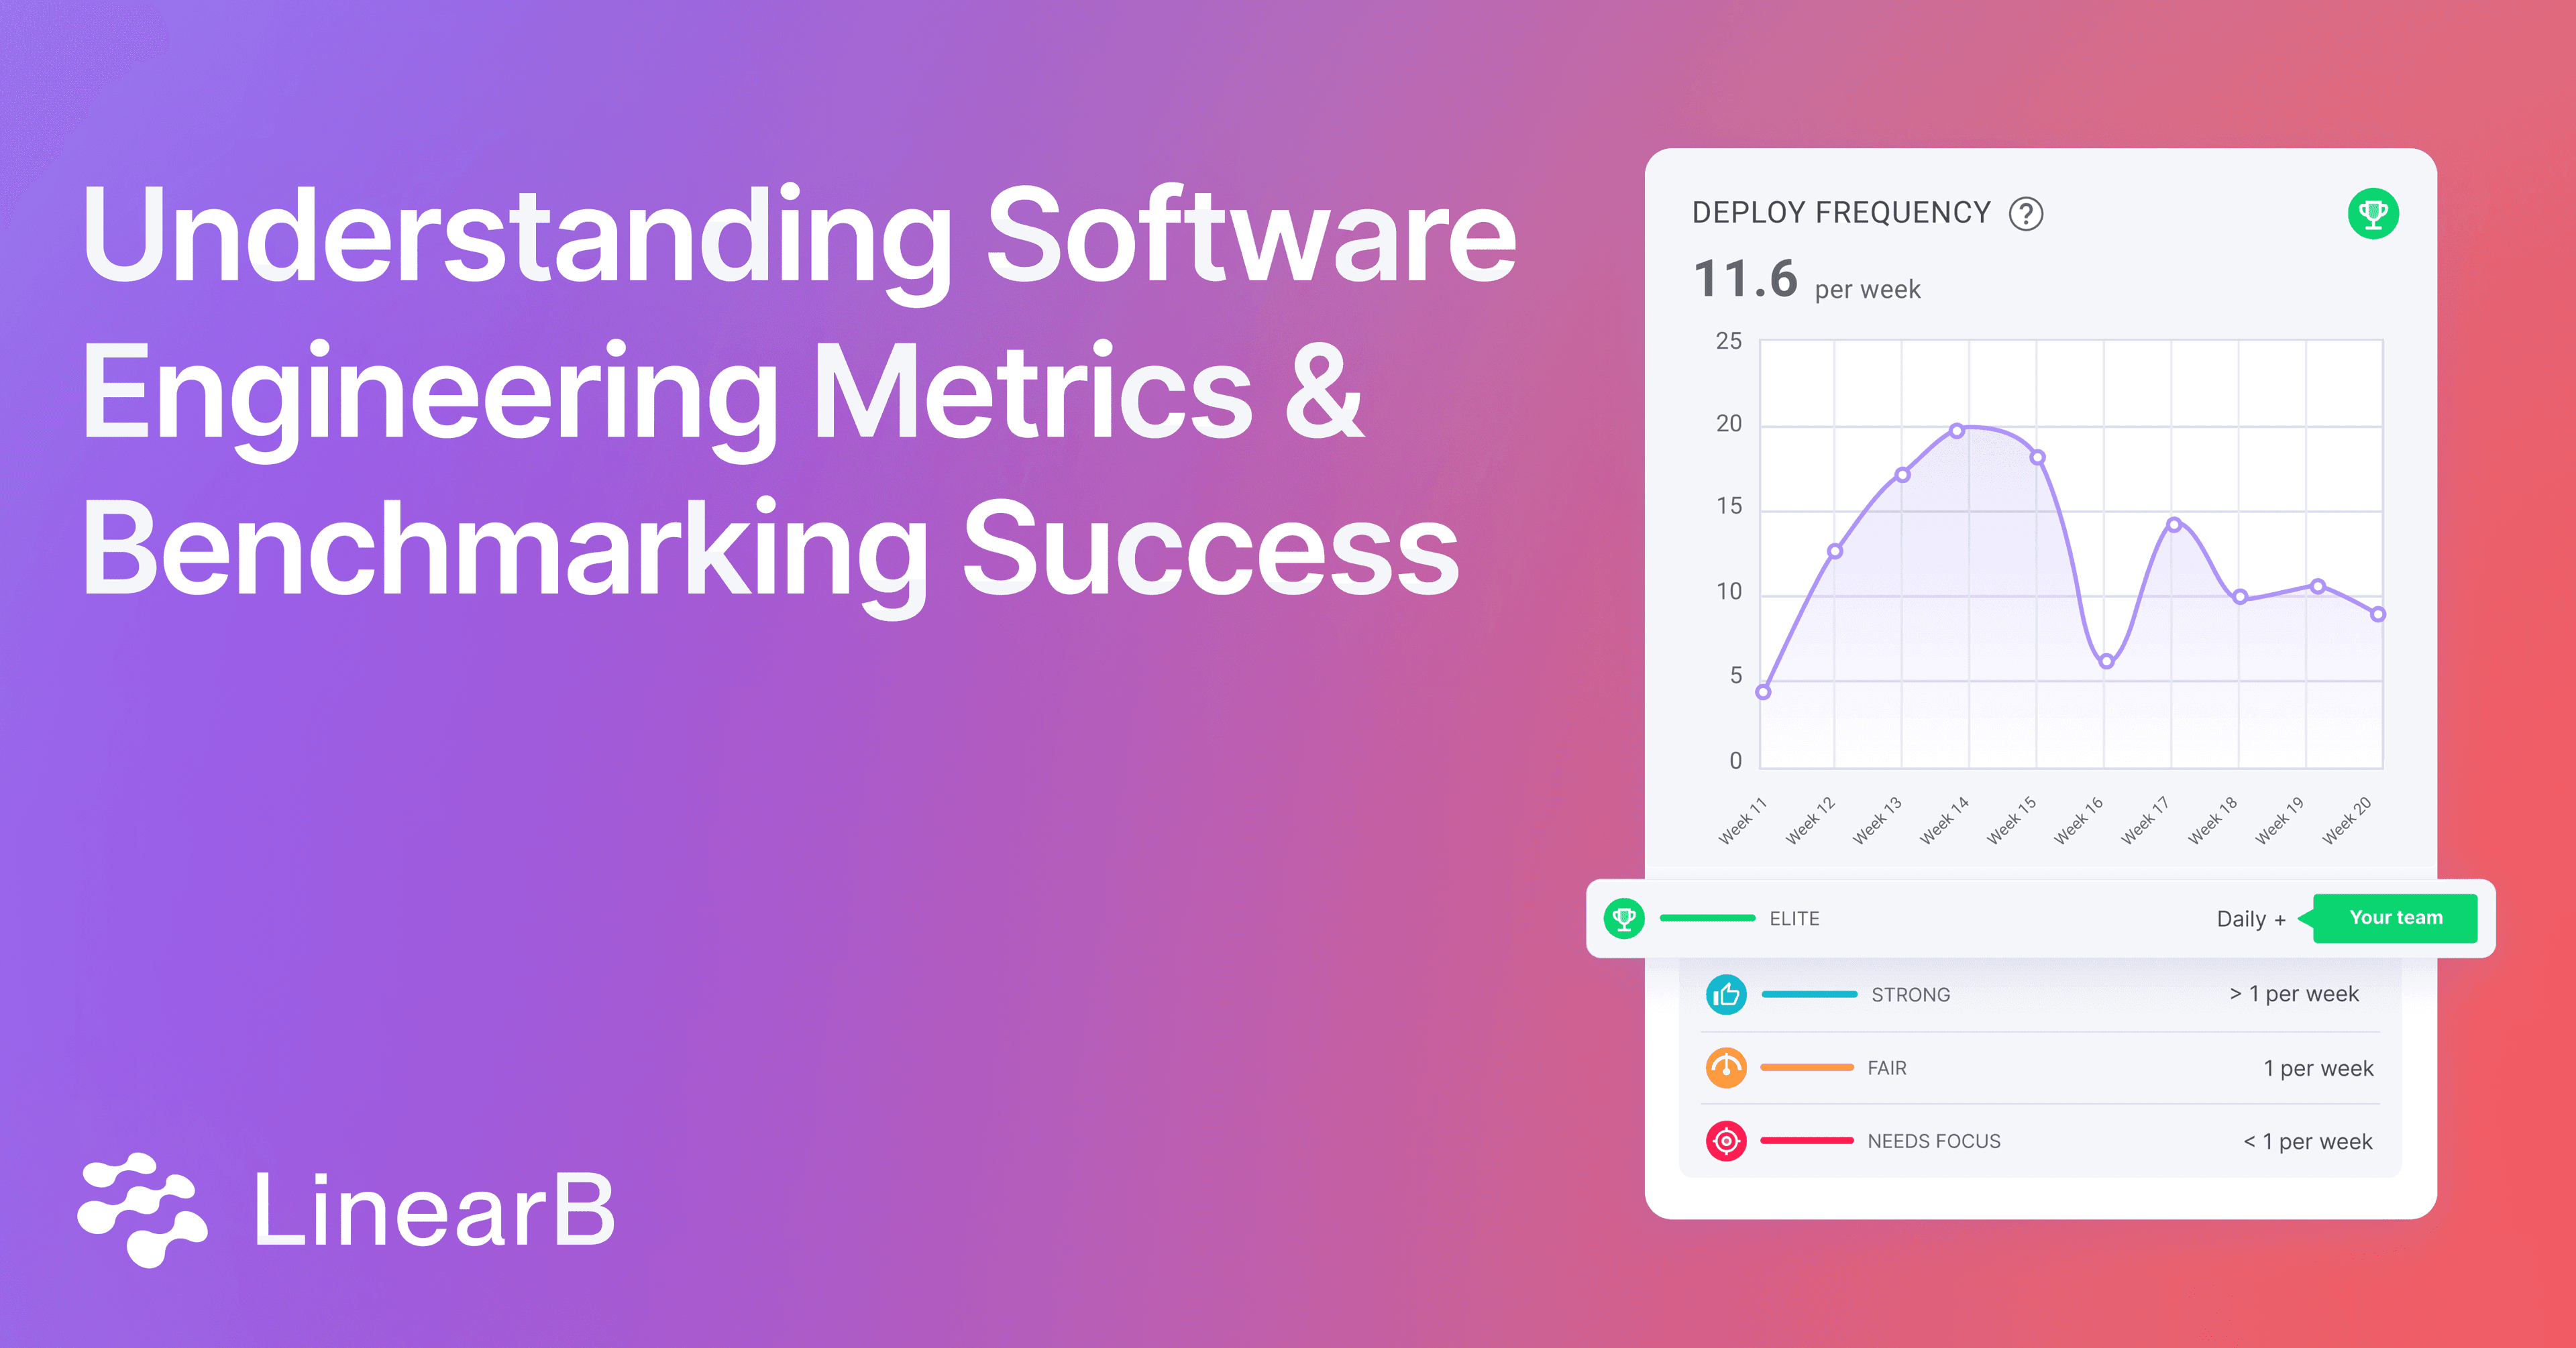
- Deployment Frequency: Measures how often code is released.
- Elite deployment frequency represents a stable and healthy continuous delivery pipeline.
- Mean Time to Recovery (MTTR): The average time it takes to restore from a failure of the system or one of its components.
- Low MTTR indicates strong recovery capabilities and system resilience.
- Change Failure Rate (CFR): The percentage of deployments causing a production failure.
- A low CFR reflects the quality and reliability of releases.
- Coding Time: The time from the first commit to the issuance of a pull request.
- Shorter coding times correlate with low work-in-progress (WIP), smaller pull requests, and clearer requirements.
- PR Pickup Time: The time a pull request waits before being reviewed.
- Low pickup times reflect strong teamwork and a healthy review culture.
- PR Review Time: The time it takes to complete a code review and get a pull request merged.
- Low review time represents strong teamwork and a healthy review process.
- Deploy Time: The time from when a branch is merged to when the code is released.
- Short deploy times are indicative of a stable and healthy continuous delivery pipeline.

Efficiency software engineering metrics demonstrate how effectively your team utilizes time and resources to deliver software. These metrics show where you can optimize processes to increase productivity.

Quality and Predictability Metrics in Software Engineering
These metrics in software engineering assess the consistency and reliability of your development processes. They focus on aspects that influence code quality and the predictability of outcomes.
- PR Size: The number of lines of code modified in a pull request.
- Smaller pull requests are easier to review and correlate with lower cycle times.
- Rework Rate: The percentage of code changes that are altered within 21 days.
- High rework rates signal potential quality issues and code churn.
- Refactor Rate: The proportion of code changes applied to legacy code.
- Regular refactoring is imperative to retain code quality and reduce technical debt.
- Planning Accuracy: The ratio of planned work vs. delivered work during a sprint.
- High planning accuracy indicates stable execution and predictability.
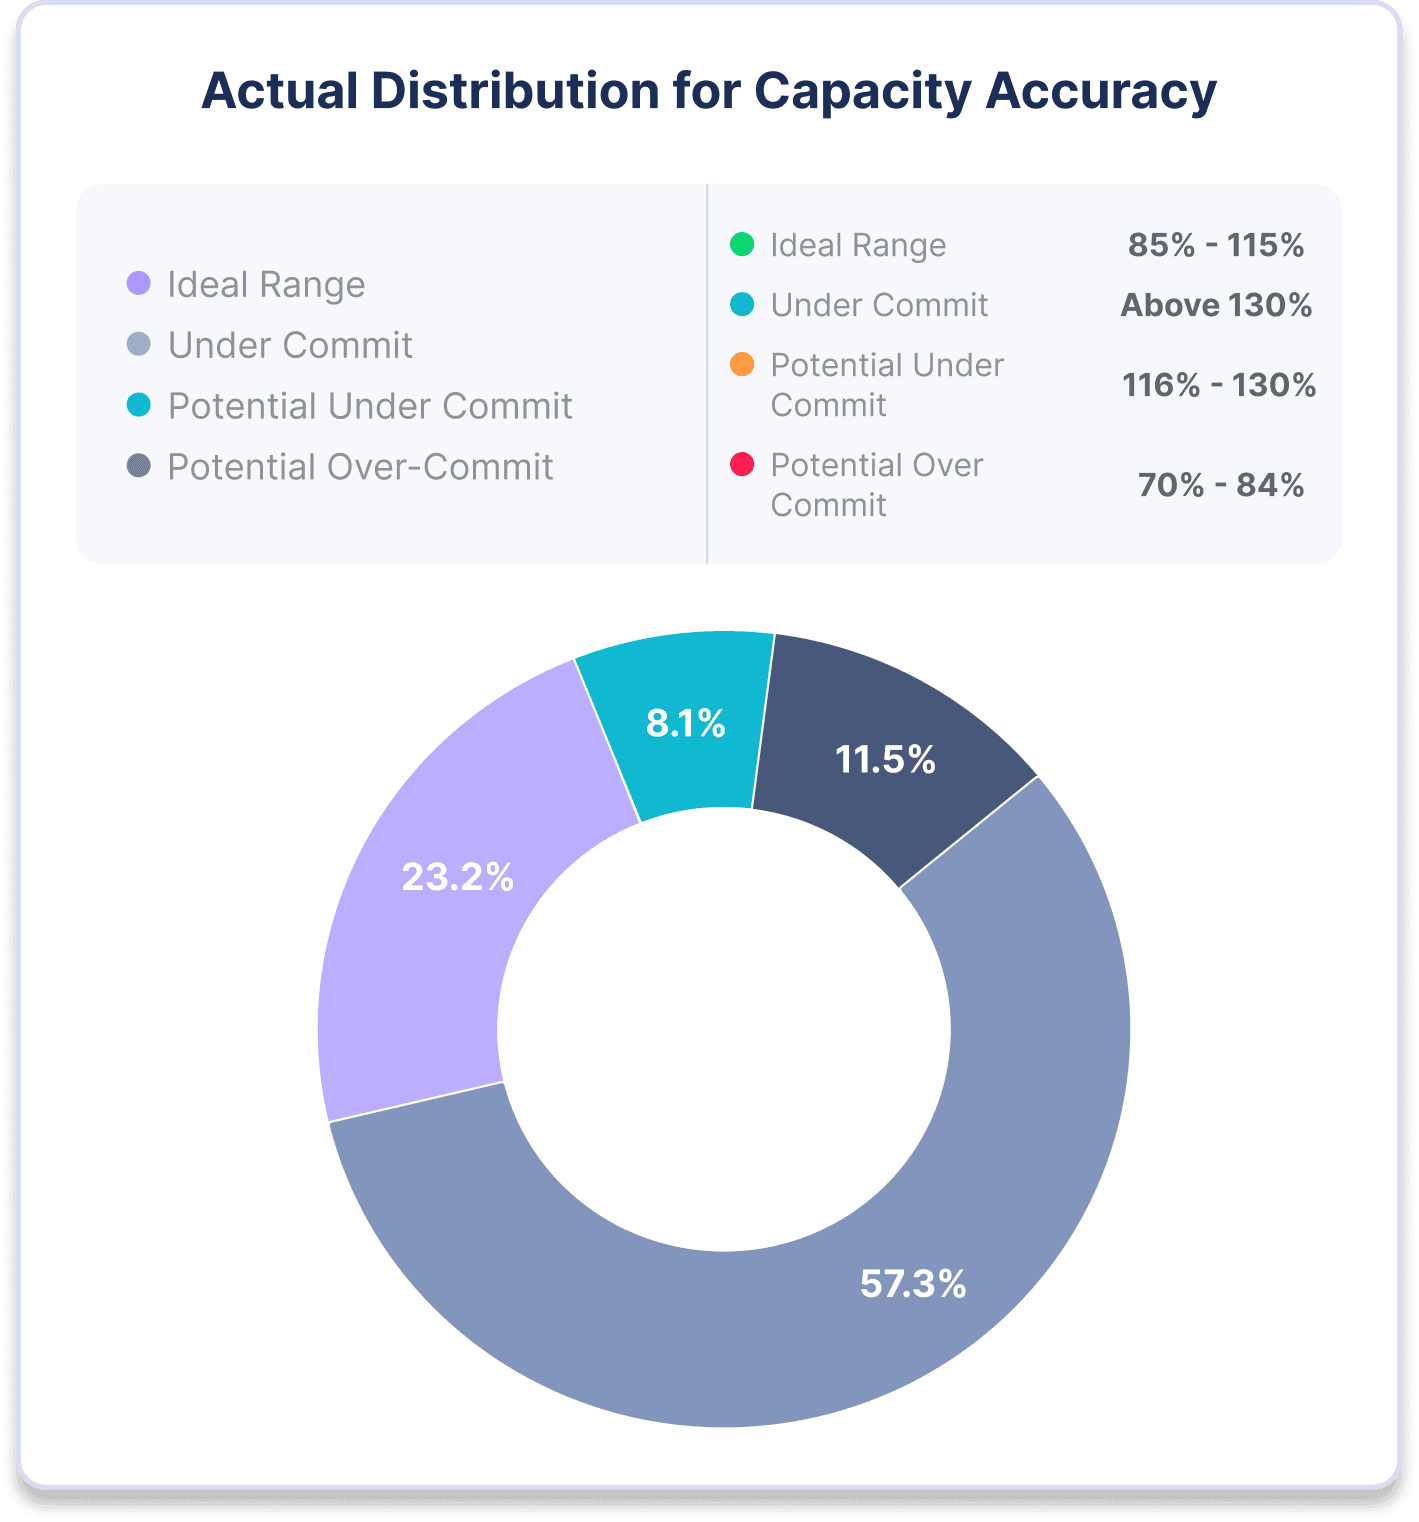
- Capacity Accuracy: Measures the amount of work completed compared to the planned amount. It shows how effectively the team can deliver as expected.

Perception Metrics
Perception metrics are an emerging subset of software engineering metrics that involve qualitative measures derived from developer surveys. You can use surveys to analyze developer perception and get real-time feedback about potential friction points that impact developer experience and productivity.
If you invest enough time into surveys, you can eventually quantify developer perception improvements over time. You should ask about the impact of CI/CD pipelines, new tooling you've introduced, process blockers, and other aspects of a developer's life to get insights into their potential bottlenecks.
However, developer surveys come with several limitations you should be aware of. First, they often have a negativity bias, which means they may disproportionately highlight negative experiences or issues. Additionally, they don't typically indicate which problems are the most important to prioritize, making it challenging to focus on the most impactful areas.
Surveys also have a limited ability to surface unknown problems because they only capture the issues that respondents are already aware of. Some survey metrics also require you to establish a benchmark before you can understand what is “good” for your organization. Finally, maintaining surveys over the long term can be difficult because they require continuous effort and engagement from participants. Therefore, while developer surveys can provide valuable insights, it's essential to use them alongside other methods to comprehensively understand the situation.
Effort Metrics
Effort metrics in software engineering include measures like the number of commits, lines of code changed, and developer velocity. These software engineering metrics are commonly used to track the work done by individuals, are often misused to penalize developers, and offer an incomplete view of developer productivity.
Following McKinsey’s study on developer productivity, these metrics have had a resurgence in popularity, but they have significant limitations and are not considered effective measures of developer productivity for several reasons:
- Commits: A commit is a snapshot of changes made to the codebase. It represents a point in time where a developer has saved their progress in version control.
- Limitations:
- Commits can vary greatly in size and impact. The number of commits doesn’t reflect the quality or significance of changes.
- Developers have different working styles. Some might commit frequently with small changes, while others commit larger changes less often.
- Limitations:
- Lines of Code Changed: This metric counts the number of lines added, modified, or deleted in the codebase.
- Limitations:
- More lines of code don’t equal better or more productive work. Writing concise, efficient code is more valuable than producing large quantities of code.
- Reducing code lines through refactoring can improve code quality, but may appear as negative productivity.
- Limitations:
- Velocity: This metric counts the number of story points, tasks, or features delivered during a sprint.
- Limitations:
- Velocity doesn’t account for the complexity of tasks or the effort required to complete them. A simple feature might inflate velocity, while a complex problem-solving task might reduce it without reflecting productivity.
- Different teams might assign different story point values or task sizes, leading to inconsistent comparisons across teams or projects.
- Velocity focuses on completed coding tasks and ignores essential non-coding activities that are critical to successful software development.
- Limitations:
These metrics can be easily gamed, and incentivize quantity over quality, leading developers to write more code without making meaningful contributions. Using these metrics as productivity measures encourages unhealthy work practices, such as prioritizing visible output over strategic thinking and collaboration.
Instead of relying on effort metrics, organizations should use more comprehensive, team-based measures.
Engineering Investment Benchmarks and Capacity Accuracy Benchmarks
Engineering Investment Benchmarks
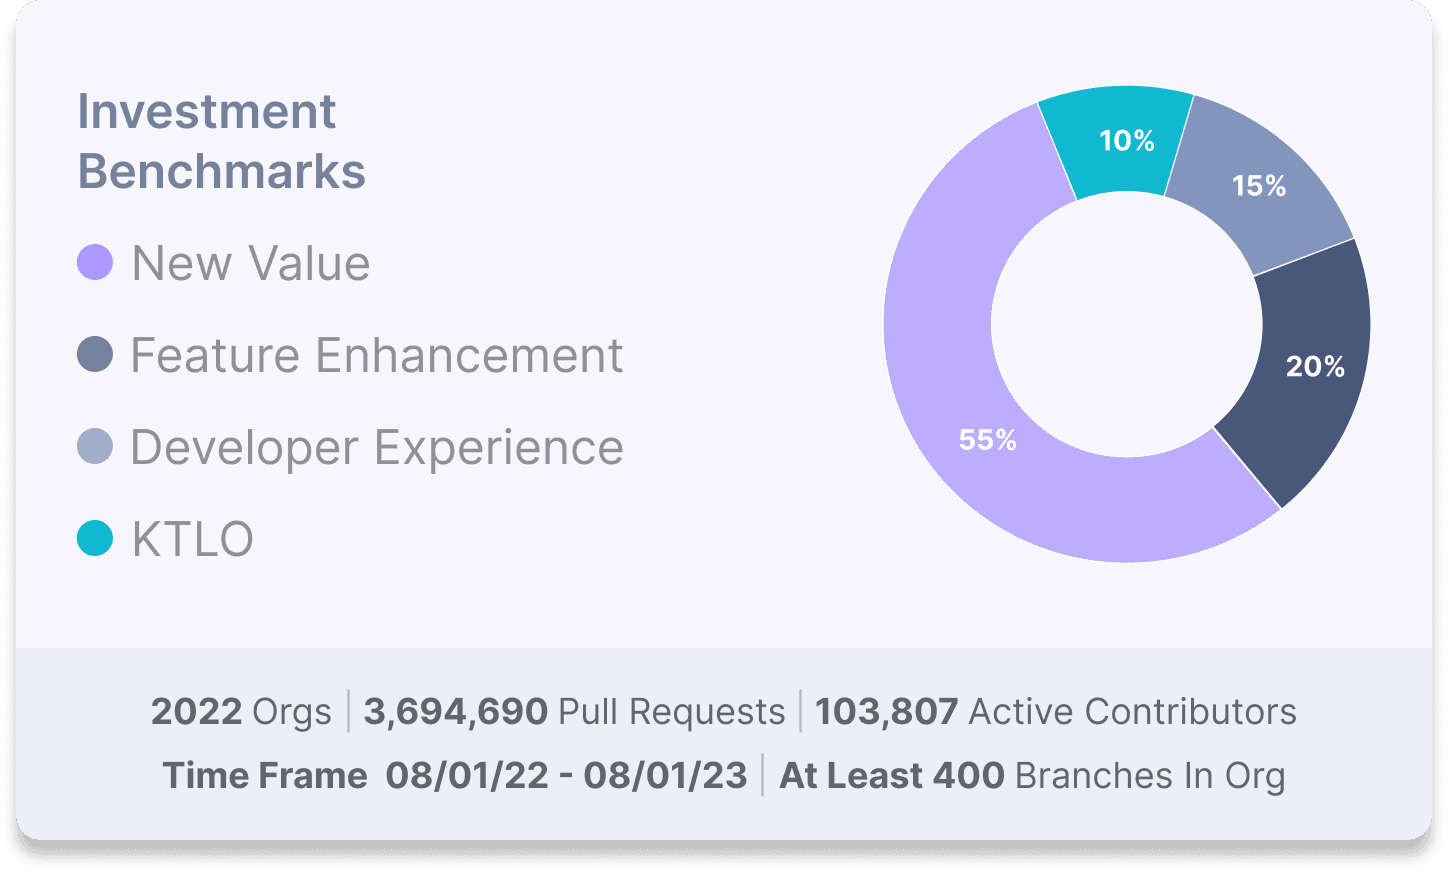
Engineering investment benchmarks provide a high-level view of how teams allocate their resources across different types of work. Understanding these investments is crucial for aligning engineering efforts with business objectives and ensuring balanced growth.
- New Value: New features that increase revenue and growth via customer acquisition or expansion. Examples include new features or platforms, technical partnerships, and product roadmap work.
- Feature Enhancements: Improvements to existing features that help drive customer satisfaction. Examples include customer requests, performance improvements, security fortification, and initiatives focusing on adoption, retention, and reliability.
- Developer Experience: Improvements to developer productivity and overall work experience. Examples include improving tooling and platforms, adding test automation, restructuring code to reduce technical debt, and reducing backlog.
- KTLO (Keeping the Lights On): Requirements to maintain daily operations with a stable level of service. Examples include maintaining your security posture, service monitoring and troubleshooting, and maintaining uptime SLAs.
- Inefficiency pool: Resources wasted due to inefficiencies in the development process. Examples include excessive context switching, software development bottlenecks, and delayed responses to software delivery pipeline blockers.
Capacity Accuracy Benchmarks
Capacity accuracy measures how closely a team adheres to its planned workload during an iteration. This metric in software engineering helps teams evaluate their ability to predictably deliver work and manage resources effectively.
- Ideal Range (85%-115%): Indicates that the team is accurately planning and executing its workload.
- Under Commit (Above 130%): Suggests that the team is committing to less work than it can handle, potentially leading to underutilization.
- Potential Over Commit (70%-84%): Indicates that the team may be taking on more work than it can handle, risking burnout and inefficiencies.
Conclusion
Understanding and effectively utilizing software engineering metrics is essential for driving team performance and achieving business goals. By benchmarking your team against industry standards and focusing on DORA, and quality and predictability metrics, you can identify areas for improvement and implement targeted strategies to drive continuous improvement.
Want to learn more about Software Engineering Metrics Benchmarks? Download the full report here.
