This guide–part one of LinearB's engineering success model–will walk you through how to build an engineering metrics program that emphasizes the health, efficiency, and business alignment of your teams. It covers:
- Visibility: Using your SDLC data to find inefficiency and determine business alignment
- Benchmarking: Better understand your metrics and see your path forward with industry intelligence
- Strategy: Step-by-step guidance on setting tangible, data-backed improvement goals that will drive operational and business success
Under Pressure
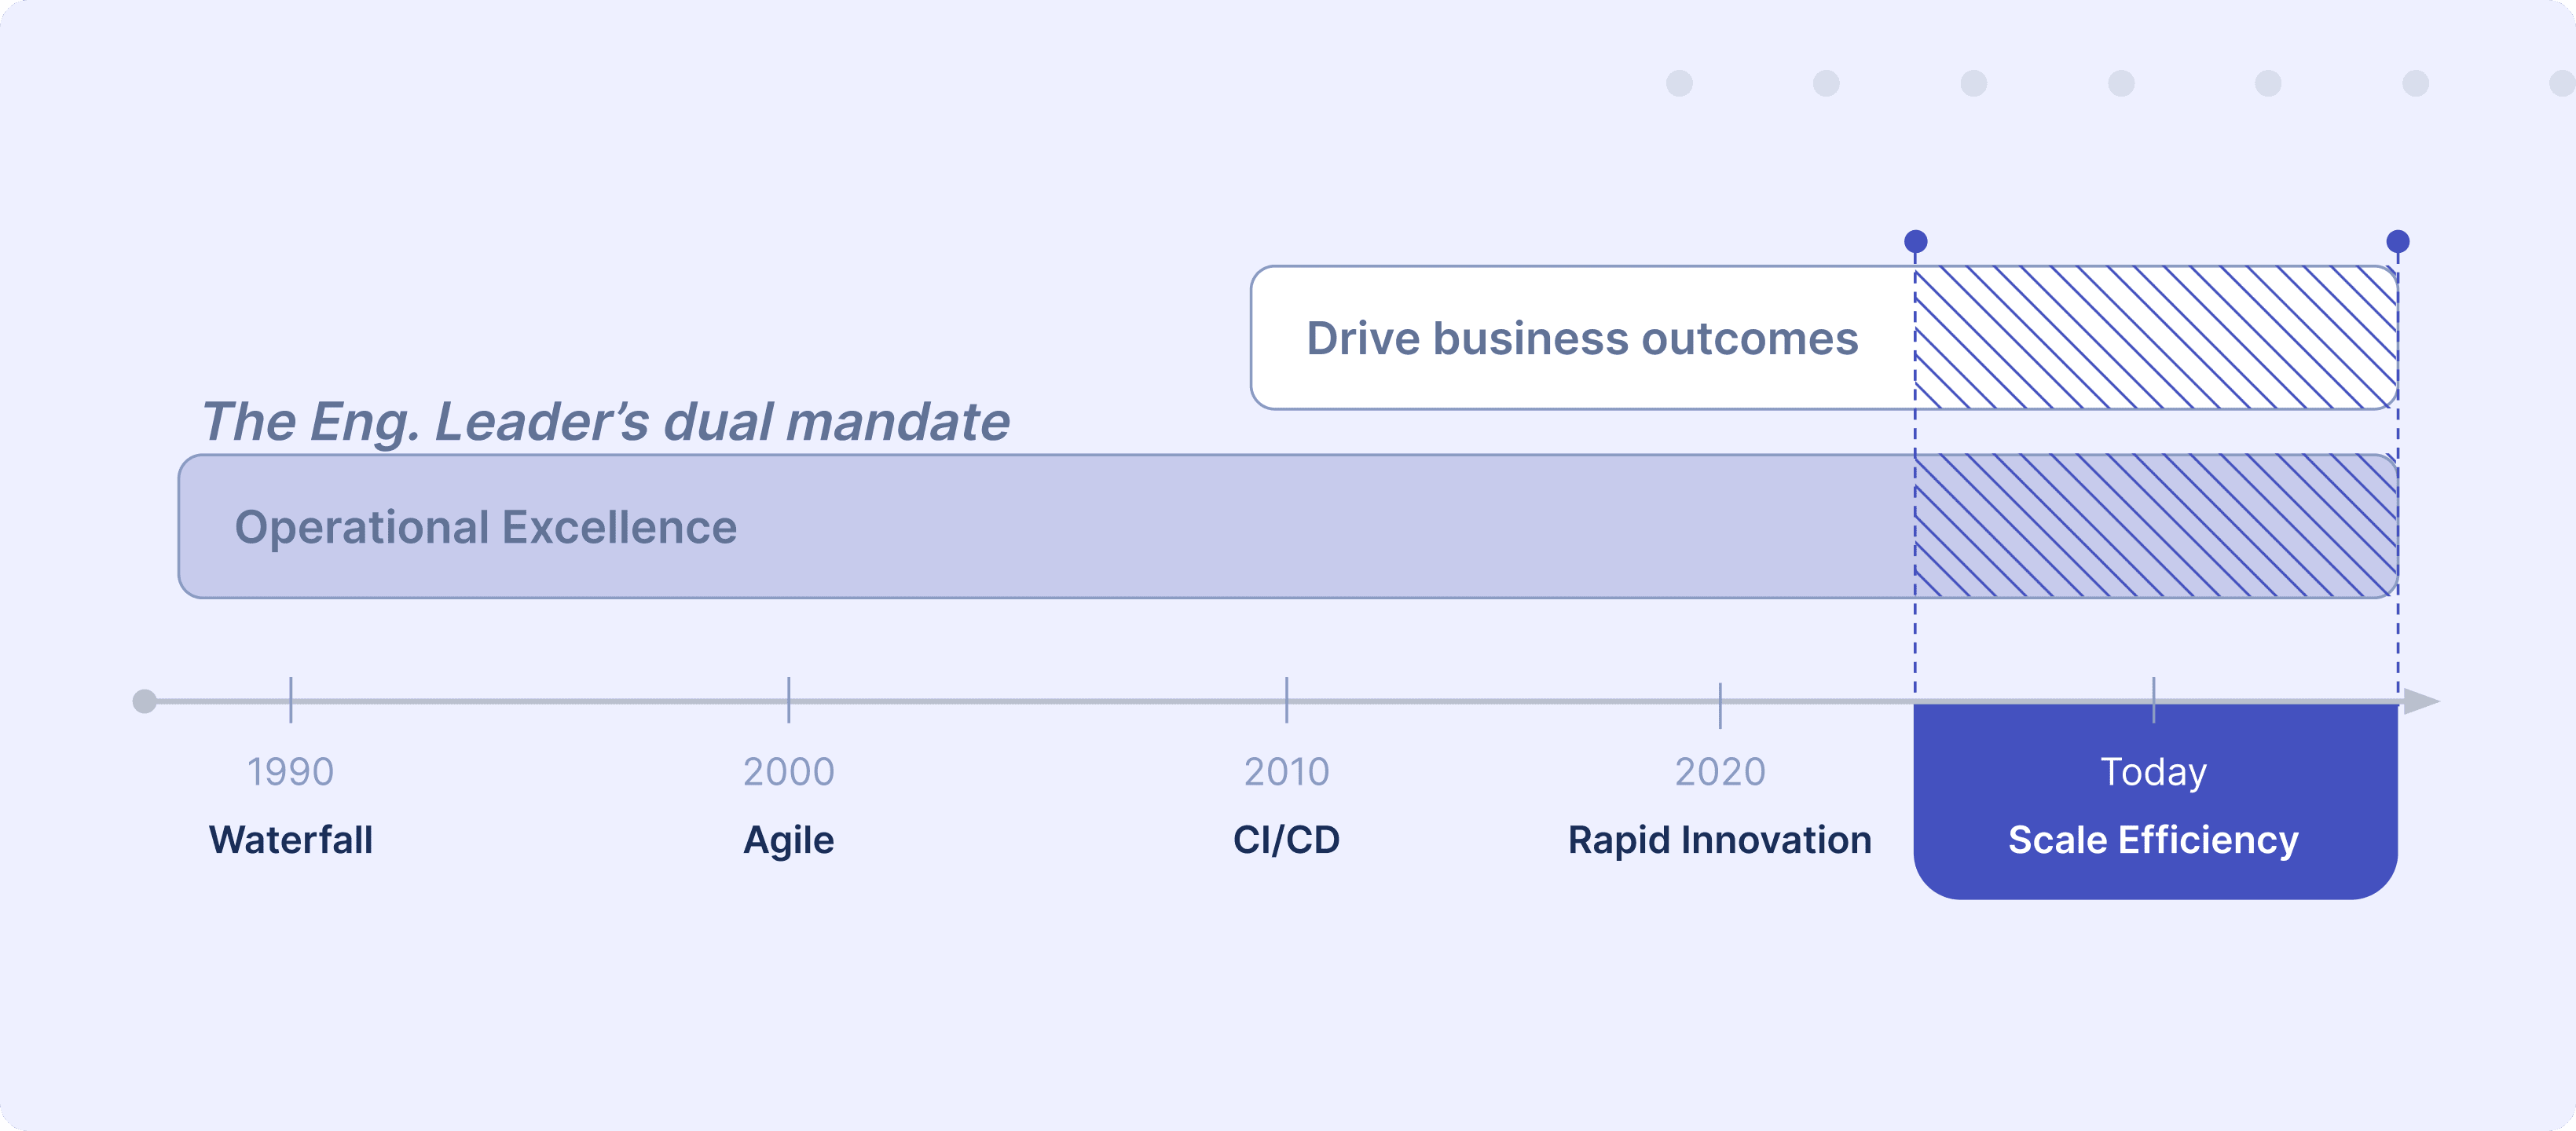
Pressure is the one constant in an engineering leader’s day-to-day life. Pressure to deliver more features. Pressure to deliver them faster. Pressure to take on an extra priority project or customer RFE. All with a flat or shrinking budget.
These responsibilities are all part of operational excellence–a result that engineering leaders have always been expected to deliver. But in the last few years the role and core responsibilities of engineering changed, because the business landscape changed: Software development and delivery became a key driver of business value.
And with that paradigm shift comes new added pressure to deliver business results. This is the dual mandate of engineering leaders: continue delivering operational excellence while simultaneously driving the business forward.
A robust engineering metrics program is the first step in meeting this dual mandate.
Want this guide sent directly to your inbox? Click here and enter your email!
The State of Engineering Visibility
Engineering Has a Metrics Problem
Like many teams, you’re likely scratching the surface or just getting started with an engineering metrics program. But before you go too far, you should know that historically we’ve been measuring and presenting the wrong stuff as gospel–think velocity, story points, throughput, and other “standard” metrics.
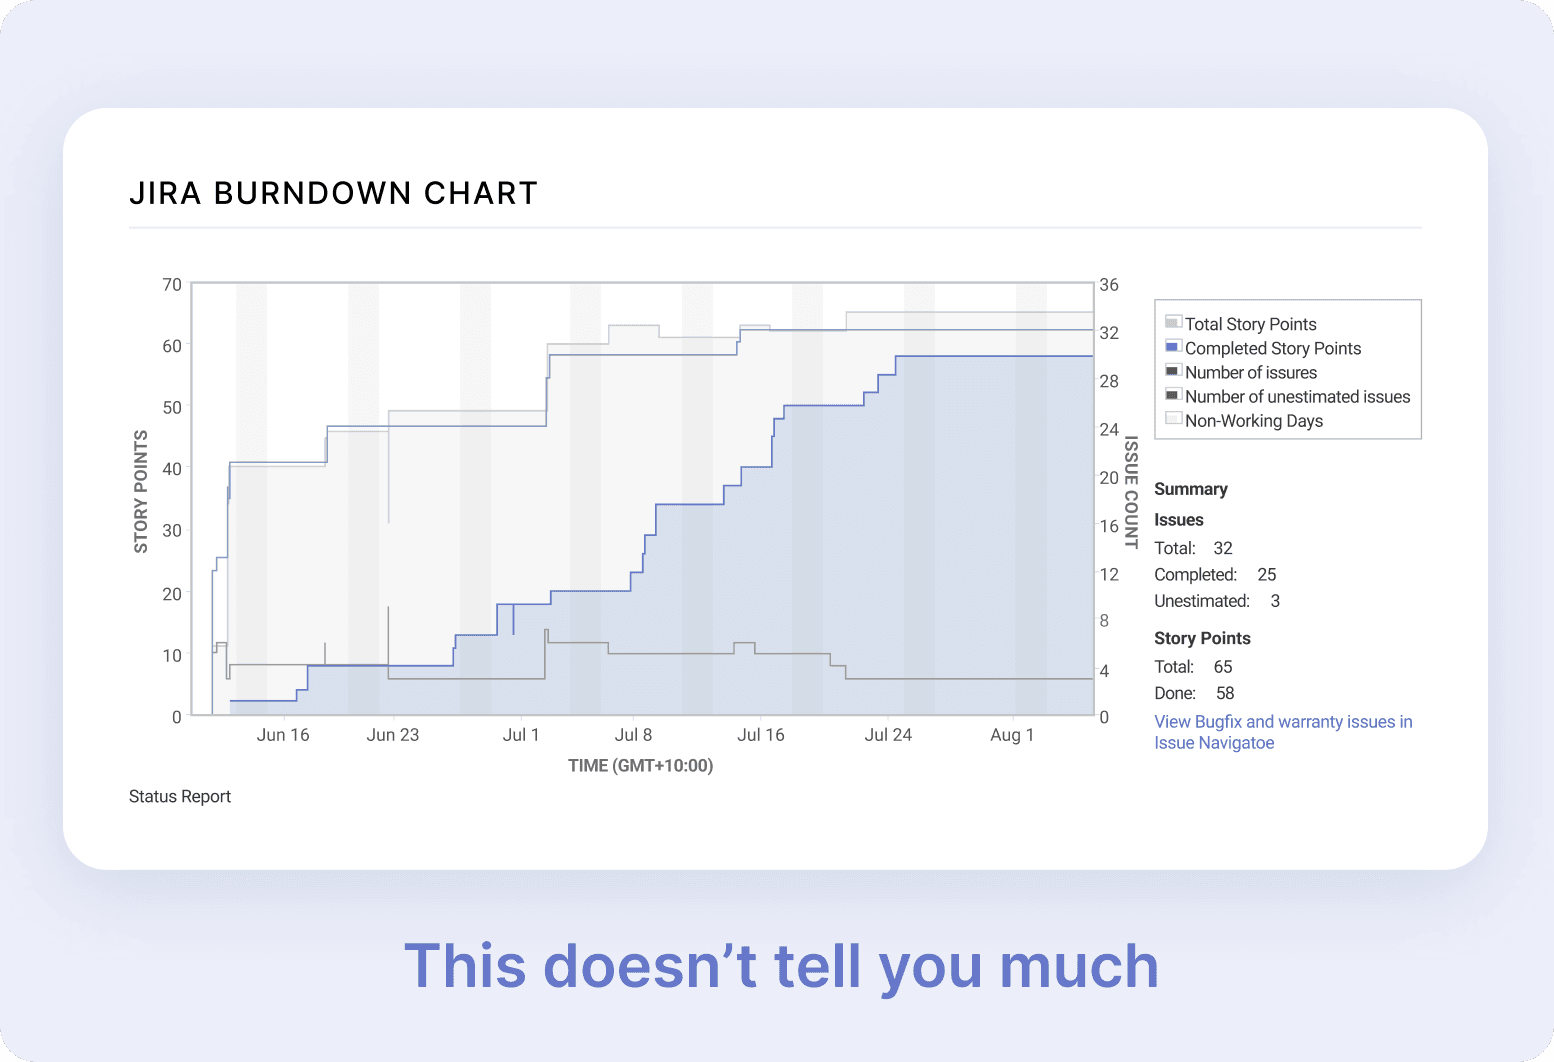
But those metrics only tell part of the story, not to mention that measures like story points are HIGHLY subjective–one team’s 10 is another team’s 5. The engineering data you need to see the full picture is spread out over a bunch of places (PM, git, CI/CD tooling). It’s no wonder that getting a single, easy-to-understand view is so hard.
Mentoring, Not Monitoring
You may already be thinking “My team is going to object to this, they don’t want to be tracked.” You’re right, no one wants someone spying on them. But a complete metrics program is a good thing because it:
- Is the first step toward sustainable improvement
- Is how we prove value to the business quantitatively
- Addresses the reality that so much engineering work goes unrecognized without visibility
- Makes concrete data a shield when discussing increasing budgets and headcount
Here are some talking points to deliver the message, reassure your team that this is a good thing, and set yourself up for success:
- A metrics program enhances regular conversations and check-ins, it won’t replace them
- These metrics are about the work, the process, and the business, not the individual
- The name of the game is team improvement–leave individual metrics tracking and lines of code audits to certain executives who may or may not be a real-life Lex Luthor.
Remember, rule #1 for engineering metrics programs is transparency: Talk to your team about it and make sure they understand what you’re trying to do.
Outcomes of a Metrics Program
The core value of instituting an engineering metrics program is that it’s the foundational step in fulfilling the engineering leaders dual mandate of (1) operational excellence, and (2) driving better business results. And it all begins with visibility.
The result: it becomes crystal clear to business stakeholders exactly how engineering is contributing to the business and driving ROI–efficiency and time savings through automated reporting reduces operational expenditure (OpEx). Not only that, it also quantifies/solidifies engineering’s role as business driver–as opposed to its incorrect historical perception as a cost center.
Now that you’re armed with data, requesting additional headcount, more funding, new tools, etc. becomes a much more productive conversation (even in a down economy), rather than dismissed out of hand. You’ll be able to articulate with clear data how these resources:
- Shorten delivery timelines (and make them more predictable)
- Increase efficiency of strategic, high value projects
- Help drive higher quality and better CSAT and retention
Let’s take a look at the three building blocks needed to get your metrics program off the ground.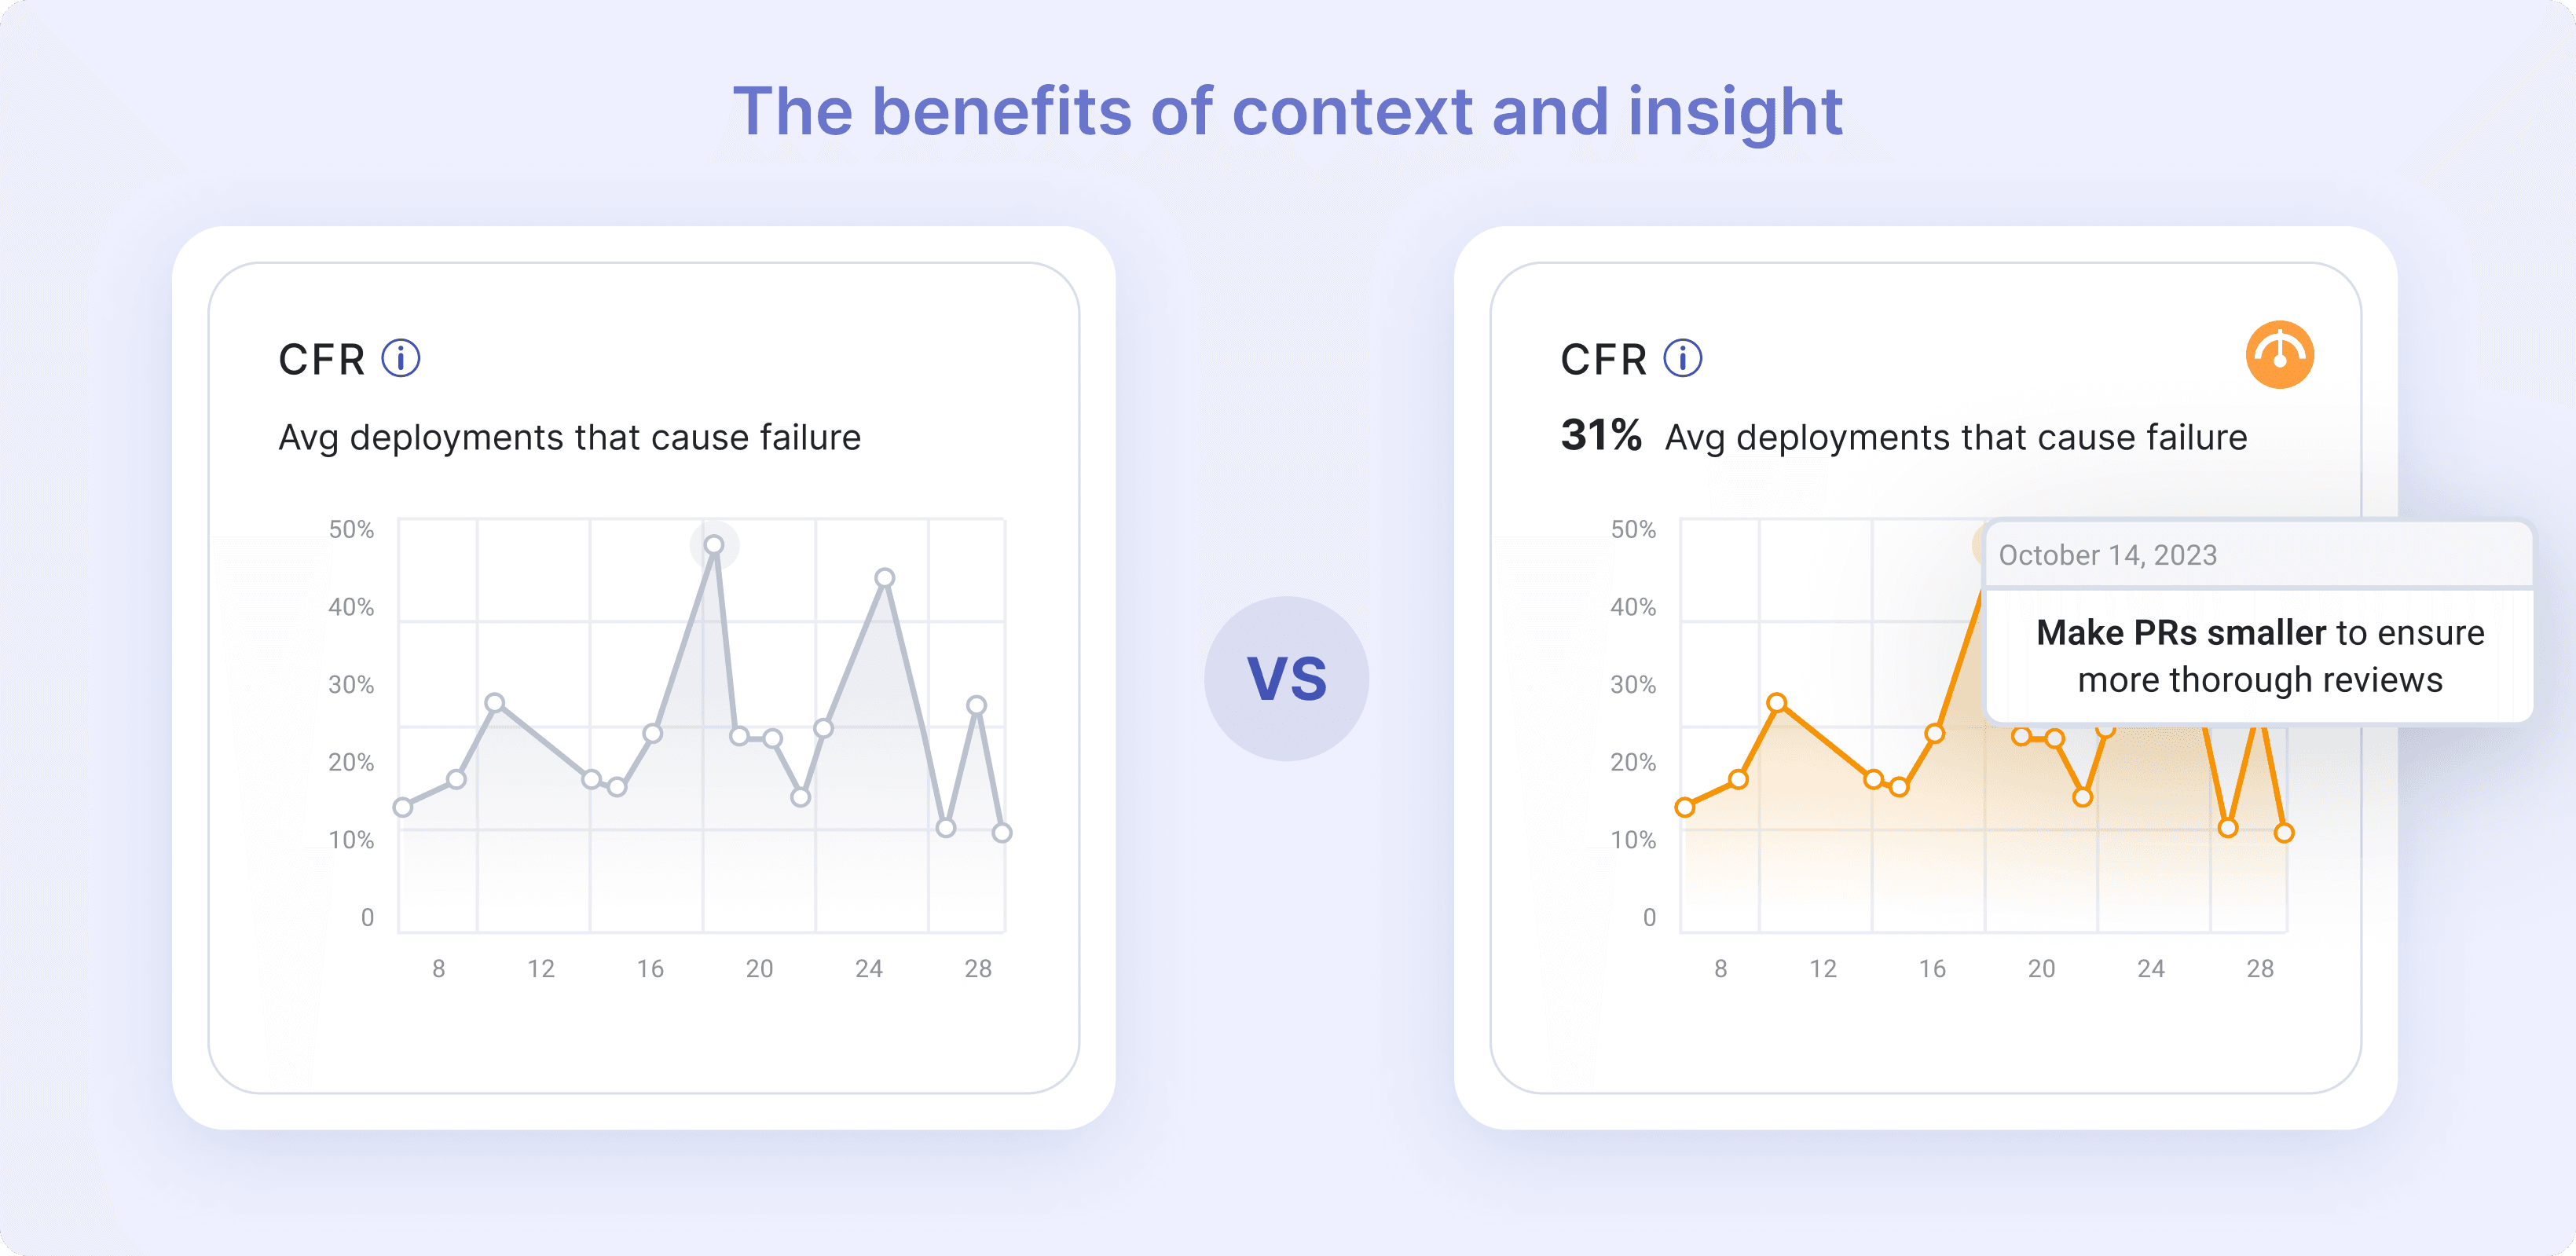
The Three Building Blocks of an Engineering Metrics Program
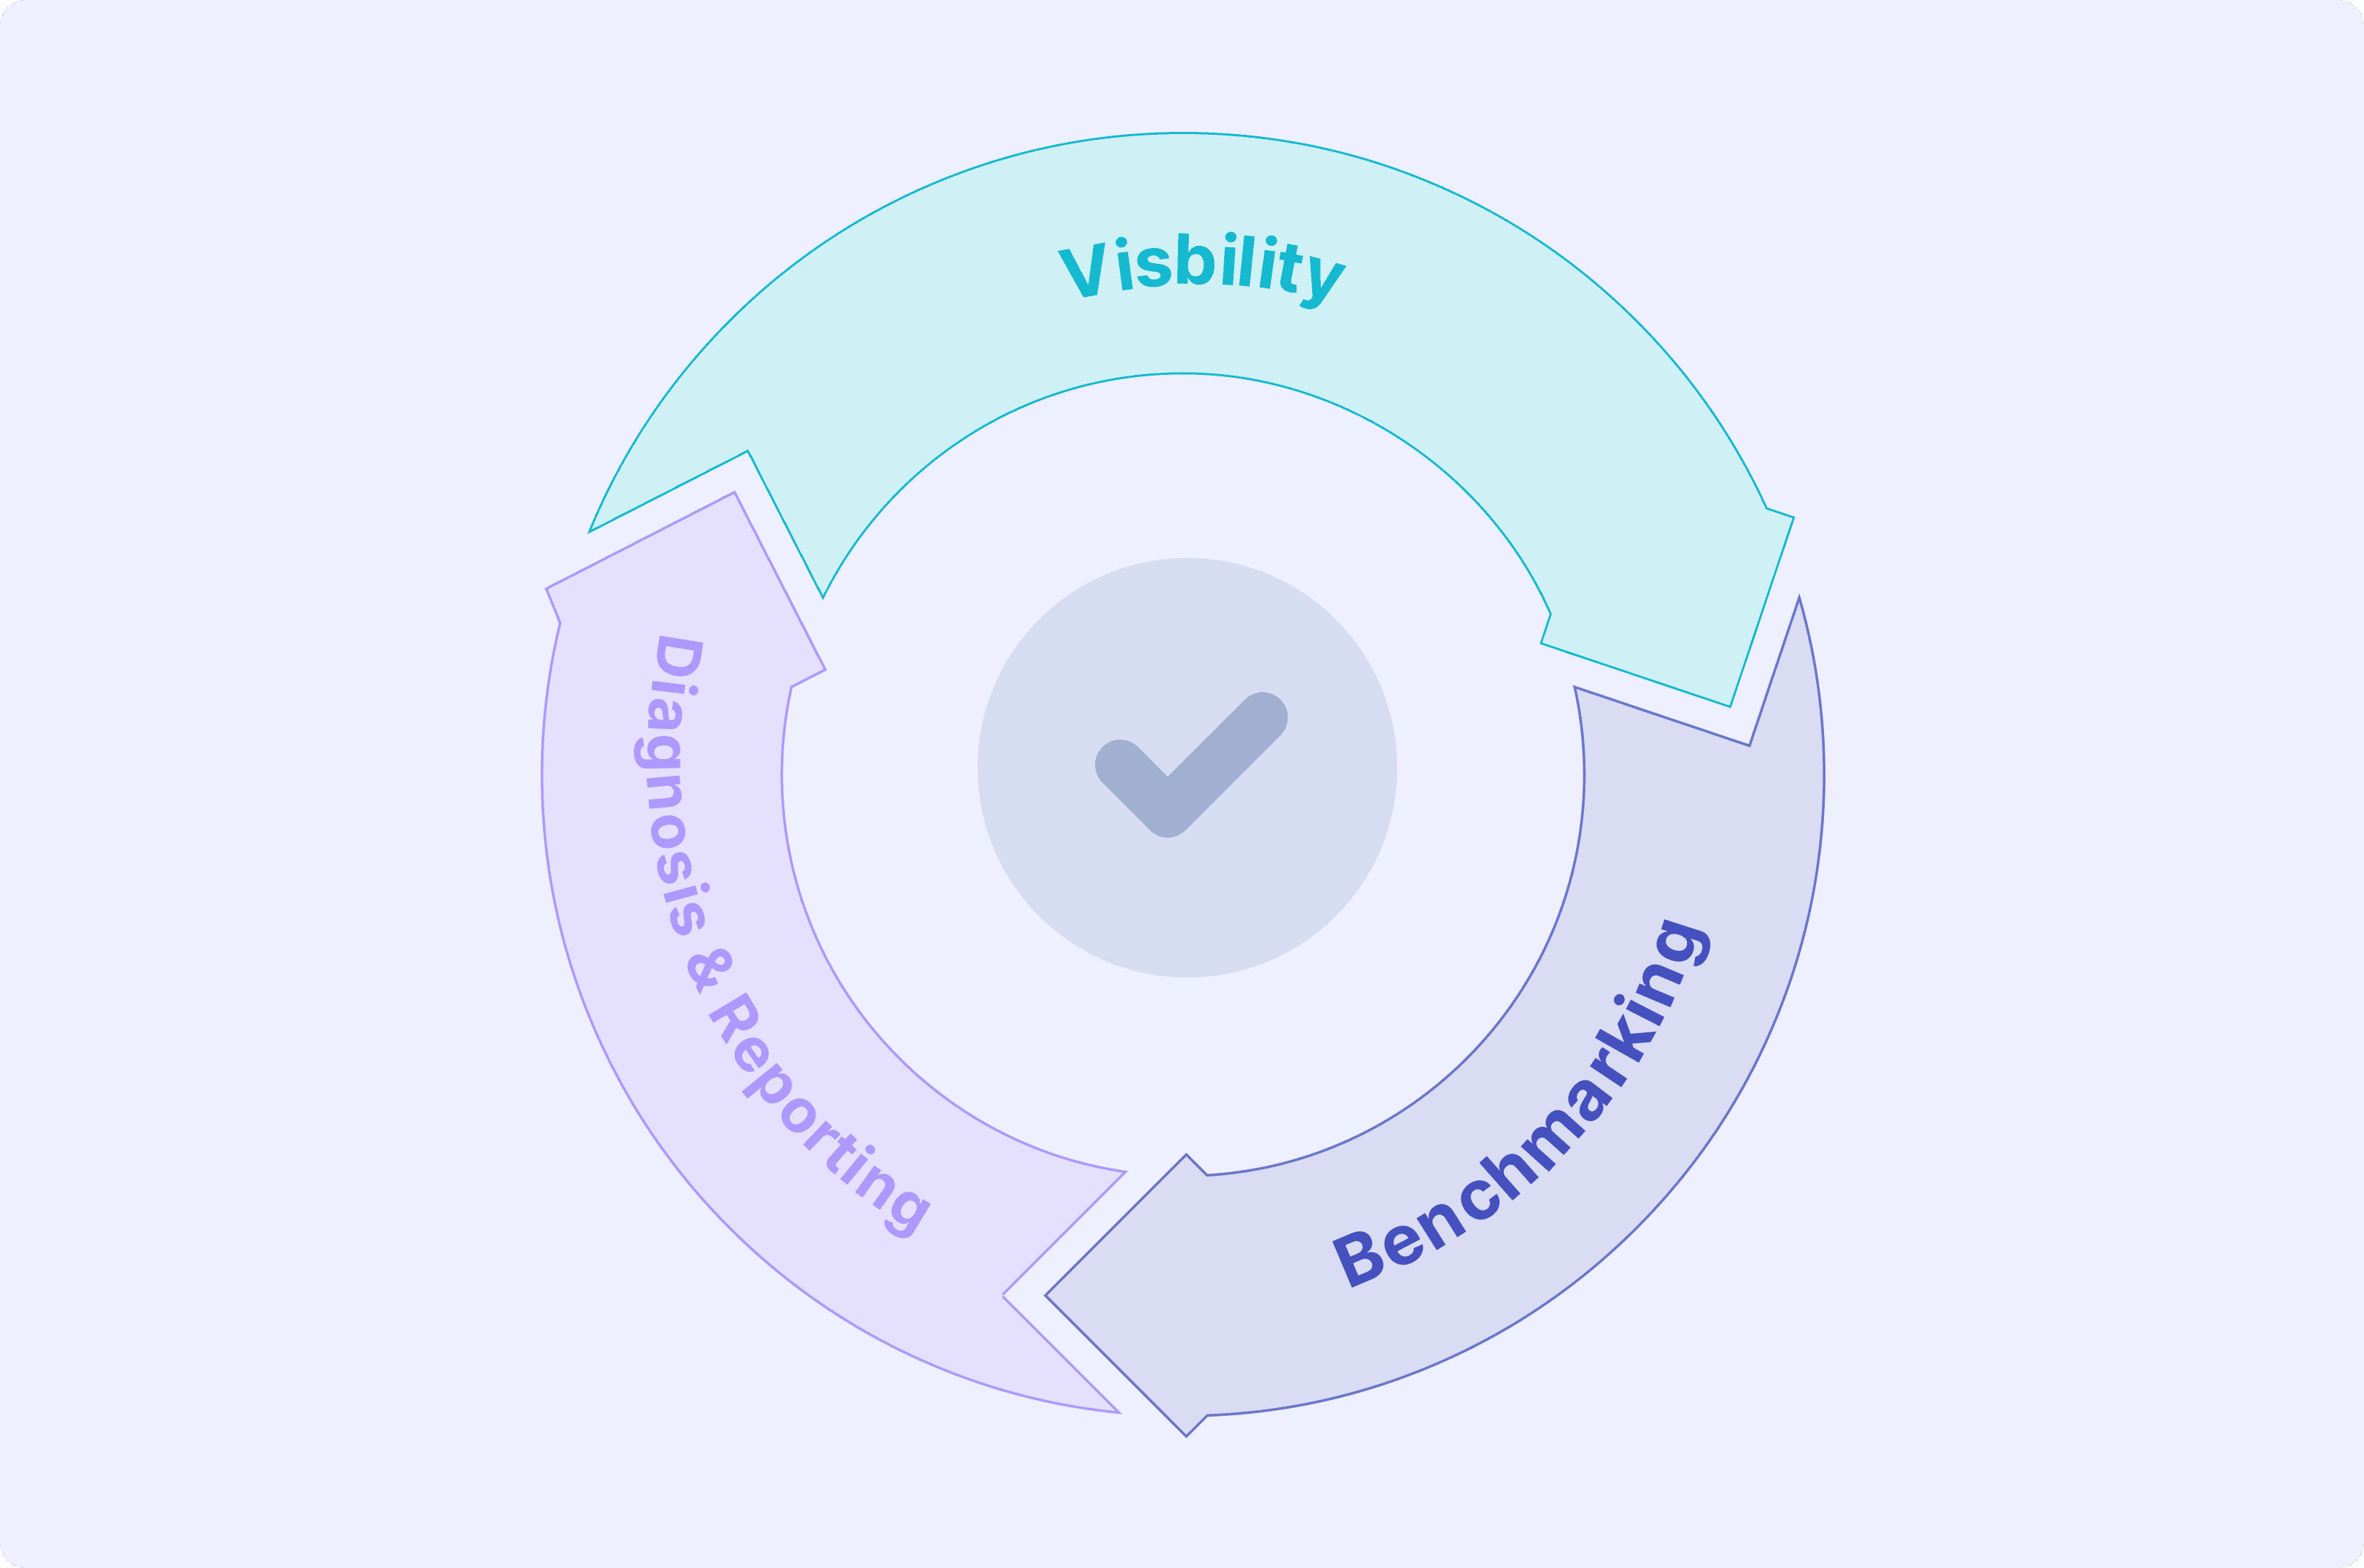
Hearing “building a metrics program from scratch” can sound daunting–but it really doesn’t have to be. We’ll cover this process in detail, but at a high level it’s all about:
- Visibility: See lagging and leading indicators of engineering health
- Benchmarking: Understand what good is, and where your org is today
- Diagnosis and Reporting: Decide which metrics matter to your team, impact the business, and need to be improved. Get on a regular cadence of highlighting successes and further opportunities.
Get Visibility: Tame the Sprawl to Find the Gold
The good news is that the engineering data required for a metrics program is not in short supply. Every commit, comment, and line of code is a data point that can be used to build your roadmap in your improvement journey.
Correlate data sources for a complete picture

The biggest hurdle of getting an engineering metrics program off the ground is that data is at different levels, in different tools, for different audiences. And none of these tools on their own tell the complete story.
As an example, DORA metrics–widely considered to be the best measure of engineering productivity–contain both git and project data.
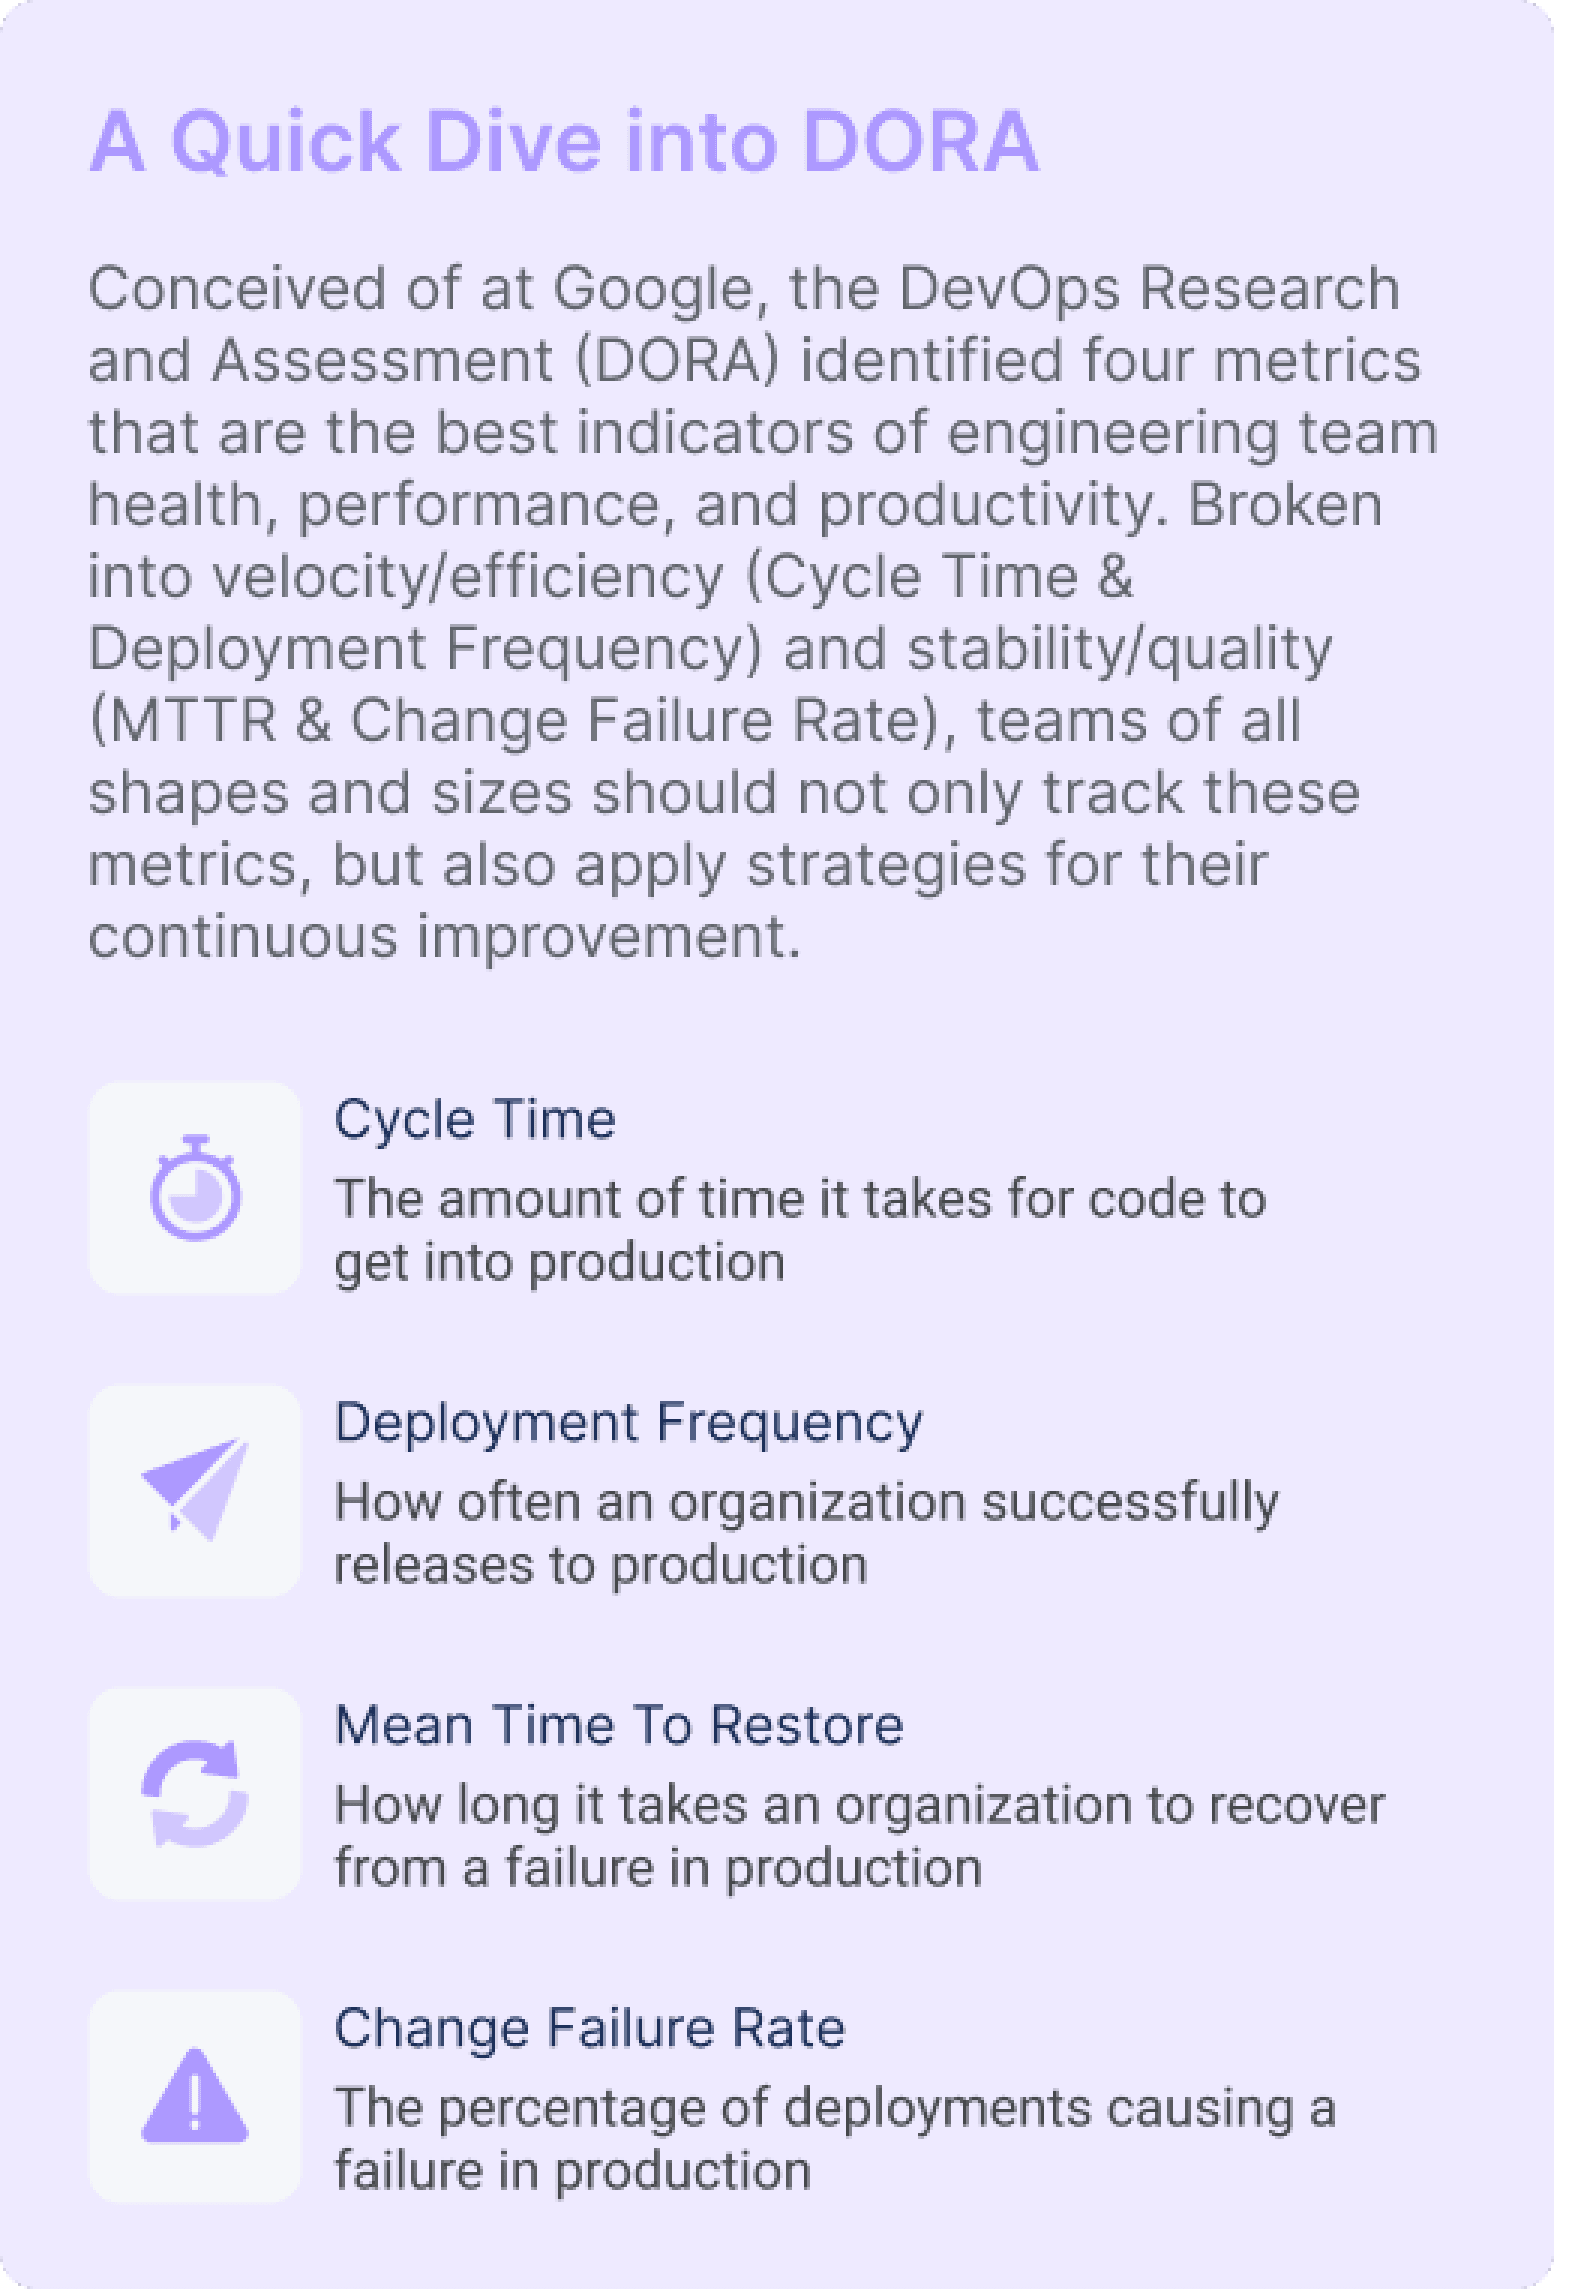
To see your metrics holistically, you’ll need to link data sources, slice and dice the data in a way that makes sense, then look for insight. Once you’ve got correlated data and it’s laid out in an easy-to-consume way, take a historical look back at the last 90 days and see if anything jumps out at you.
Instead of doing all this manually, you could use a tool that does it for you automatically (it’s free).
Here is an example data set that represents what you might find with your historical analysis, broken out into two categories: Efficiency Metrics and Quality Metrics.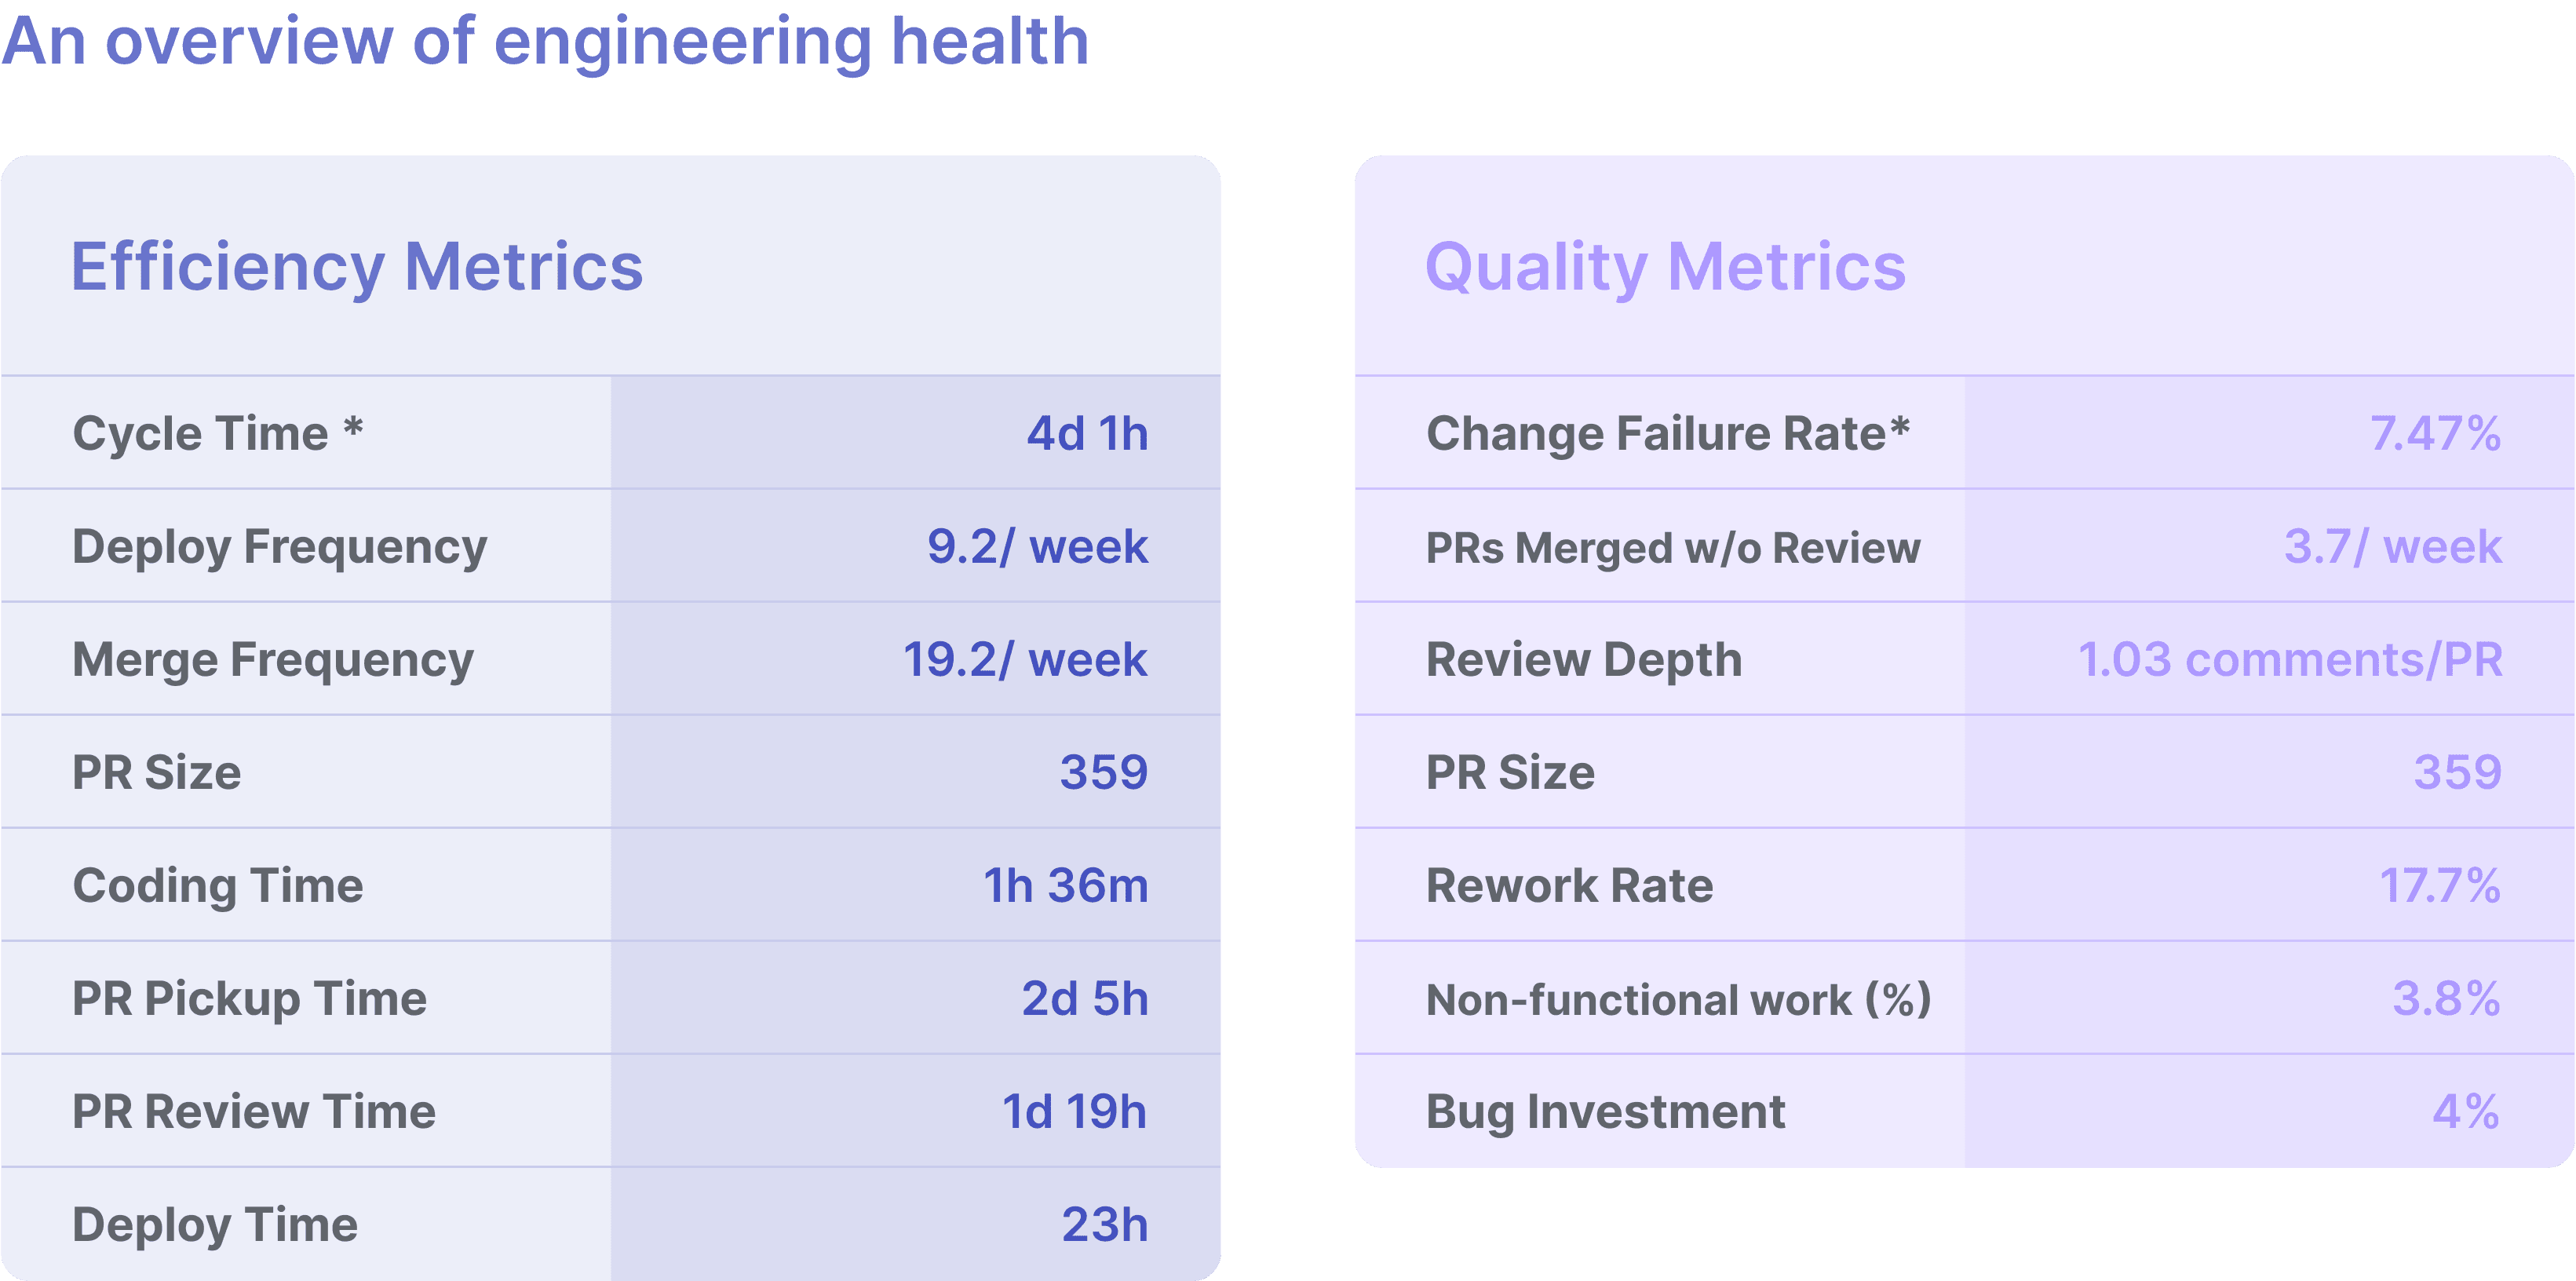
Pro Tip: If you really want to find trends and patterns, look back at the last 6 months
Benchmarking: “Is My Team Doing OK?”
The whole point of an engineering metrics program is to answer that question and then build a strategy to improve.
Once you have your metrics in place, you’ll need to figure out what they mean. Is your 12 day cycle time good? How about your average PR size of 250 lines of code? Visibility is a great first step, but context and really understanding where you are (and how far you have to go) are much more important.
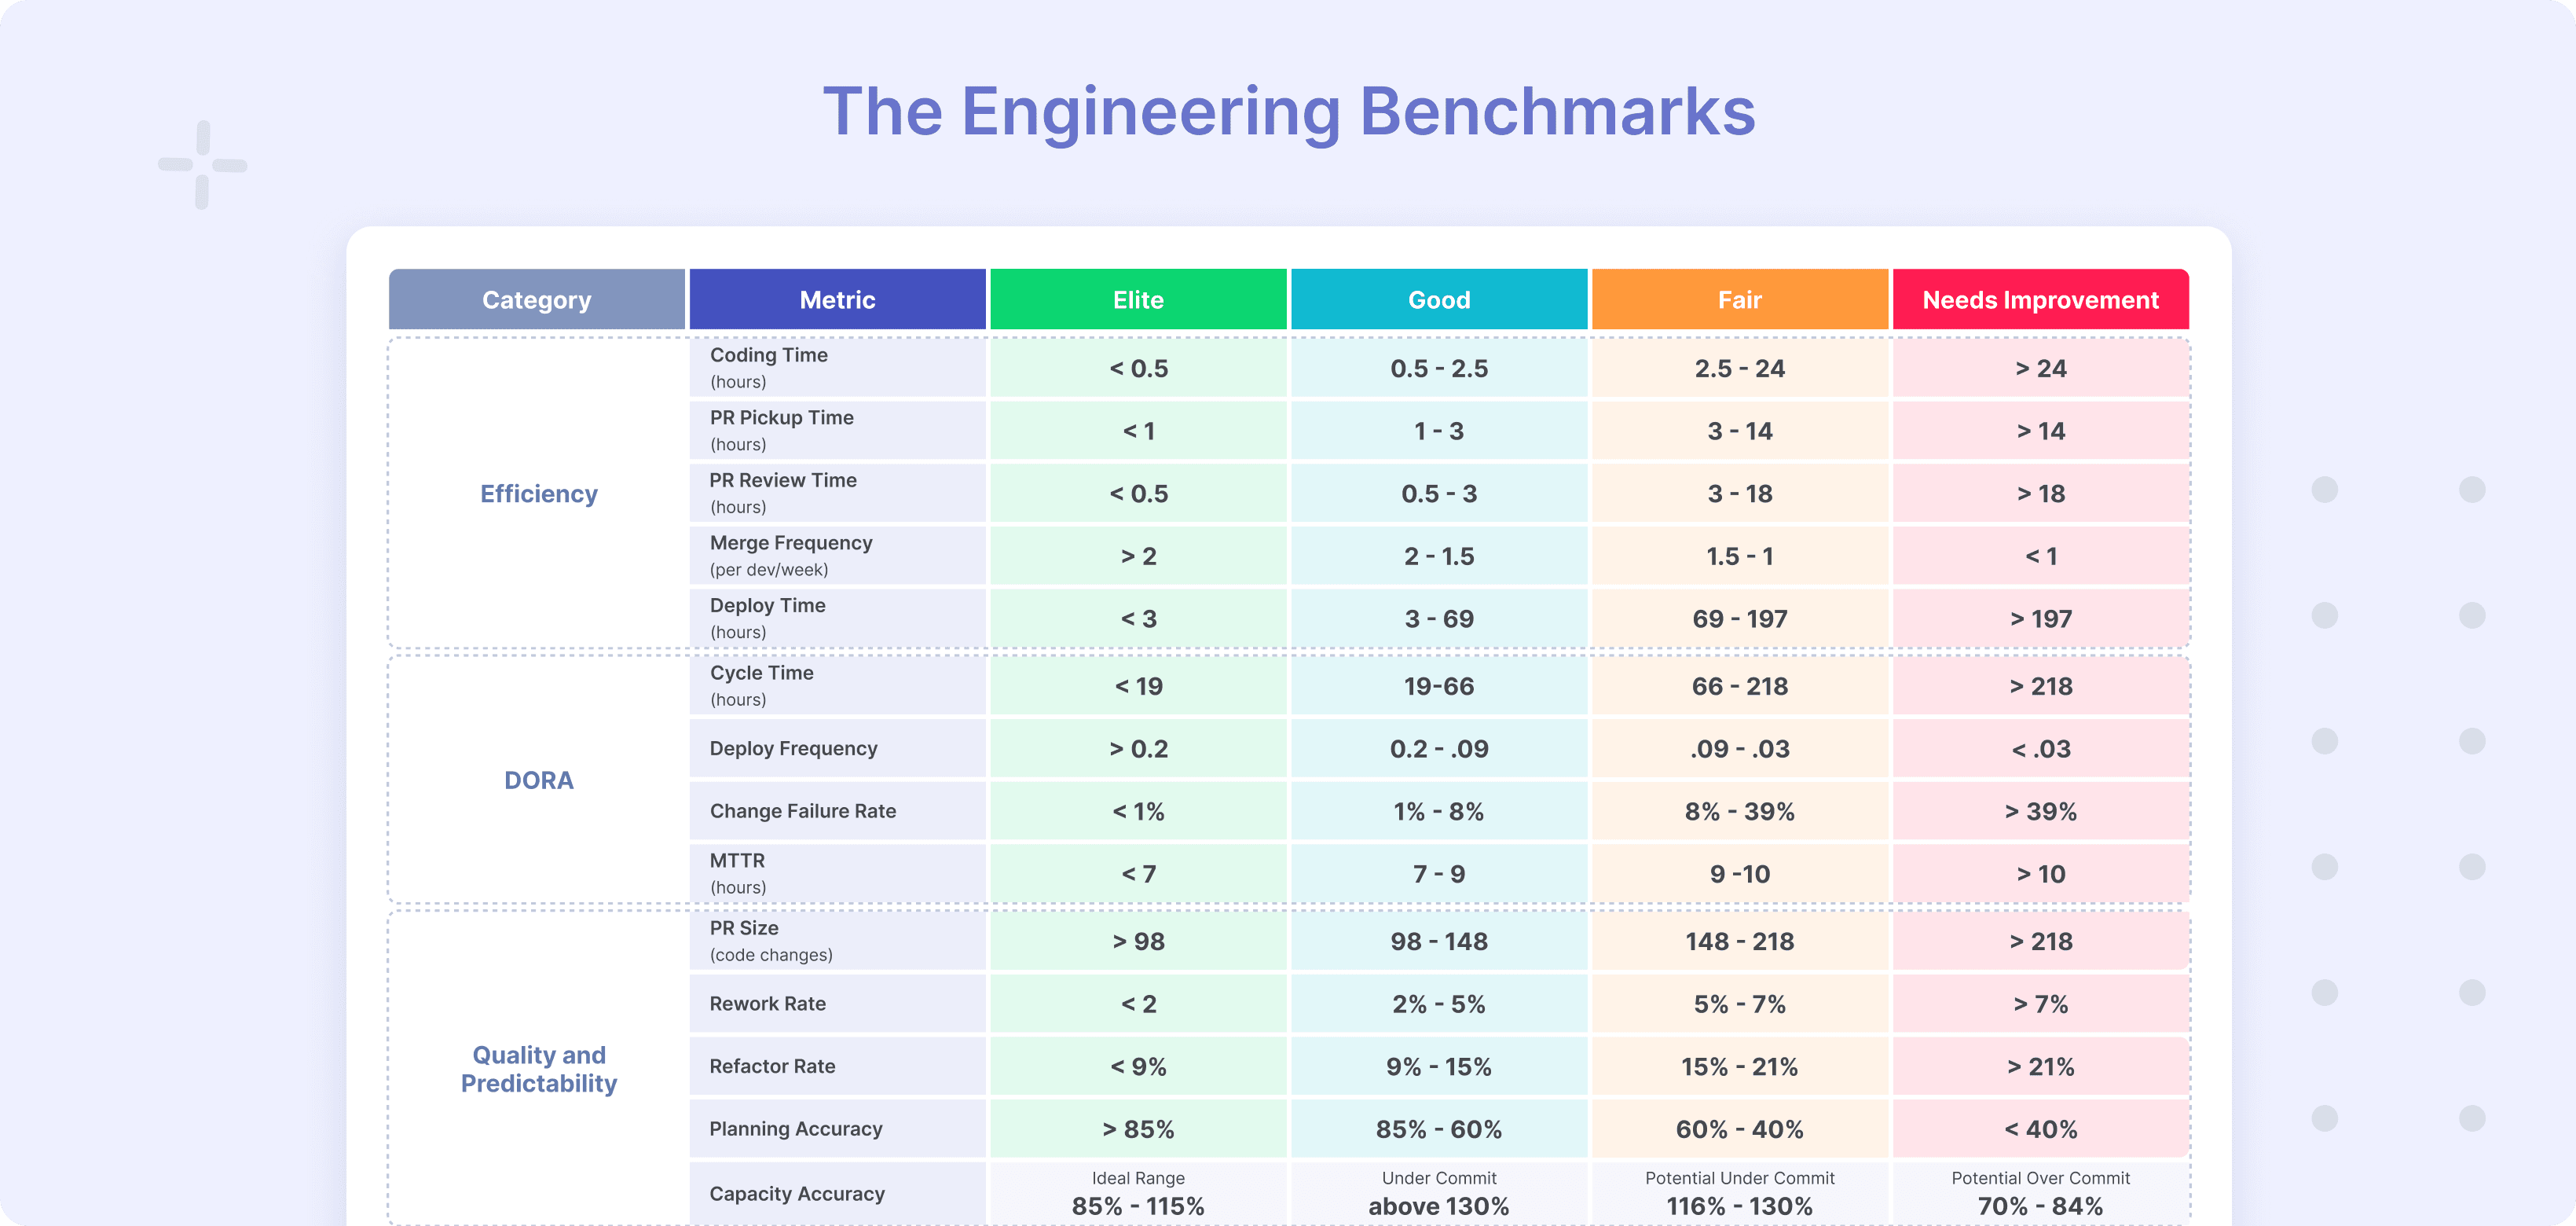
Bottom line: All the metrics and visibility in the world don’t mean much without a baseline. The only way to know is to contextualize your metrics and see what your industry peers are doing using the Engineering Benchmarks.
LinearB analyzed the data from more than 3,600,000+ pull requests (PRs) from over 2022 organizations (and is continuously refining this report) to illustrate what the top performing teams’ metrics are in each of these key areas.
Diagnosing and Reporting Improvement Opportunities
DORA is great…but it’s not perfect. The thing about DORA metrics is that they are lagging indicators and are calculated after code is deployed into production. To really find and address your bottlenecks, you’ll need to look at the leading indicators and benchmark those as well.
Your leading indicators include:
- PR size
- Pickup time
- Review time
- Churn or rework rate
- PRs merged w/out review
Here’s an example of the insights you’ll get after digging into both DORA metrics and leading indicators and contextualizing them with benchmarks: 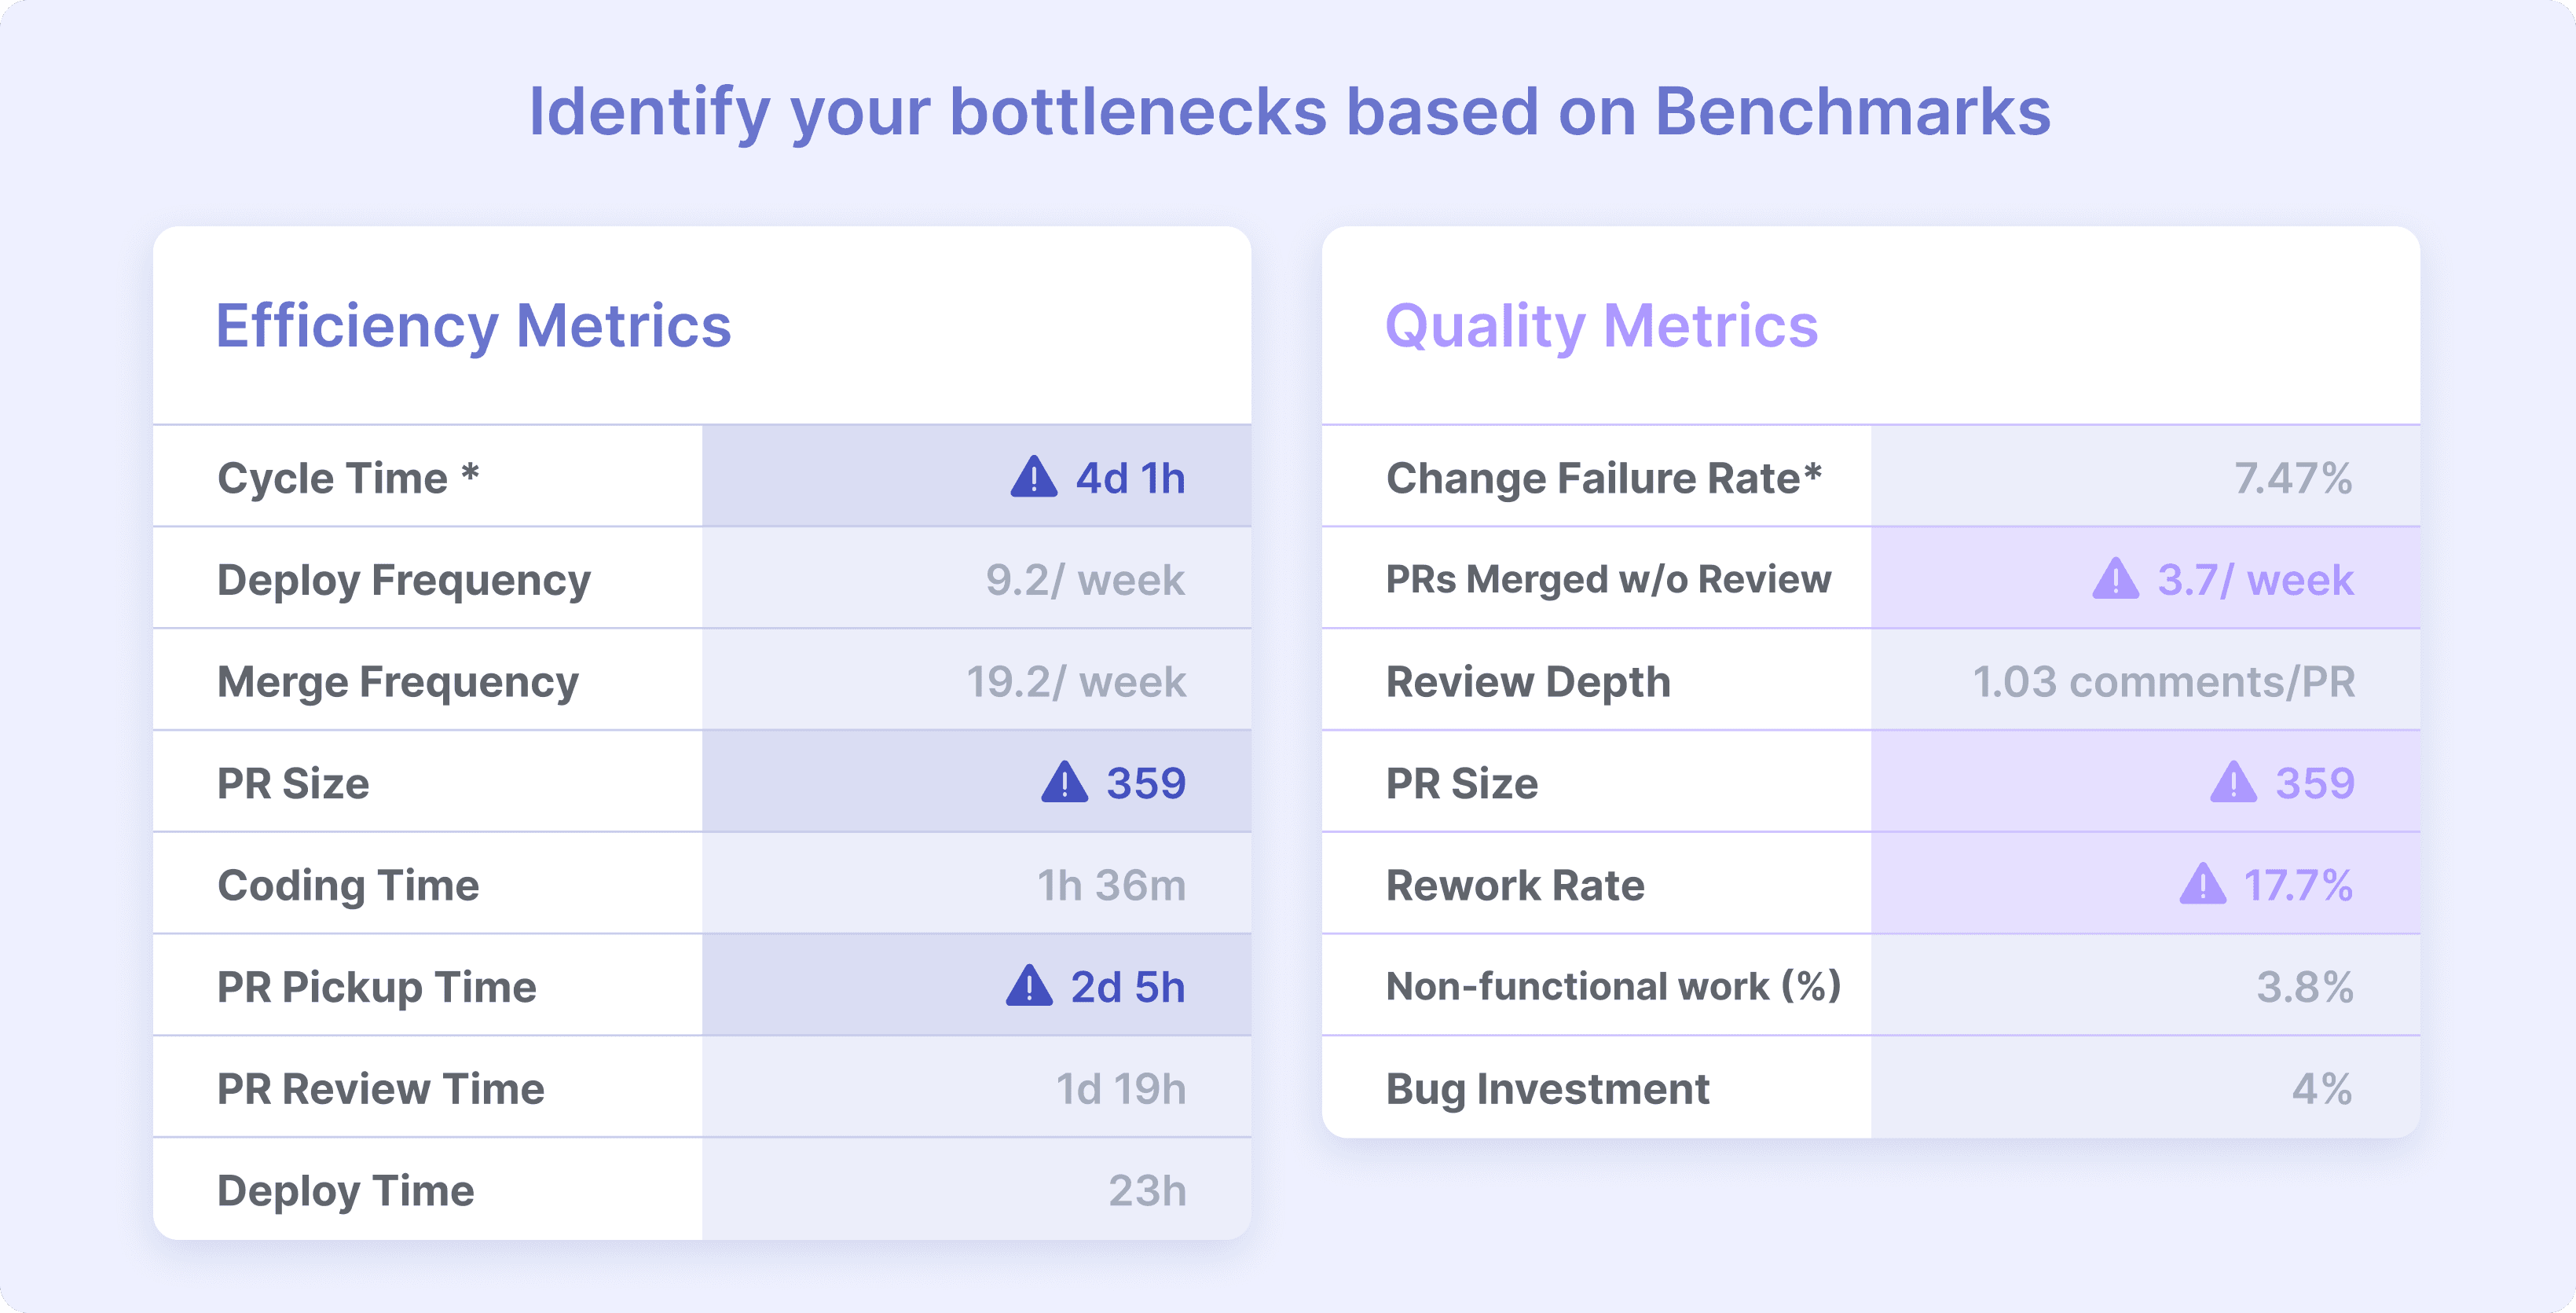
As you can see in this example, there are a few metrics that require some attention. Addressing these metrics will have a downstream effect on both the operational and business side of engineering’s core responsibilities.
For instance, if you address your PRs merged without review, overall quality will improve because potential bugs are more likely to be caught before code makes it to production–where it can impact application performance, uptime, security, and of course, the bottom line.
Once you have all the context with benchmarks and you understand your leading/lagging indicators, start looking for patterns and trends in your data. You’ll then be able to identify your issue(s) by building a dashboard that will serve as your source of truth and help ensure that your team stays focused on the metrics you want to improve.
Building Your Improvement Strategy - The End Game of a Metrics Program
You’ve got visibility into your engineering data sources, you’ve benchmarked your metrics, and now you’ve got a pretty good idea of what you need to improve–now it’s time to segment your data, focus your team on your bottlenecks, and formulate your improvement strategy.
Pro Tip: Take improvement one metric or category at a time (don’t try to change/ do too much all at once)
Hot take: metrics alone don’t improve dev teams. We’ll explore these concepts in much more detail in later guides but successfully improving and sustaining those results comes down to:
- Setting and refining improvement goals
- Keeping your team aligned to those goals with automation (at the very least, anchor regular check-ins around goals)
- Automating as much of the dev process (PR process) as possible with with automation PR policy as-code
Want this guide sent directly to your inbox? Click here and enter your email!
Pinpointing Bottlenecks with Data Segmentation
When building your improvement strategy, you need to make sure these three key aspects are in place:
- Holistic visibility across the SDLC
- Flexibility in how data and teams reporting is structured
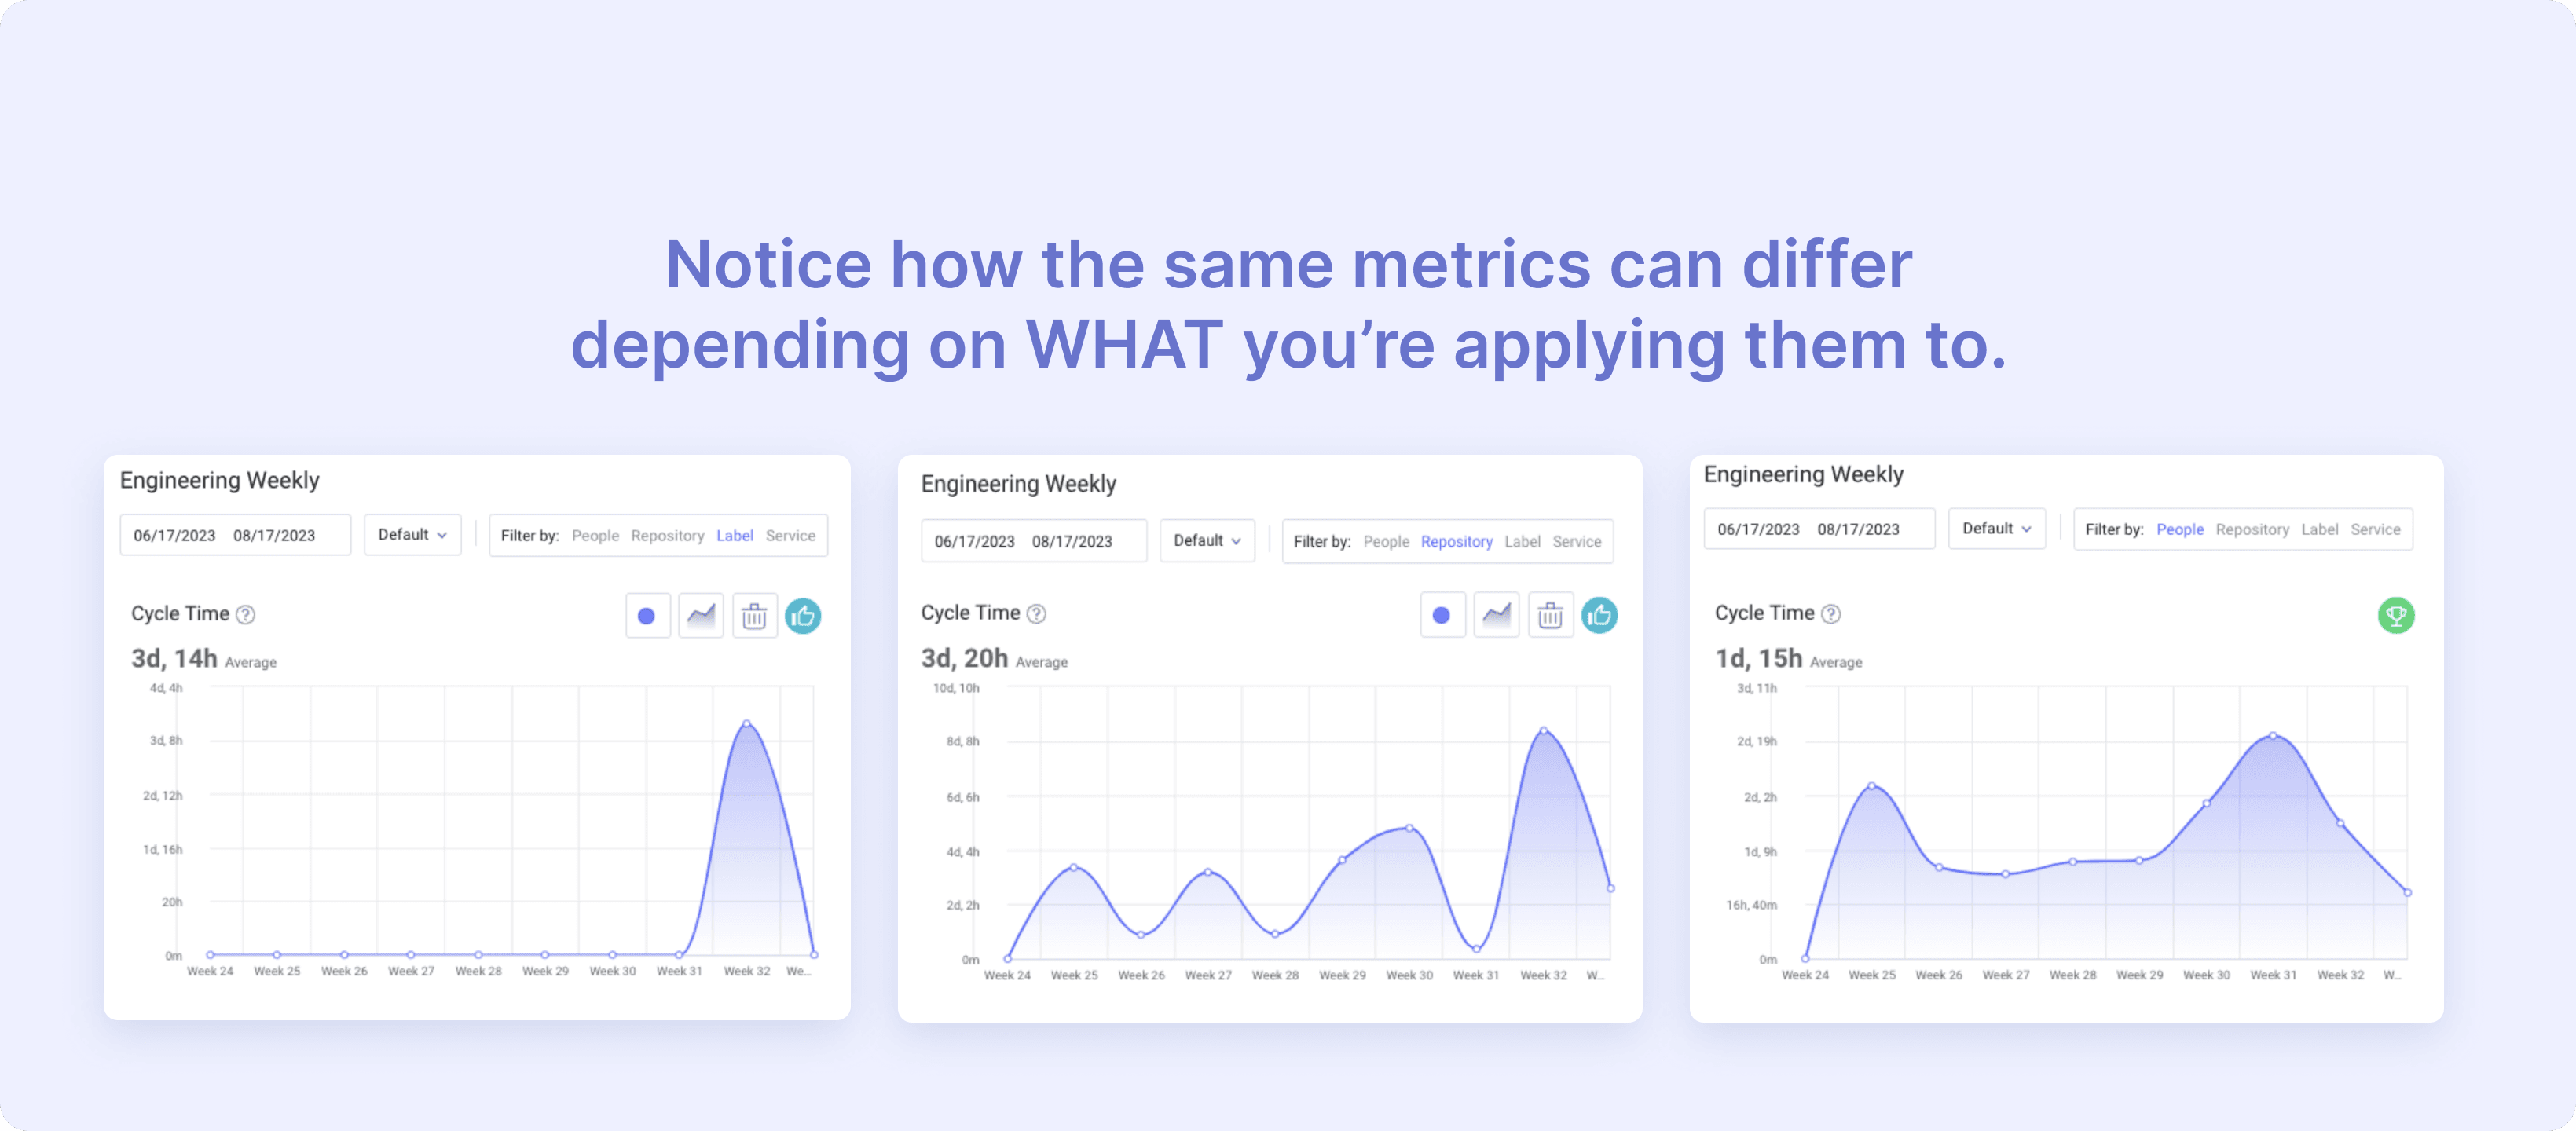
- Specificity in what you’re applying metrics to and attempting to improve
Determining that you have a cycle time issue (or even having visibility into cycle time) through your DORA dashboard is a great milestone. Understanding where that cycle time bottleneck originated should be your next goal.
The ability to segment your data within a SDM platform is incredibly useful for this. We recommend starting by looking at these four data segments:
- Team(s) based bottlenecks
- Repository or specific part of the code base
- A service (multiple branches and repos)
- Custom metrics based on labels and tags
Pro Tip: A great place to start is a dashboard that includes DORA metrics and some of the leading indicators (like PR size and Pickup time). This can be the foundation of your recurring team syncs.
Digging Deeper
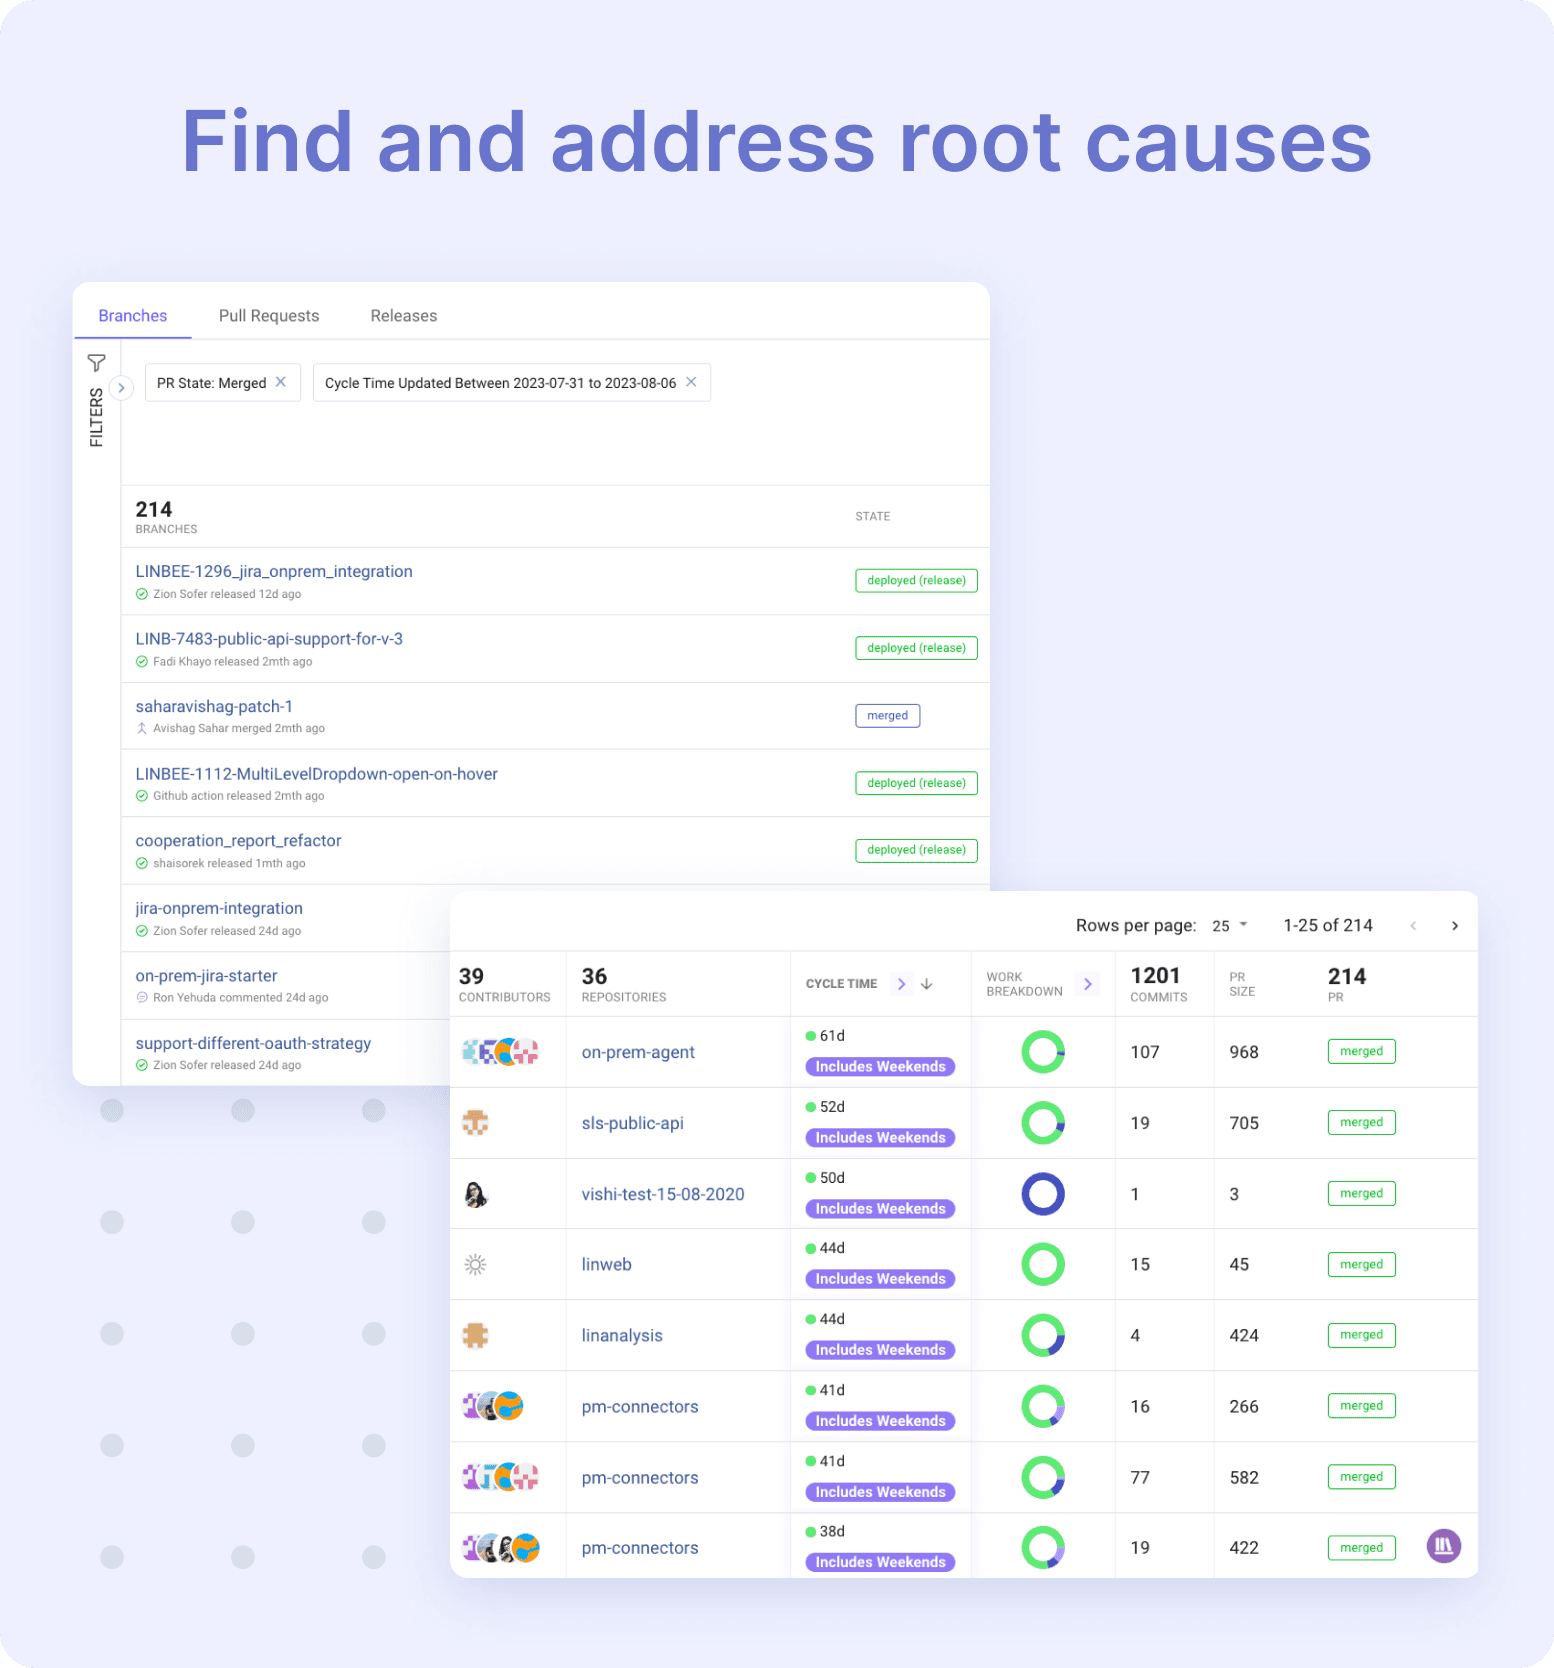
Once your dashboard is in place, double-click into the metrics to see what’s causing identified spikes and slowdowns. Granularity is key to identifying process bottlenecks and uncovering inefficiencies. Some common potential bottlenecks include things like stuck issues, lots of rework, overloaded engineers, and reviews that got overlooked–it happens.
One of the most common root causes of process bottlenecks is pull requests (PRs). More specifically, the PR process–which is widely considered standardized–is fundamentally flawed.
That’s because every PR is treated the same way regardless of content or size, rather than routing PRs appropriately.
The result is unnecessarily high cycle times that slow development down and eventually lead to missing deadlines. Here are some common reasons for why that is:
- Small PRs that can be approved in seconds, take hours, or days to approve because of blind spots or communication breakdowns
- Large PRs take hours or days to review–or worse are just rubber stamped “LGTM” out of frustration which impact quality (leading to further delays)
- PRs issued on Fridays that sit idle for days waiting to be picked up are largely forgotten about by Monday (even by the person who issued it)
- Meetings and competing priorities that split focus, increase idle time, and lead to more PR ping pong
This is the status quo for many teams but they often don’t have visibility into it.
Did you know the ideal PR size is between 10-100 lines of code changes?
Keeping PRs functionality segmented and bitesized is the mark of thoughtful, experienced, high quality dev work. The only way to get there is to shine a light on the problem by analyzing your PRs and all of your other engineering metrics.
This is just one example of a core process that is inefficient by design. It’s only by instituting a robust, holistic metrics program that every opportunity to improve is surfaced.
After you’ve got eyes on all the data, it’s time to set improvement goals.
Winning Strategy for Setting Improvement Goals
After you’ve figured out where your bottlenecks are and carefully considered your priorities, it’s time to make your intentions known. Stating goals is what keeps improvement initiatives on track. Without a goal, how will you know if you’re successful?
To get you started with setting engineering efficiency improvement goals, here are four tips to help ensure you’re starting on the right foot:
Narrow Your Scope
Pick ONE set of metrics (efficiency or quality) to focus improvement efforts on and keep it to 1 or 2 goals per quarter. Trying to do too much at once is a recipe for disaster.
Pro Tip: Tie goals to individual metrics and get specific–ex. “Keep PRs merged without reviews to <1/week across all my teams.”
Keep Selected Metrics Top of Mind
Next, you’ll want to build a custom dashboard or view with the metrics you want to improve. DORA metrics are a great place to start.
Check back on progress often and be proactive–over communicate with your team(s) about what you’re seeing with trends in the data. Remember: MAX 1 or 2 metrics at a time!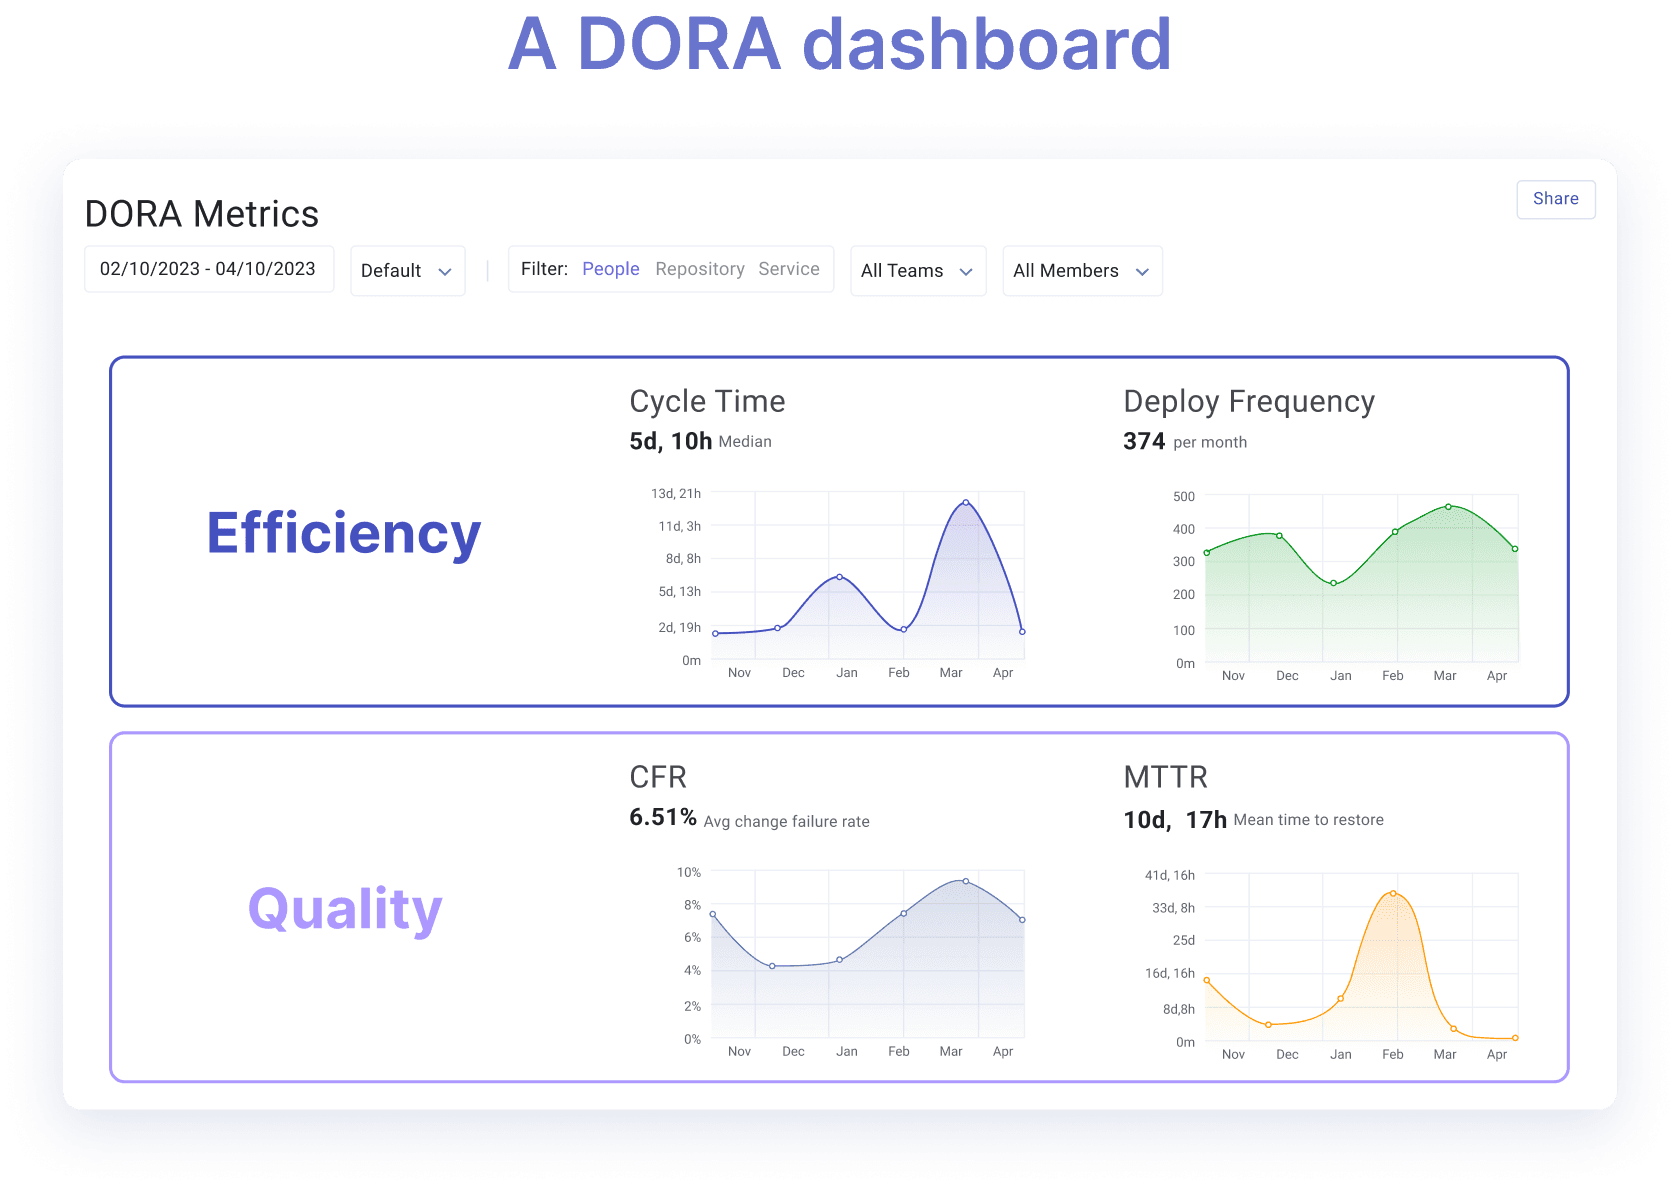
Make sure to include leading indicator metrics for each category on your focused improvement dashboard (rather than ONLY DORA metrics). Why? Here’s a great example of the relationship that’s at play between these metrics:

Set Realistic Improvement Goals
Verify your metrics one last time and then use benchmarks to figure out improvement targets and set your goals. You can use a tiering system or numerical values, just as long as you’re specific and realistic–going from “Needs Focus” to “Elite” or reducing cycle time 50% in 45 days is unlikely to happen.
Using Engineering Benchmarks tiers and data, a good goal would be to move your selected metrics (again 1 or 2 MAX!) up to the next tier within a quarter.
Remember goals should be specific and realistic.
Time Box Goals and Report Often
Last but not least, set a time interval for attaining these goals. We suggest a 90-day timeline to grade success.
Pro Tip: These goals make excellent data-backed quarterly OKRs and success metrics that you can report to your executive leadership.
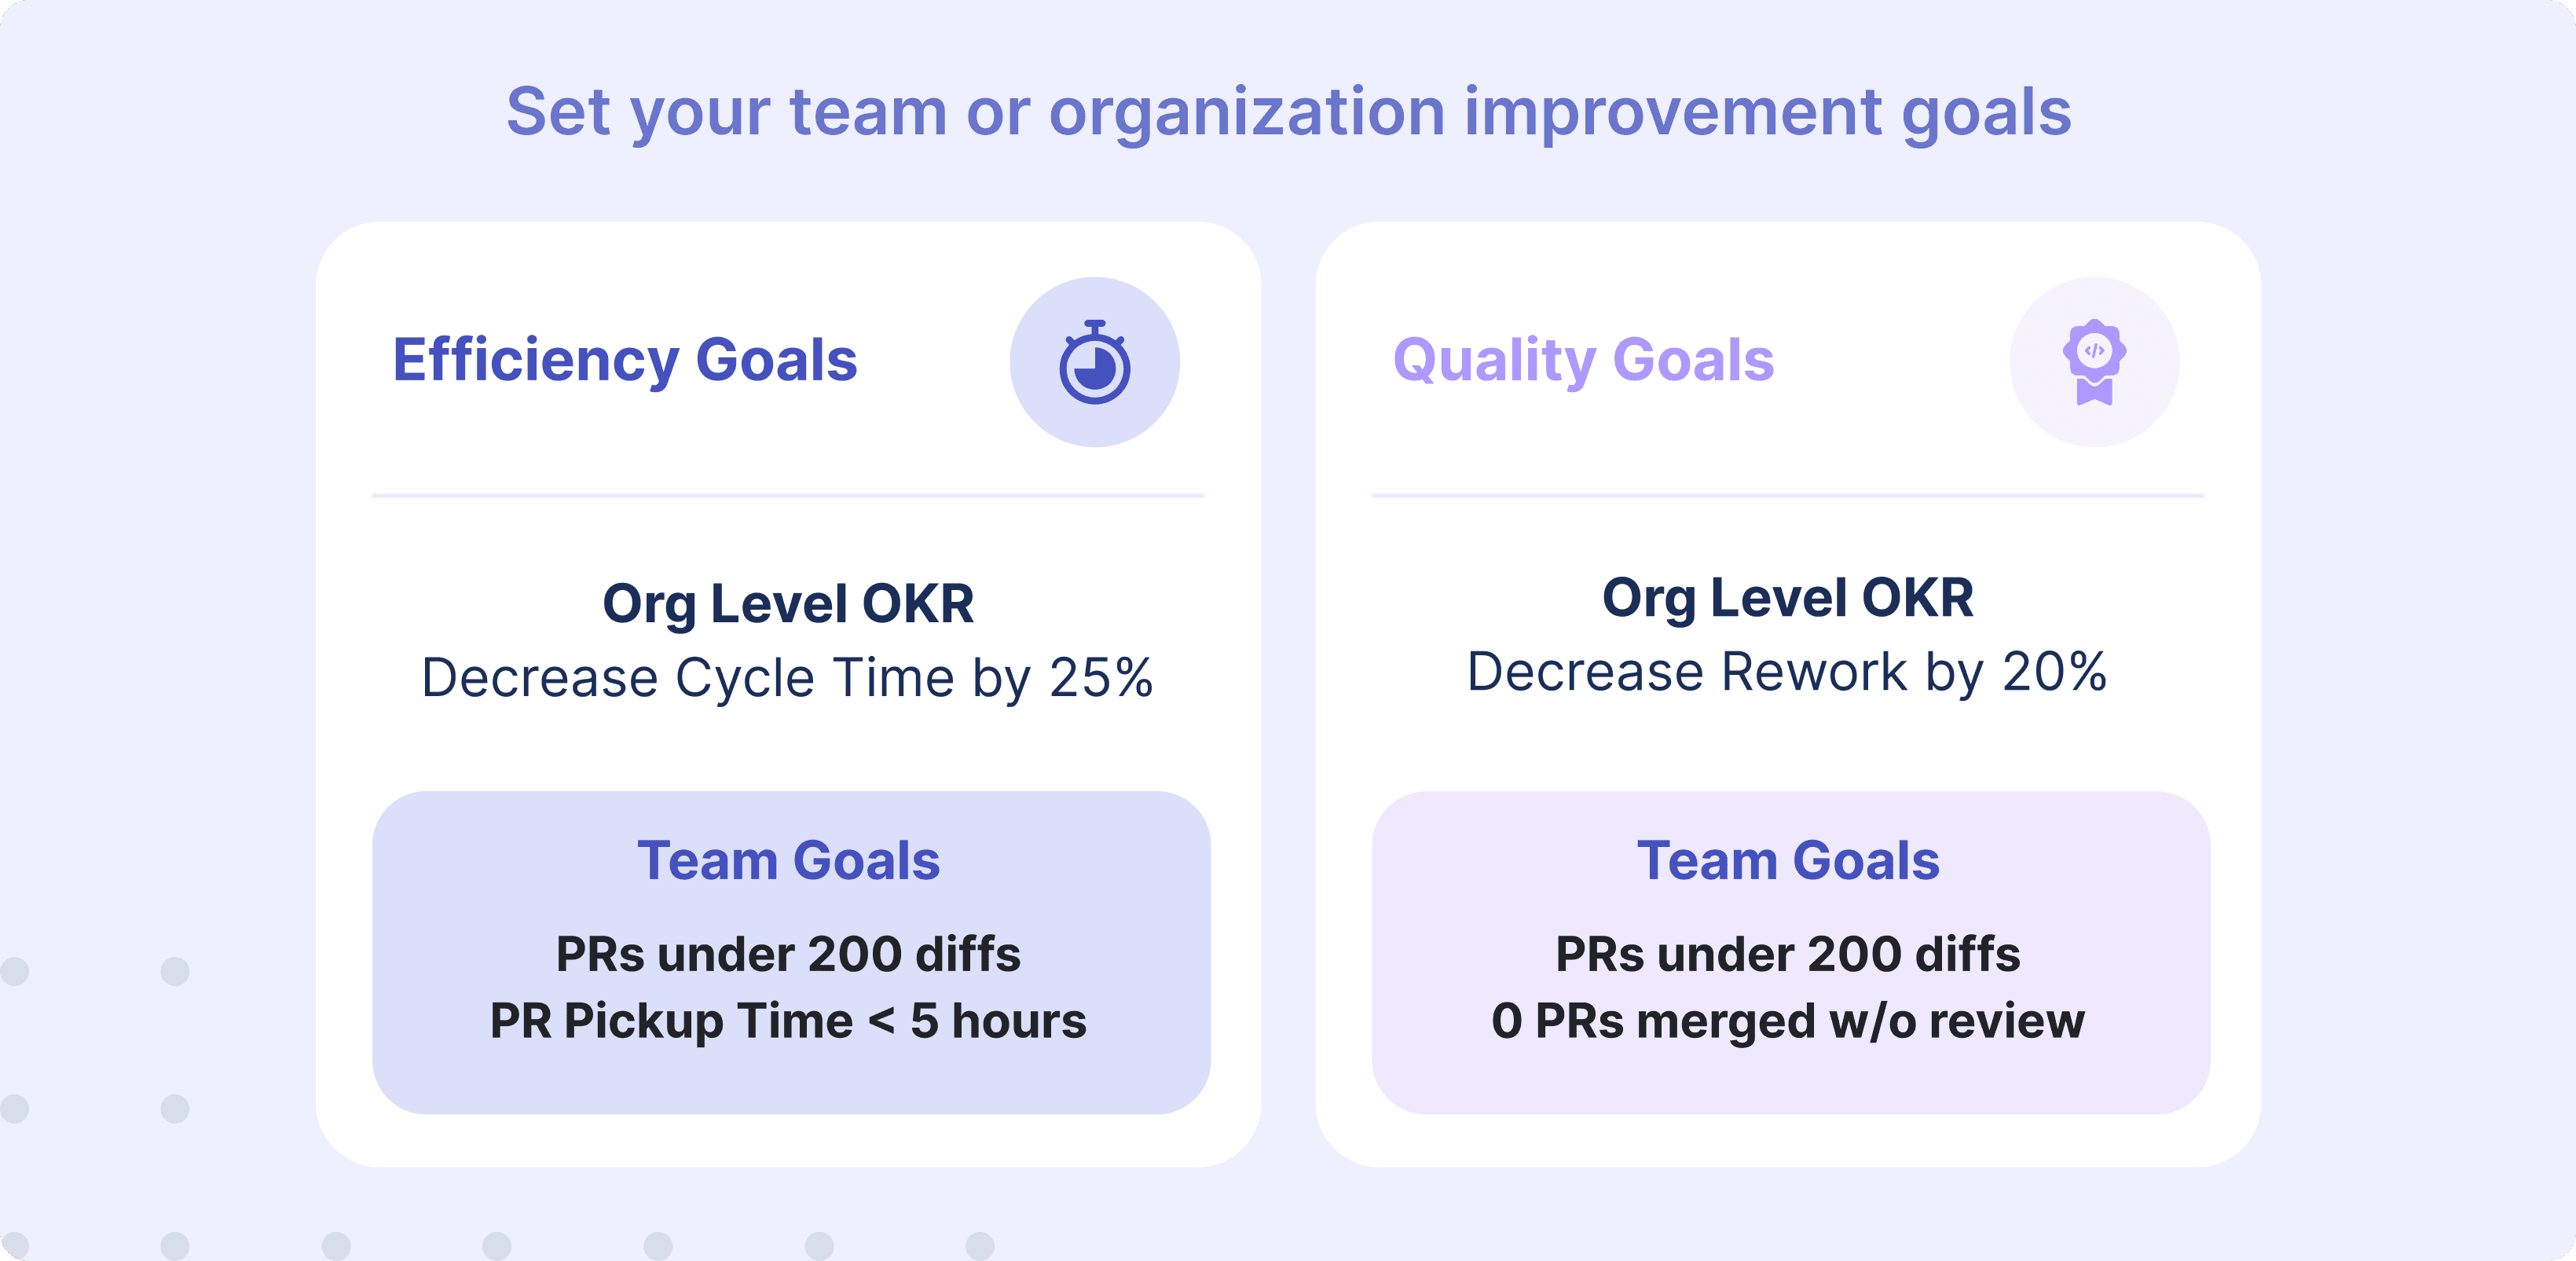
Check in often, be proactive in surfacing identified blockers with your team, and report this data with all stakeholders on a regular cadence. Remember that transparency and communication are how to ensure success with engineering metrics programs.
Congratulations! You’ve just built your first engineering metrics program and are well on your way to operational excellence and better business outcomes!
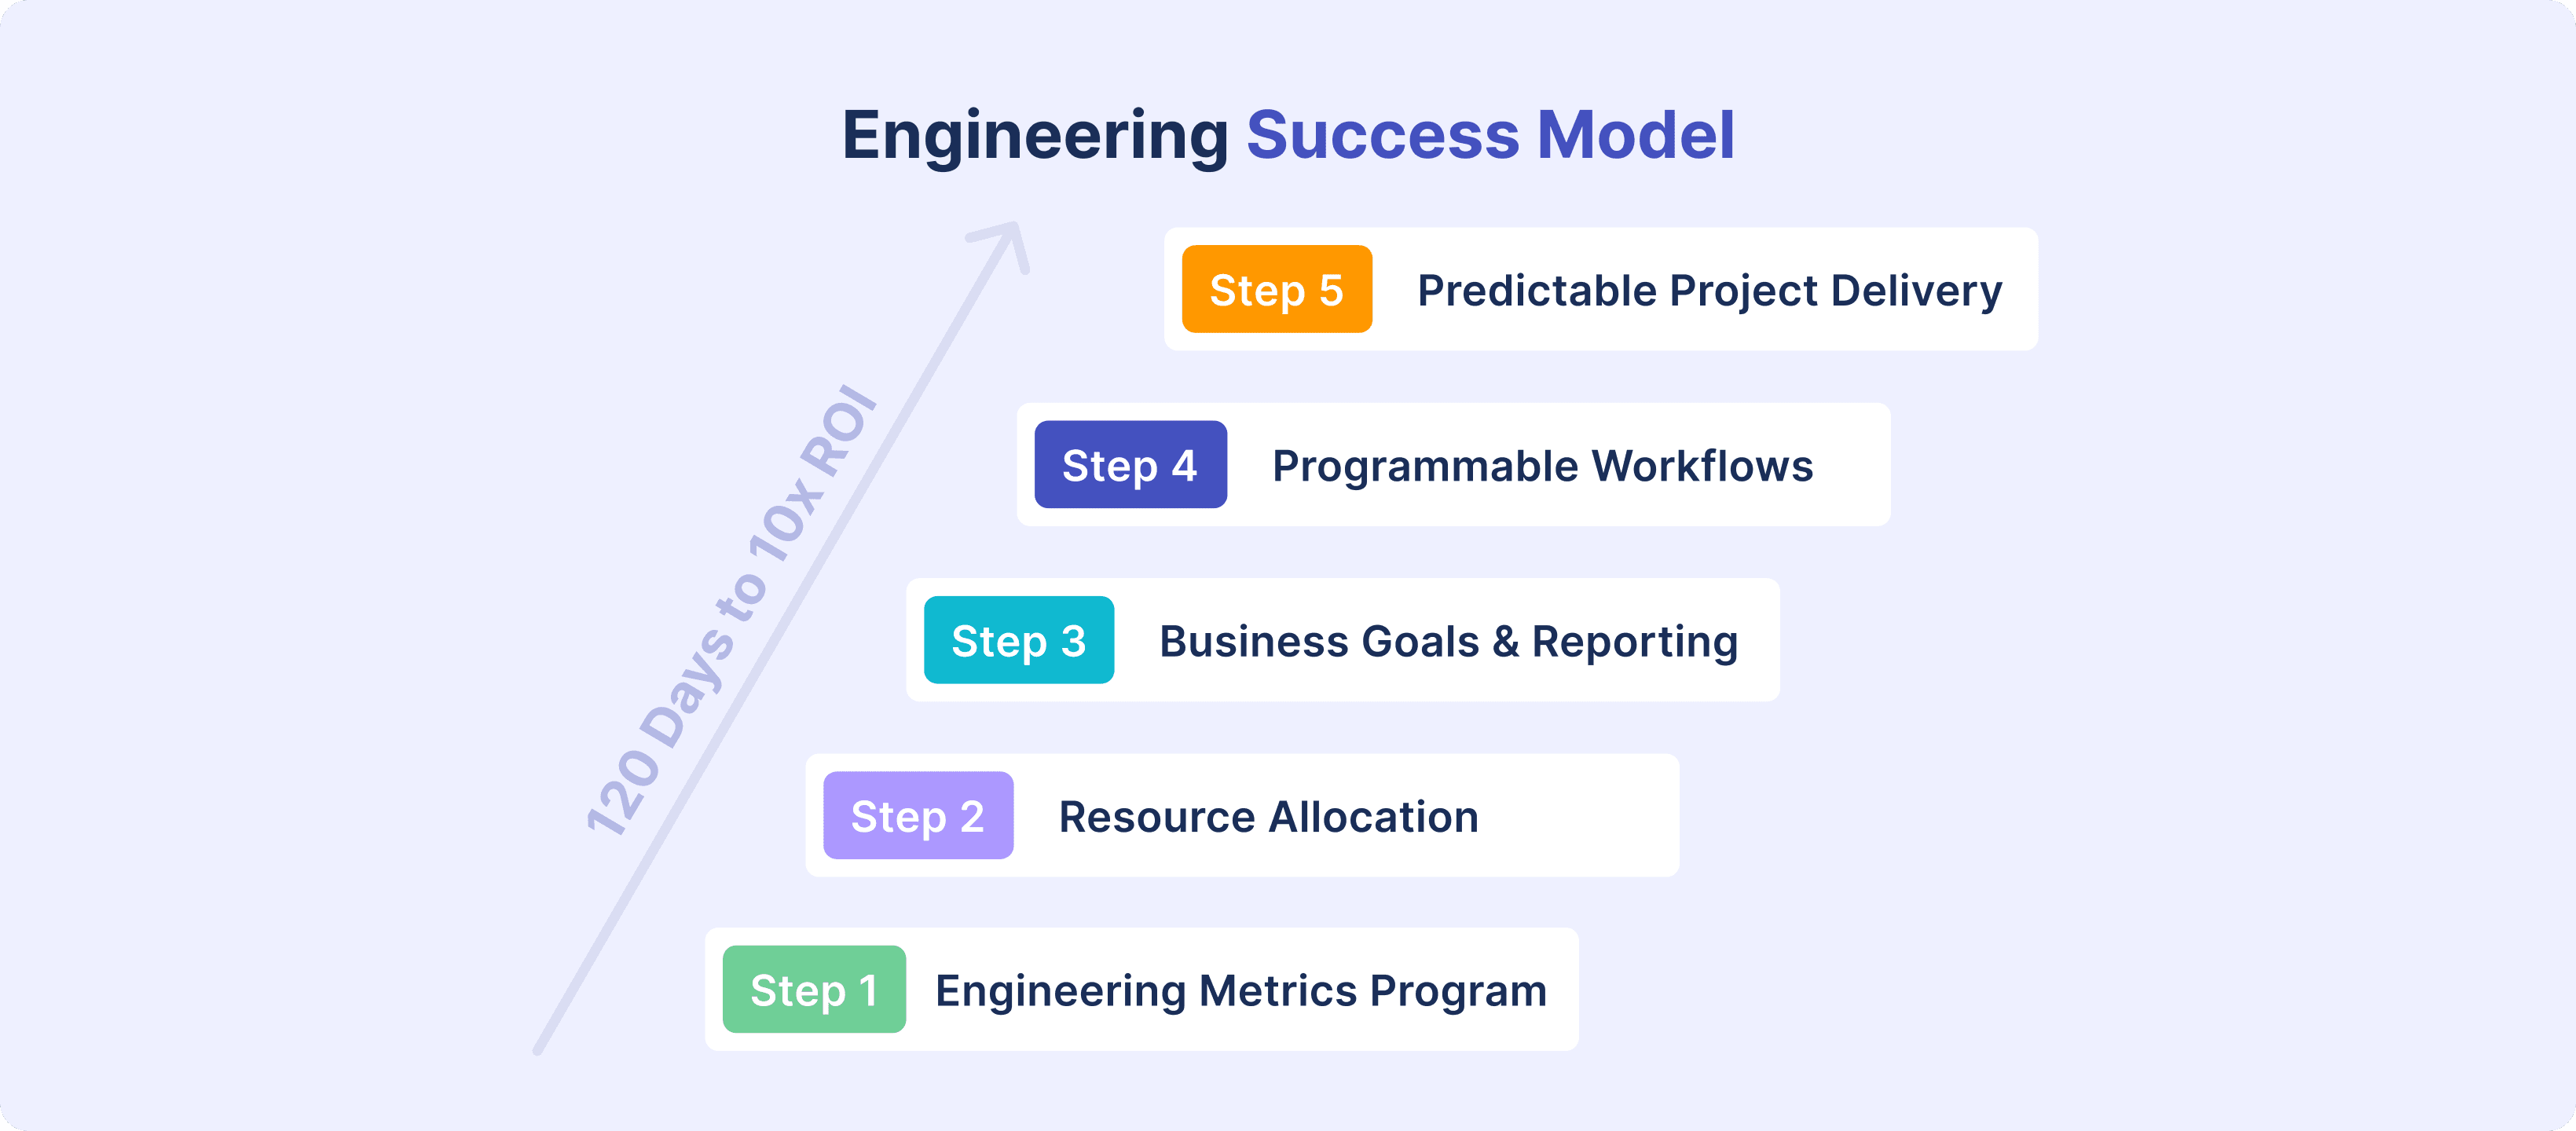
Be sure to check out the next installment in this series where we'll explore how to add resource allocation visibility into your metrics program and align engineering initiatives to business outcomes.

