

Software leaders ahead of the curve are using data analytics to create an optimal development environment for their teams. The revolution is happening. If you are not yet improving your team by utilizing data, then you are falling behind.
Side Note: if you ain’t first, you’re last…
Using data analytics for productivity improvement is now possible for any software team. At Linear B, we are doing our part in the data-driven revolution by providing a set of foundational metrics for software leaders who are looking to improve their organization.
In a previous post, I covered our measurement philosophy and initial offering. At that time, the metric set was mostly focused on development and PR-related insights. No doubt, a nice start, but our customers have asked for more and we have delivered.
We have now added project management related metrics (think stories, bugs) in combination with our development related metrics (think code, PR lifecycle). The result, a holistic view of the software delivery pipeline allowing for next-level insights, is awesome.
Onto the good stuff! Below are a few “must have” metrics essential for any software leader responsible for a team.
Bottleneck Detection in Delivery Pipelines
Elite software teams efficiently deliver continuous value to production. The best way to improve your delivery pipeline is by measuring each stage, identifying the bottleneck, and improving efficiency. The more stages you can measure, the more you can improve.
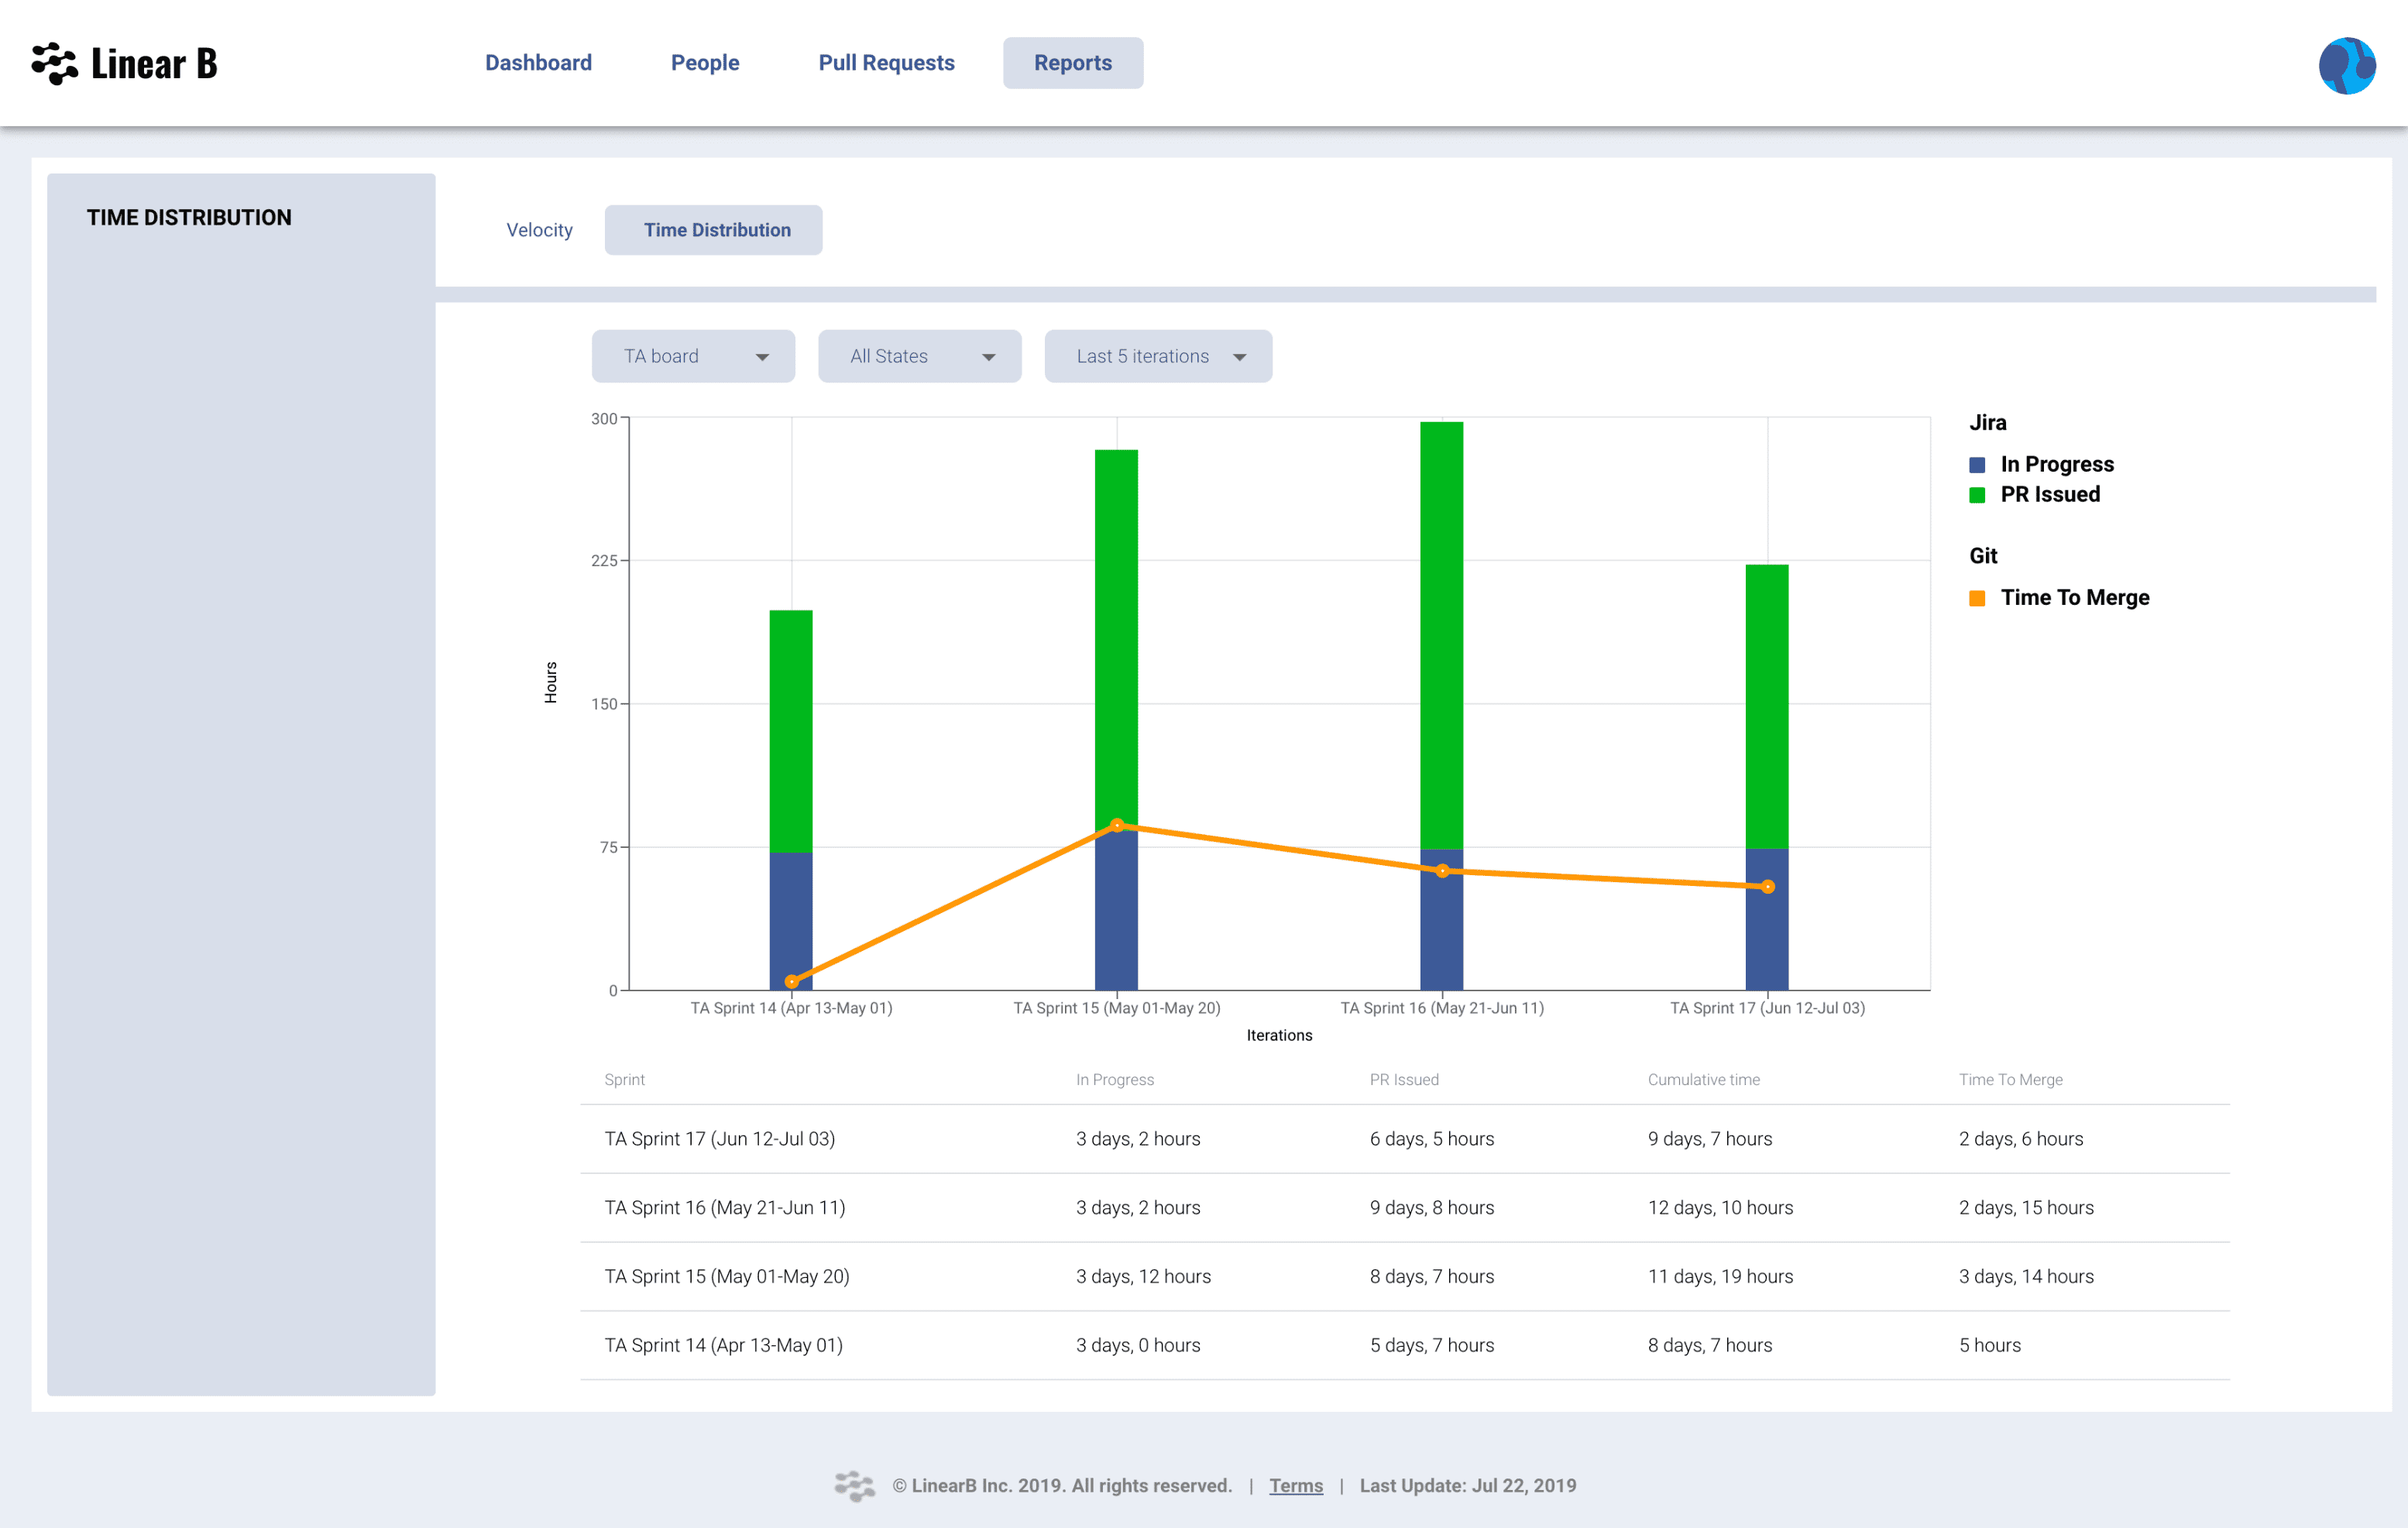
In the view above, we have overlaid project stages and the pull request lifecycle. Powerful stuff!
Here are the types of questions Linear B’s platform answers:
- How much time does it take from PR open to PR merge?
- How much time does it take from PR open to first feedback?
- How much time are we spending in planning?
- How much time are we spending in development?
- How much time are we spending in review?
Side note: We have seen from our customer base that once you start measuring, your team’s issue hygiene will naturally improve. It’s human nature to take care of things that are measured.
In addition to understanding your stage time distribution, you can also visualize trends from iteration to iteration. You now have the ability to increase your team’s throughput by identifying bottlenecks, taking action, and measuring the results over time.
Investment Profile and Value Ratio
As a software leader, it is mandatory to understand and convey where your team is investing effort. The most precious and expensive resource you have is your people’s time.
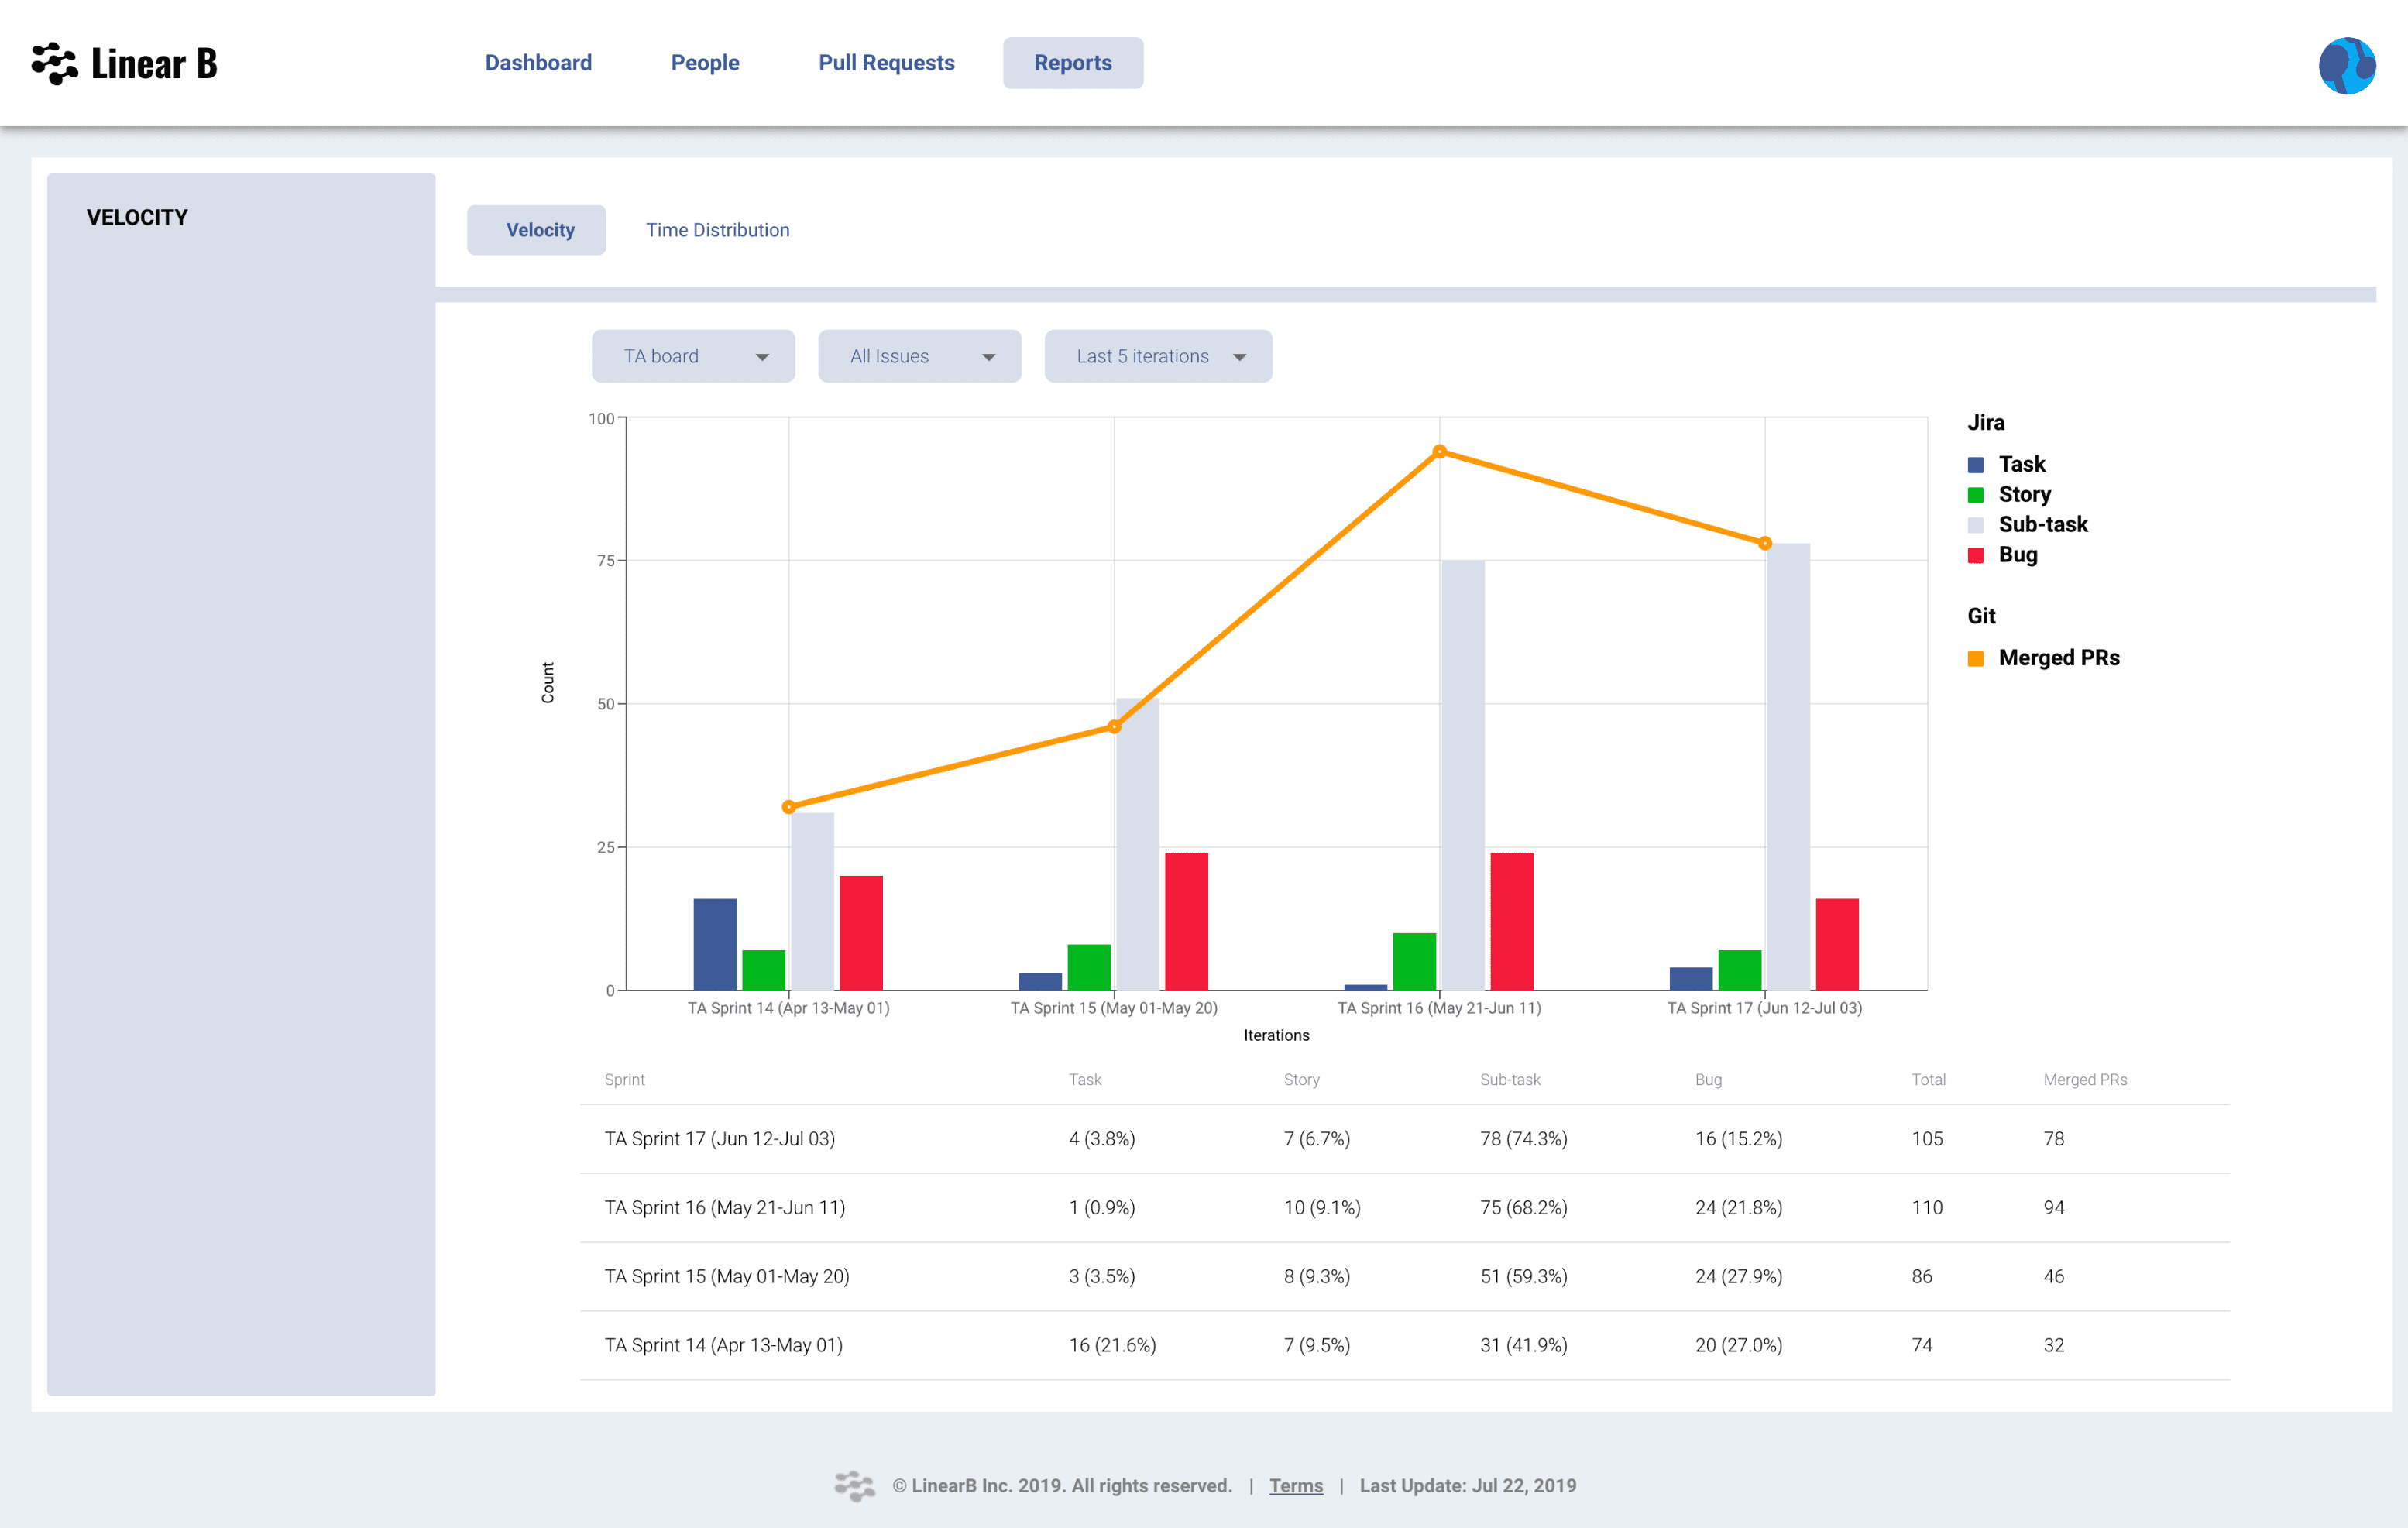
The screenshot above shows a team’s investment profile across the last few iterations.
I want to point out three important aspects you can discern from the investment profile view:
1) What percentage of our effort is going into Stories (value) vs. Bugs?
2) How does the volume of our work (Merged PRs) correlate to our Bug rate?
3) How have we been trending from iteration to iteration?
This is the type of stuff you have to understand as a leader in order to guide your organization, communicate with executives, and make decisions that lead to value delivery improvement.
At Linear B, we check all of these boxes and have defined a foundational metric set that is game-changing for software leaders. The combination of project management insights with development insights has allowed us to push the envelope of what the data revolution has to offer. New metrics and insights are being released all the time.
If you are responsible for a software development team, you need to Try Linear B!


