

Think about how weird the following situation is. We, as a software community, are obsessed with data, analytics, and measuring stuff (think IOPS). Yet, we are totally behind the times when it comes to measuring ourselves in order to improve our own productivity. Even more surprisingly, there are non-technical teams such as Sales, HR, Marketing, etc. who are way ahead of us in using data to improve their productivity.
Enough is enough. This cannot stand! It is time to improve….
New information has come to light. Measuring productivity for continuous improvement in software organizations is 100% possible. We are doing it every day at Linear B. The thing is, it’s not easy and can by no means be done with a single metric like “lines of code produced.”
Side note: Sometimes, I pitch Linear B to someone and they say, “this sounds really cool, but you’re not just measuring lines of code right?” The reactions inside my head sound like, “What? This question is offensive! …Calm down. Ok, tell them how we measure. Let Me Blow Your Mind.”
Since there are many dimensions to “productivity” in software development, LinearB has created a foundational three-part methodology, which covers Quality/Value, Activity/Throughput and Teamwork/Social.
To understand how this works, read on for more details and examples. Let’s get it!
Part I: Quality / Value
Without quality, everything you do is detrimental to sustained productivity and can be worse than actually doing nothing. A question software engineering leaders have to ask themselves is, “Is the stuff we are producing high quality, valuable to customers, and helping our delivery rate long term?” So, how do we get data-driven insights to answer that question?
LinearB measures quality in a few ways. One example of this is a metric called Code Longevity. If you’re familiar with the sports analytics world, Code Longevity would be considered an “advanced stat.”
Side Note: Professional sports organizations that adopt a data-driven approach tend to win more games. Check out the Chicago Blackhawk’s success…3 recent Stanley Cups…dope!
Code Longevity: Percent of code that remains in the codebase for a substantial period of time.
This is an excellent indicator of quality. Codebases that have a high longevity rate also tend to have a higher productivity rate. Here is why:
- Your codebase has a low churn rate. When you have a low churn rate, you are not rewriting the same code over and over again, which is a productivity killer.
- There is probably a sufficient testing strategy in place. It is likely automated enough that you are catching issues prior to “production ready” submissions.
- The product owner is on point. They are providing a stable value stream and not switching things up on the fly.
In addition to Code Longevity, LinearB uses many other measurements to give a holistic picture of Quality/Value. However, this only speaks to a part of a software engineering organization’s productivity.
Part II: Activity / Throughput
The next area we feel it is important to focus on is the rate of output produced. The question asked by leaders in this category is, “How much stuff are we producing, what type of stuff, and at what efficiency rate?”
Consider the following. If your team is producing zero stuff, then there is no way you’re delivering on your projects. If your team is producing 1,000,000 stuffs with high quality, then there is a good chance (although not guaranteed) you’re delivering on your projects. This quick thought experiment shows that activity and throughput rate are important to measure and understand.
Side note: When I’m in a situation where the best path forward is not obvious, I try to use thought visualizations to get a glimpse of what things may look like at each end of the possible extremes. (Einstein’s thought experiments style, because I like space/time stuff)
Output from software organizations comes in many forms such as commits, PR reviews, story creation, and documentation. These are volume metrics, and yes, we measure these output types at LinearB.
There is also a family of metrics that focuses on throughput. This set of metrics tells a lifecycle story about time to value. Throughput metrics measure value phases like time from idea generation to story creation, story creation to pull request open, pull request open to merge, and merge to production release. Throughput metrics are important because they bring to light the bottlenecks, efficiency to be gained, and work methodology. Let’s zoom in on one specific throughput metric.
PR Time to Merge: The time from pull request open to merge.
PR Time to Merge is an excellent Activity/Throughput metric. Software organizations that have a good PR Time to Merge rate also tend to have a higher productivity rate. Here is why:
- It speaks to your value delivery system. The faster value is able to stream through your delivery system, the better.
- Your teamwork and review process have to be solid. Open PR’s degrade over time. You want to have a review process that addresses open PR’s as quickly as possible and this requires teamwork.
- If “reviewing” a PR takes a lot of manual effort, your time to merge is going to be high. When you have automated checks running, you’re likely to have a lower Time to Merge rate.
It is easy to see how measuring Quality/Value and Activity/Throughput can provide insightful details about productivity. However, there is still a huge piece of the overall picture missing.
Part III: Social / Teamwork
The final piece to our three-part methodology is all about the people. As we should all know by now, software development is a team sport, and people are the most important asset we have! Elite organizations optimize the productivity of their people by measuring things like morale, burnout rate, collaboration, knowledge share, and communication paths.
Leaders need to constantly ask themselves, “How are my people doing, how are we interacting, and how are we working together as a team?”
At LinearB, we feel there is nothing more important than the people. Therefore, we have a multitude of measurements in this category. A couple of examples are Pull Request Review Rate per person (team impact metric) and Connected Factor which quantifies the amount of interaction between teammates. These Social/Teamwork metrics have a huge impact on productivity. One, in particular, called Sentiment is detailed below.
Sentiment: The level of positivity or negativity expressed by people within your organization.
Side note: A common reaction I get when discussing Sentiment analysis with software leaders is, “This is awesome, but can you really measure our Sentiment level?”. Yes, there are a lot of super smart PHD’s that have been analyzing language patterns for decades, and, at LinearB, we enhance the ability to measure this by integrating into multiple sensors such as Slack.
Sentiment analysis is important when it comes to understanding your team and people. Software organizations that have a positive Sentiment tend to have a higher productivity rate. Here is why:
- Have you ever worked on a team where things are clicking? Ideas and creativity are flowing, and there is an inherent positive energy. This type of team tends to deliver higher quality output at a faster rate.
- Have you ever worked on a team where things are not clicking? It’s terrible. The quality is often poor and the delivery of value often never occurs.
- Teams with positive sentiment are more likely to remain together. On the flip side, one way to destroy productivity is to have unhappy people on your team long term or to lose your unhappy top talent to other opportunities.
We take our metrics seriously at LinearB, and we are continuously improving and innovating as we correlate more productivity insights.
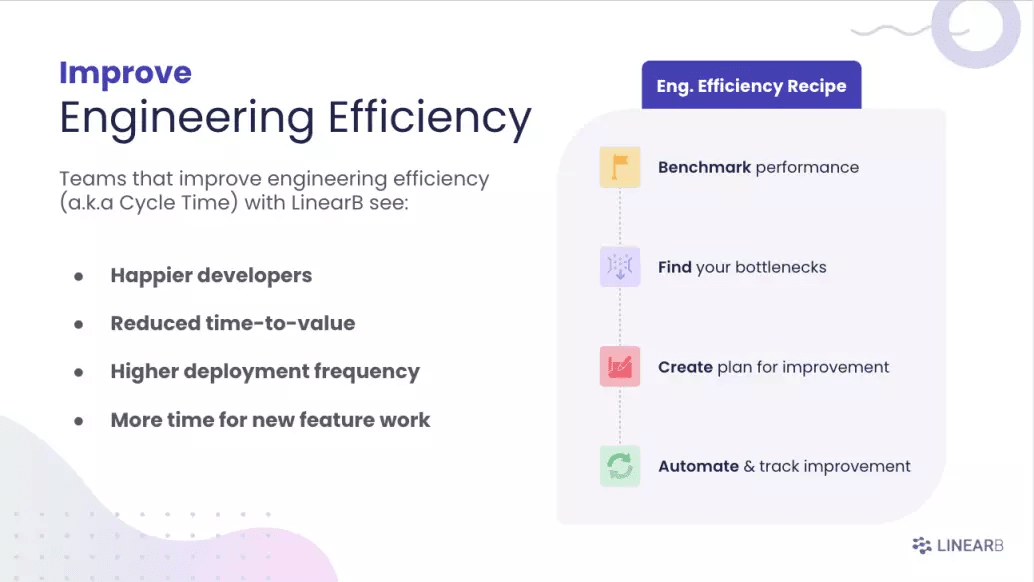 We know that improving engineering efficiency is important. Learn more about our four-step recipe for improvement.


