
One of the hardest parts of overseeing an engineering organization is measuring and working to improve developer productivity. Ask any developer how they feel about initiatives to accelerate productivity, and you’re likely to hear a pretty common answer. “Development work is a creative process that can’t really be measured or quantified.” Sound familiar?
It’s true, the nature of the job makes it tough to see what your software development teams are struggling with–like overly rigid PR review policies. However, dismissing any attempt to benchmark developer productivity or implement strategies to improve productivity isn’t the right approach.
Some companies and leaders focus on output metrics like lines of code to stack rank devs, rather than gaining visibility into the process–*cough cough* Elon Musk. This approach is great...for killing productivity, diminishing motivation, and creating a bad habit of gaming outputs (often at the cost of code quality).
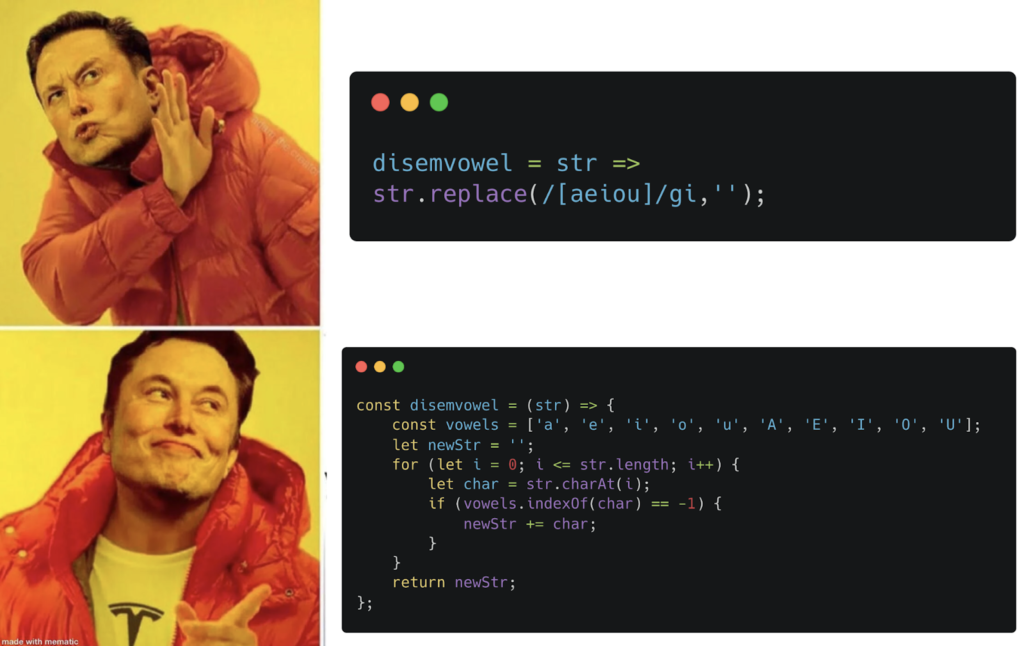
Despite Elon’s opinions, more lines of code is not necessarily better
Source: i.redd.it/
The solution is to track the appropriate software developer productivity metrics and ensure you’re measuring them correctly. The Engineering Leader’s Guide to Accelerating Developer Productivity covers this topic in detail.
In this blog we’ll explore productivity metrics, how to use them to affect change, and how to gain visibility into the impact of your improvement initiative.
What Are Developer Productivity Metrics?
Developer productivity is a multi-faceted concept that encompasses three key areas: efficiency, effectiveness, and experience. Each of these aspects contributes to a developer’s overall ability to produce high-quality work in alignment with business goals while maintaining a healthy work-life balance and continuous growth. These metrics monitor your teams’ software development lifecycle and enable you and your managers to spot bottlenecks in your development cycles, know what your teams are working on at all times, and improve your development processes.
Why Tracking Developer Productivity Matters
Even Musk–misguided as he is–recognizes the relevance of metrics (even if he’s using the wrong ones).
Every engineering leader, at some point in their career, has been asked to figure out how to do more with the same (or a smaller) team. Measuring developer productivity helps you accomplish this in two ways:
- Providing crucial visibility that spurs data-driven decision-making
- Gaining the context needed to have tough conversations with other leaders about prioritization
So let’s look at the right metrics that will help you improve developer productivity (without asking your teams to type faster) and shape conversations in the boardroom.
21 Developer Productivity Metrics You Should Track
As mentioned above, developer productivity is a matter of optimizing efficiency, experience, and effectiveness. In the following sections, we’ll cover the metrics that tell the “three Es” story and outline the process of using these metrics to actually improve.
And if you’re saying to yourself “I thought DORA metrics painted the productivity picture,” don’t worry. All four DORA metrics are in the list below.
Efficiency Metrics
Efficiency in development refers to the ability to complete tasks quickly and with minimal waste. This includes:
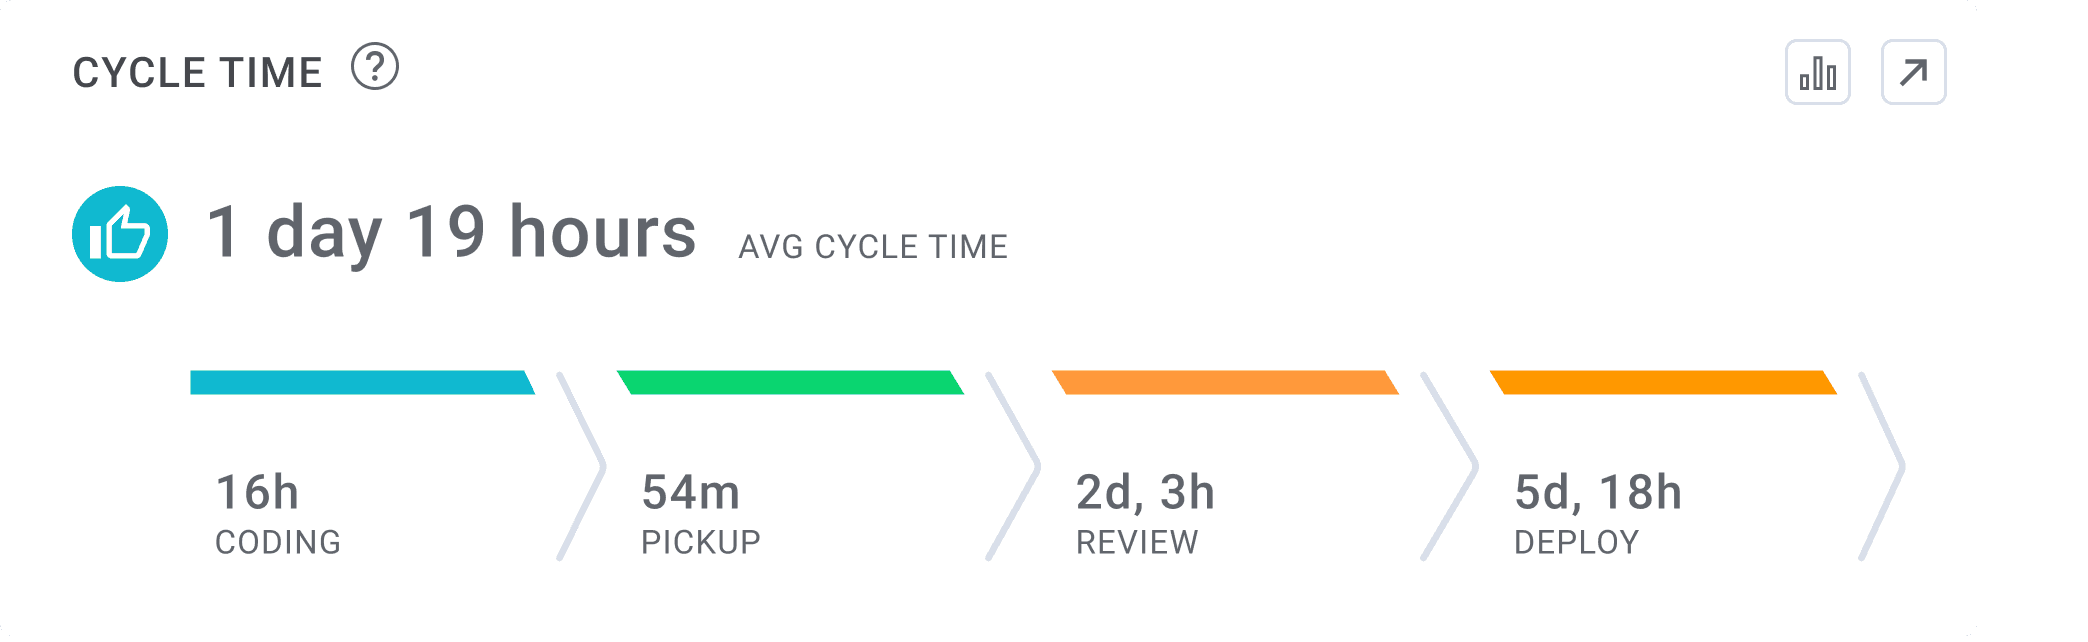
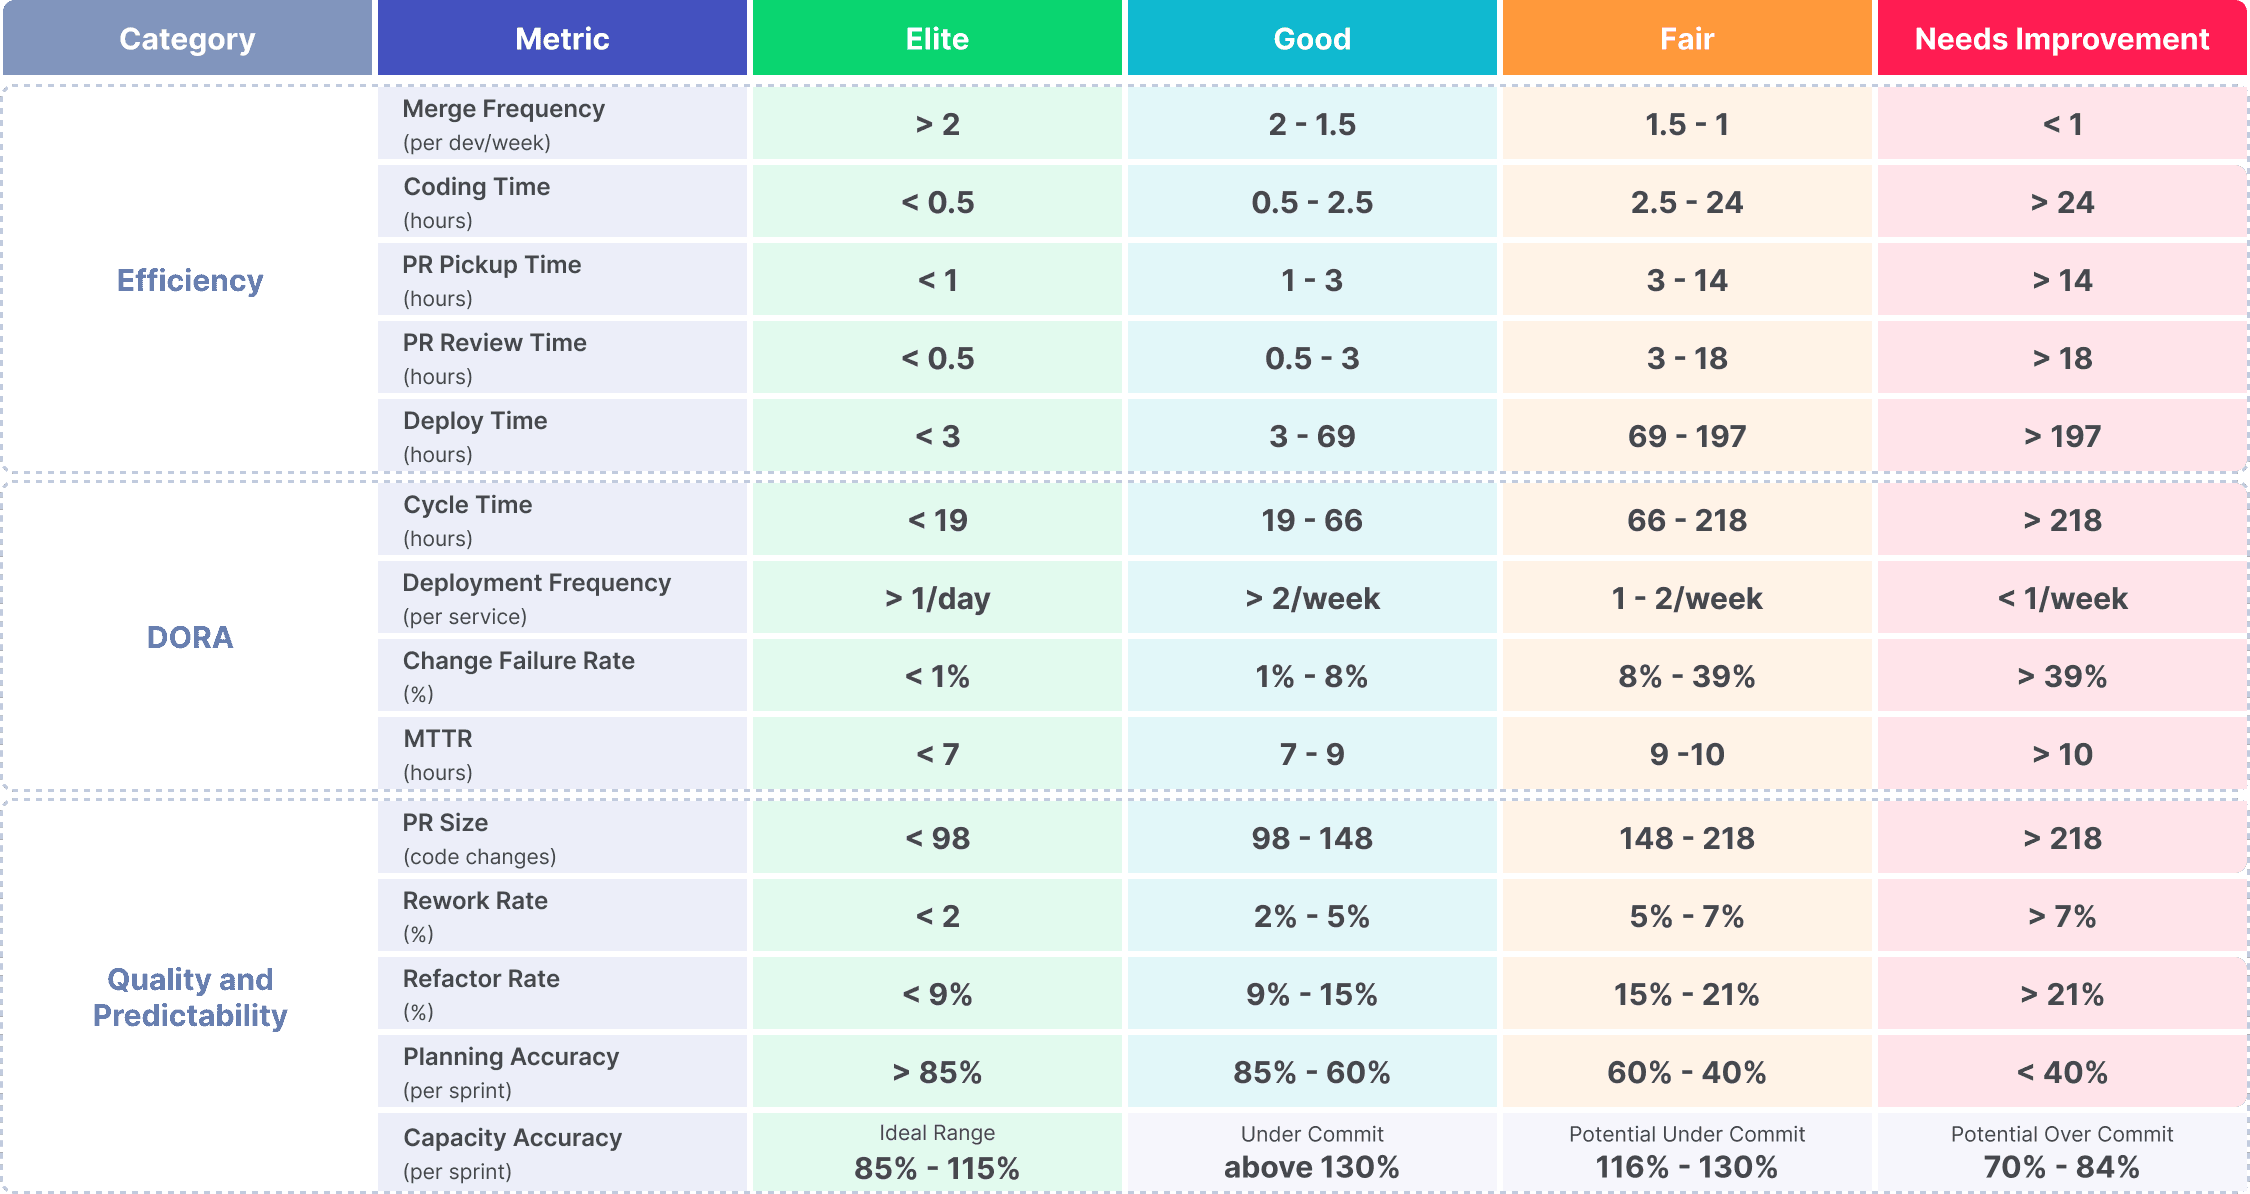
- Cycle Time: The time it takes to get a piece of code from pull request to production. This is one of the best indicators of development team efficiency, as it measures the entire PR process–a.k.a the most painful part of software development.
- PR Maturity: Minimizing the back-and-forth in pull requests to ensure quick and decisive reviews, leading to faster integration of code changes.
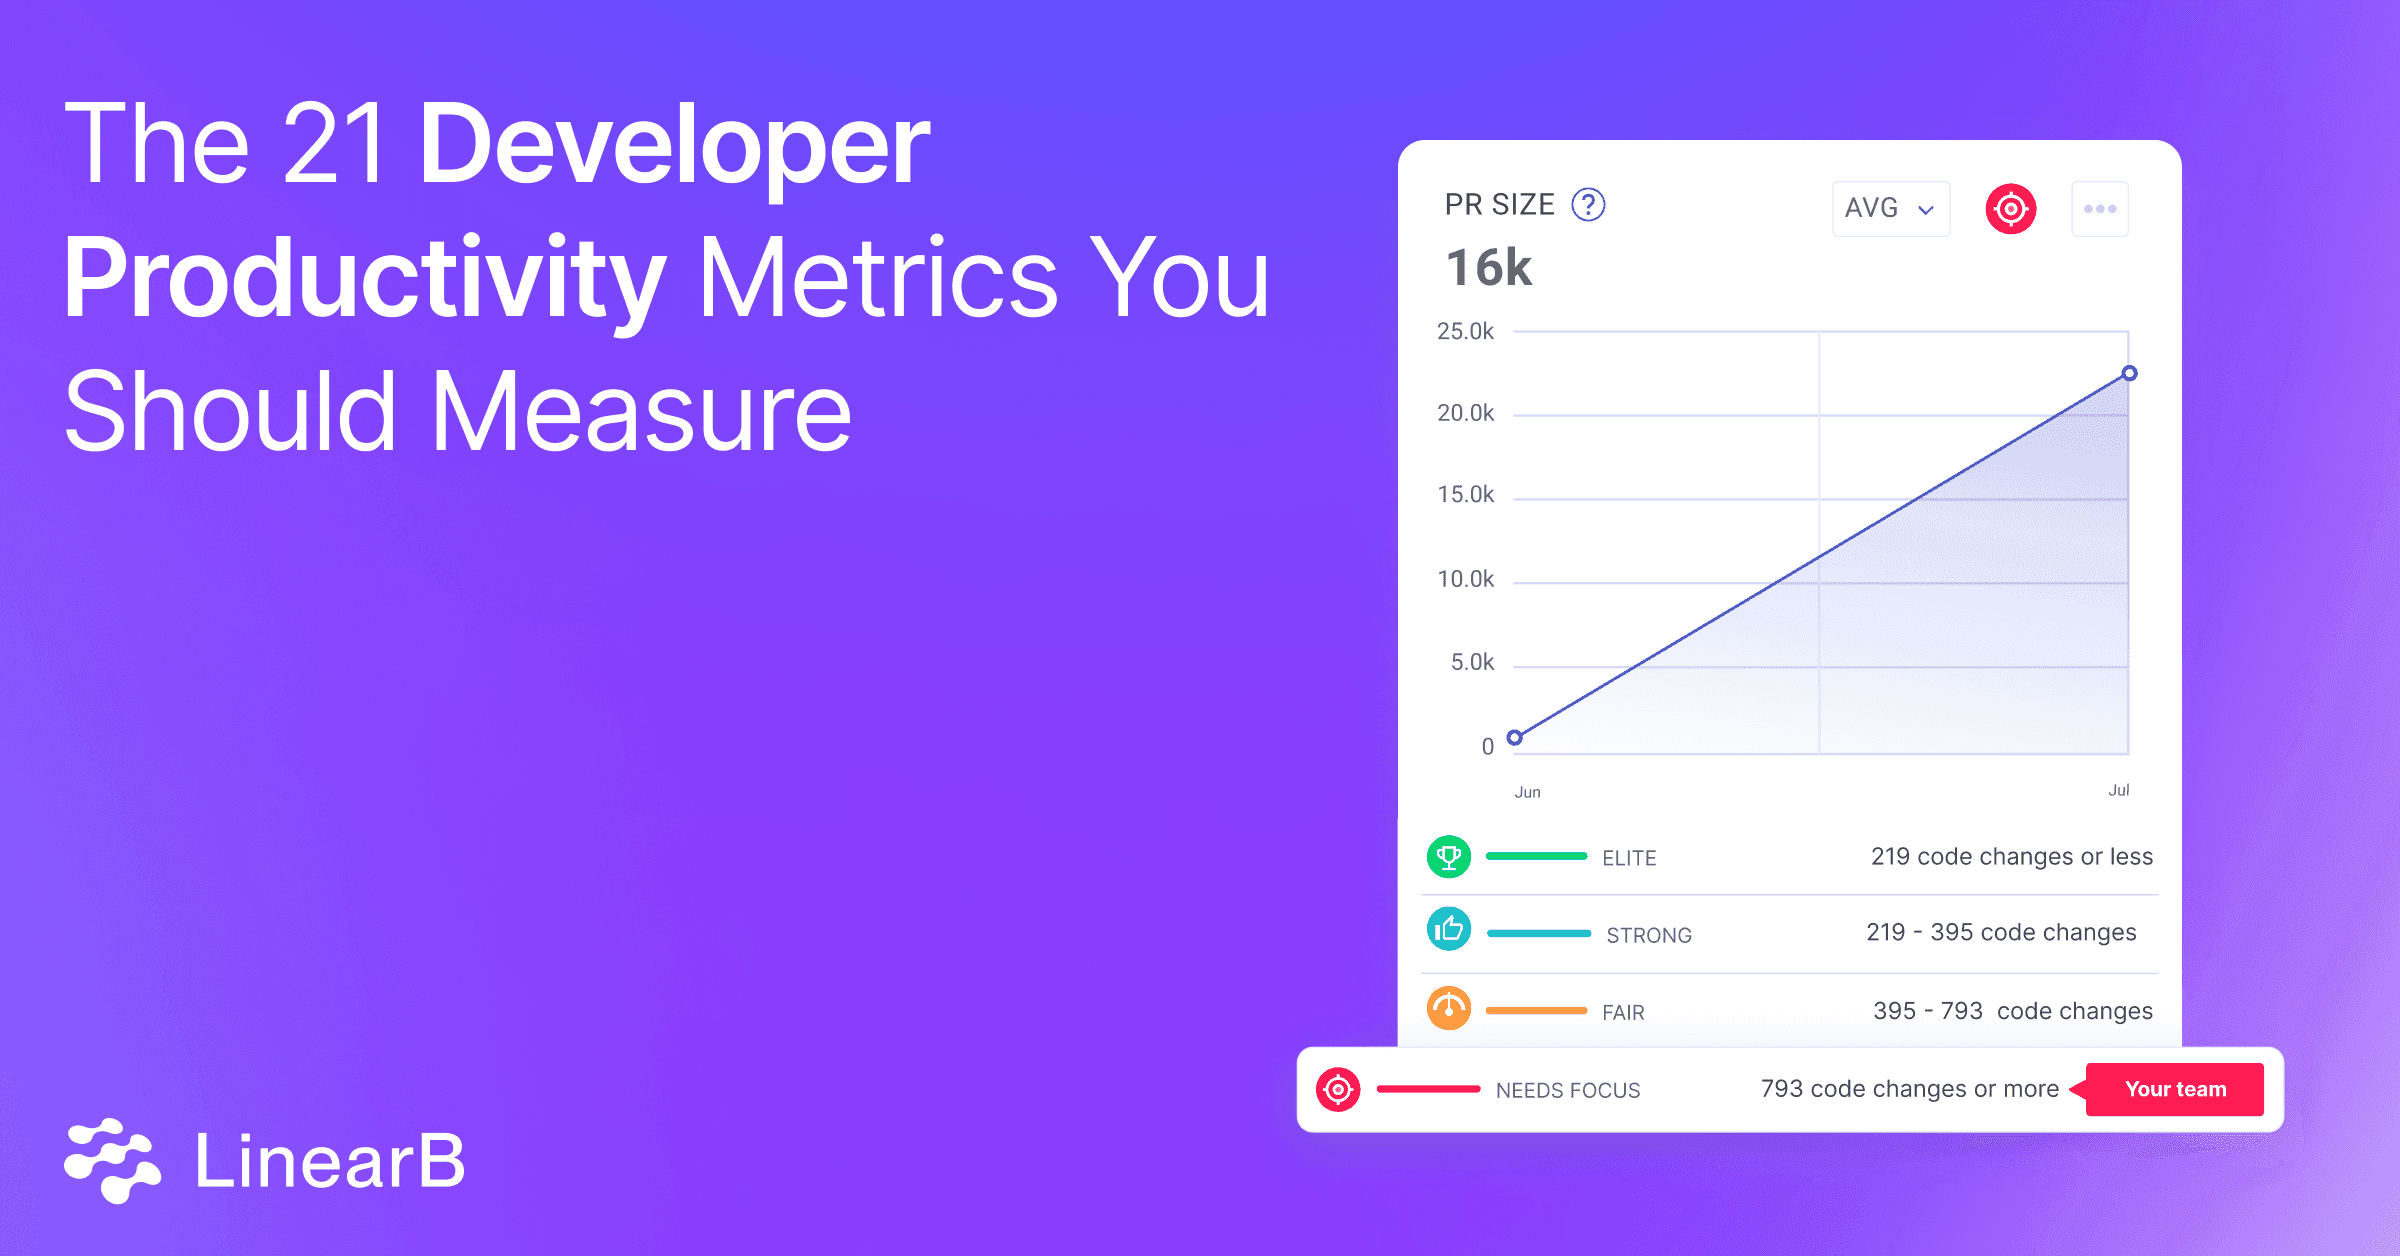
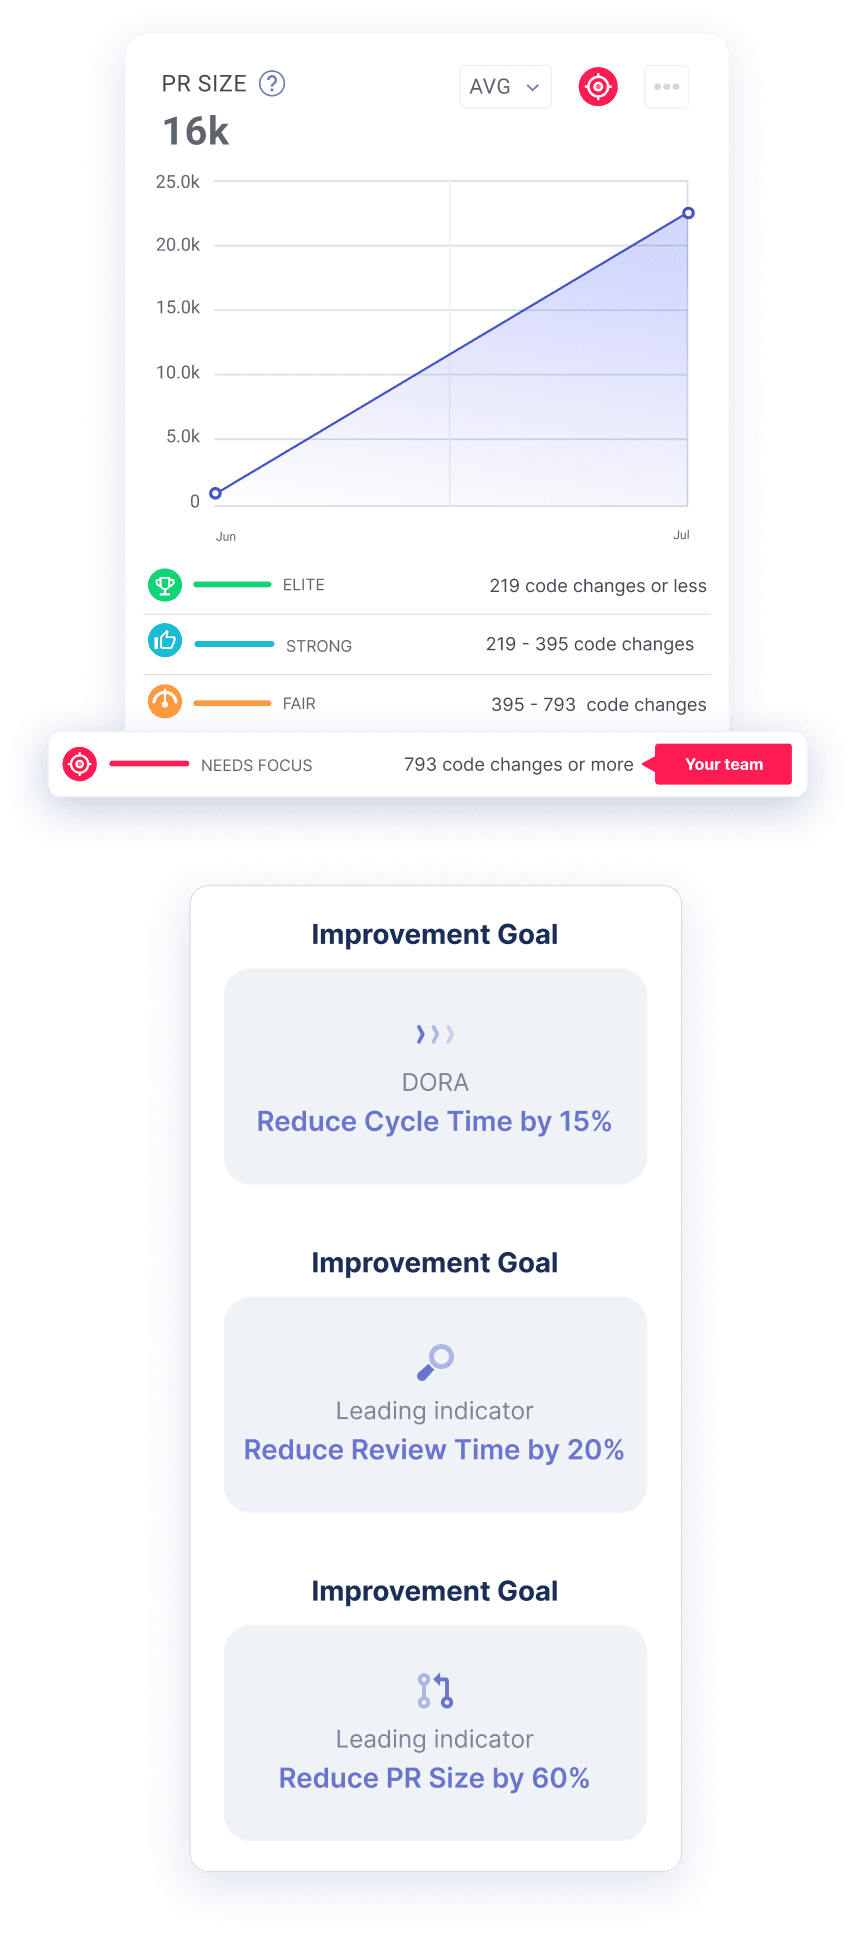
- PR Size: One of the best leading indicators of overall efficiency. Small PRs mean faster pickup time, reviews, and cycles–translating to faster time to value.
- Code Churn and Rework: Reducing the need for frequent code changes and revisions by getting it right the first time.
- Stability (CFR and MTTR): These are cyclical metrics. High operational efficiency and PR maturity will drive improved quality, which in turn will drive better stability. This improved stability will enable higher operational efficiency as teams will spend less time addressing bugs and outages.
- Cognitive Load: Avoiding multitasking, high WIP counts, and attention splitting to maintain focus and reduce cognitive overhead.
- Task Completion: Striving to complete tasks quickly and move on to the next task efficiently, which is considered the ideal state.
Effectiveness Metrics
Effectiveness involves doing the right tasks, aligning with business goals, and meaningfully contributing to the team and organization. Effectiveness also has a profound impact on delivery timelines and project forecasting. This includes:
- Alignment with Business Goals: Ensuring that tasks and projects contribute directly to business objectives and strategic goals.
- Resource Allocation: Assigning the right people (and the right amount of people) to the right projects.
- Accuracy Scores: Focusing on scoped work (Planning Accuracy) while maintaining operation flexibility to adapt to the regular ebb and flow of engineering organizations (Capacity Accuracy).
- Meaningful Contributions: Making significant contributions to one’s business unit or area of ownership, ensuring that work has a tangible impact–this is informed by both resource allocation and investment strategy.
- Consistency: While predictability and keeping promises to the business is important, so is operational consistency. Teams should strive for consistent (and steadily improving) accuracy scores and cycle time to ensure accurate timeline forecasts and kept promises.
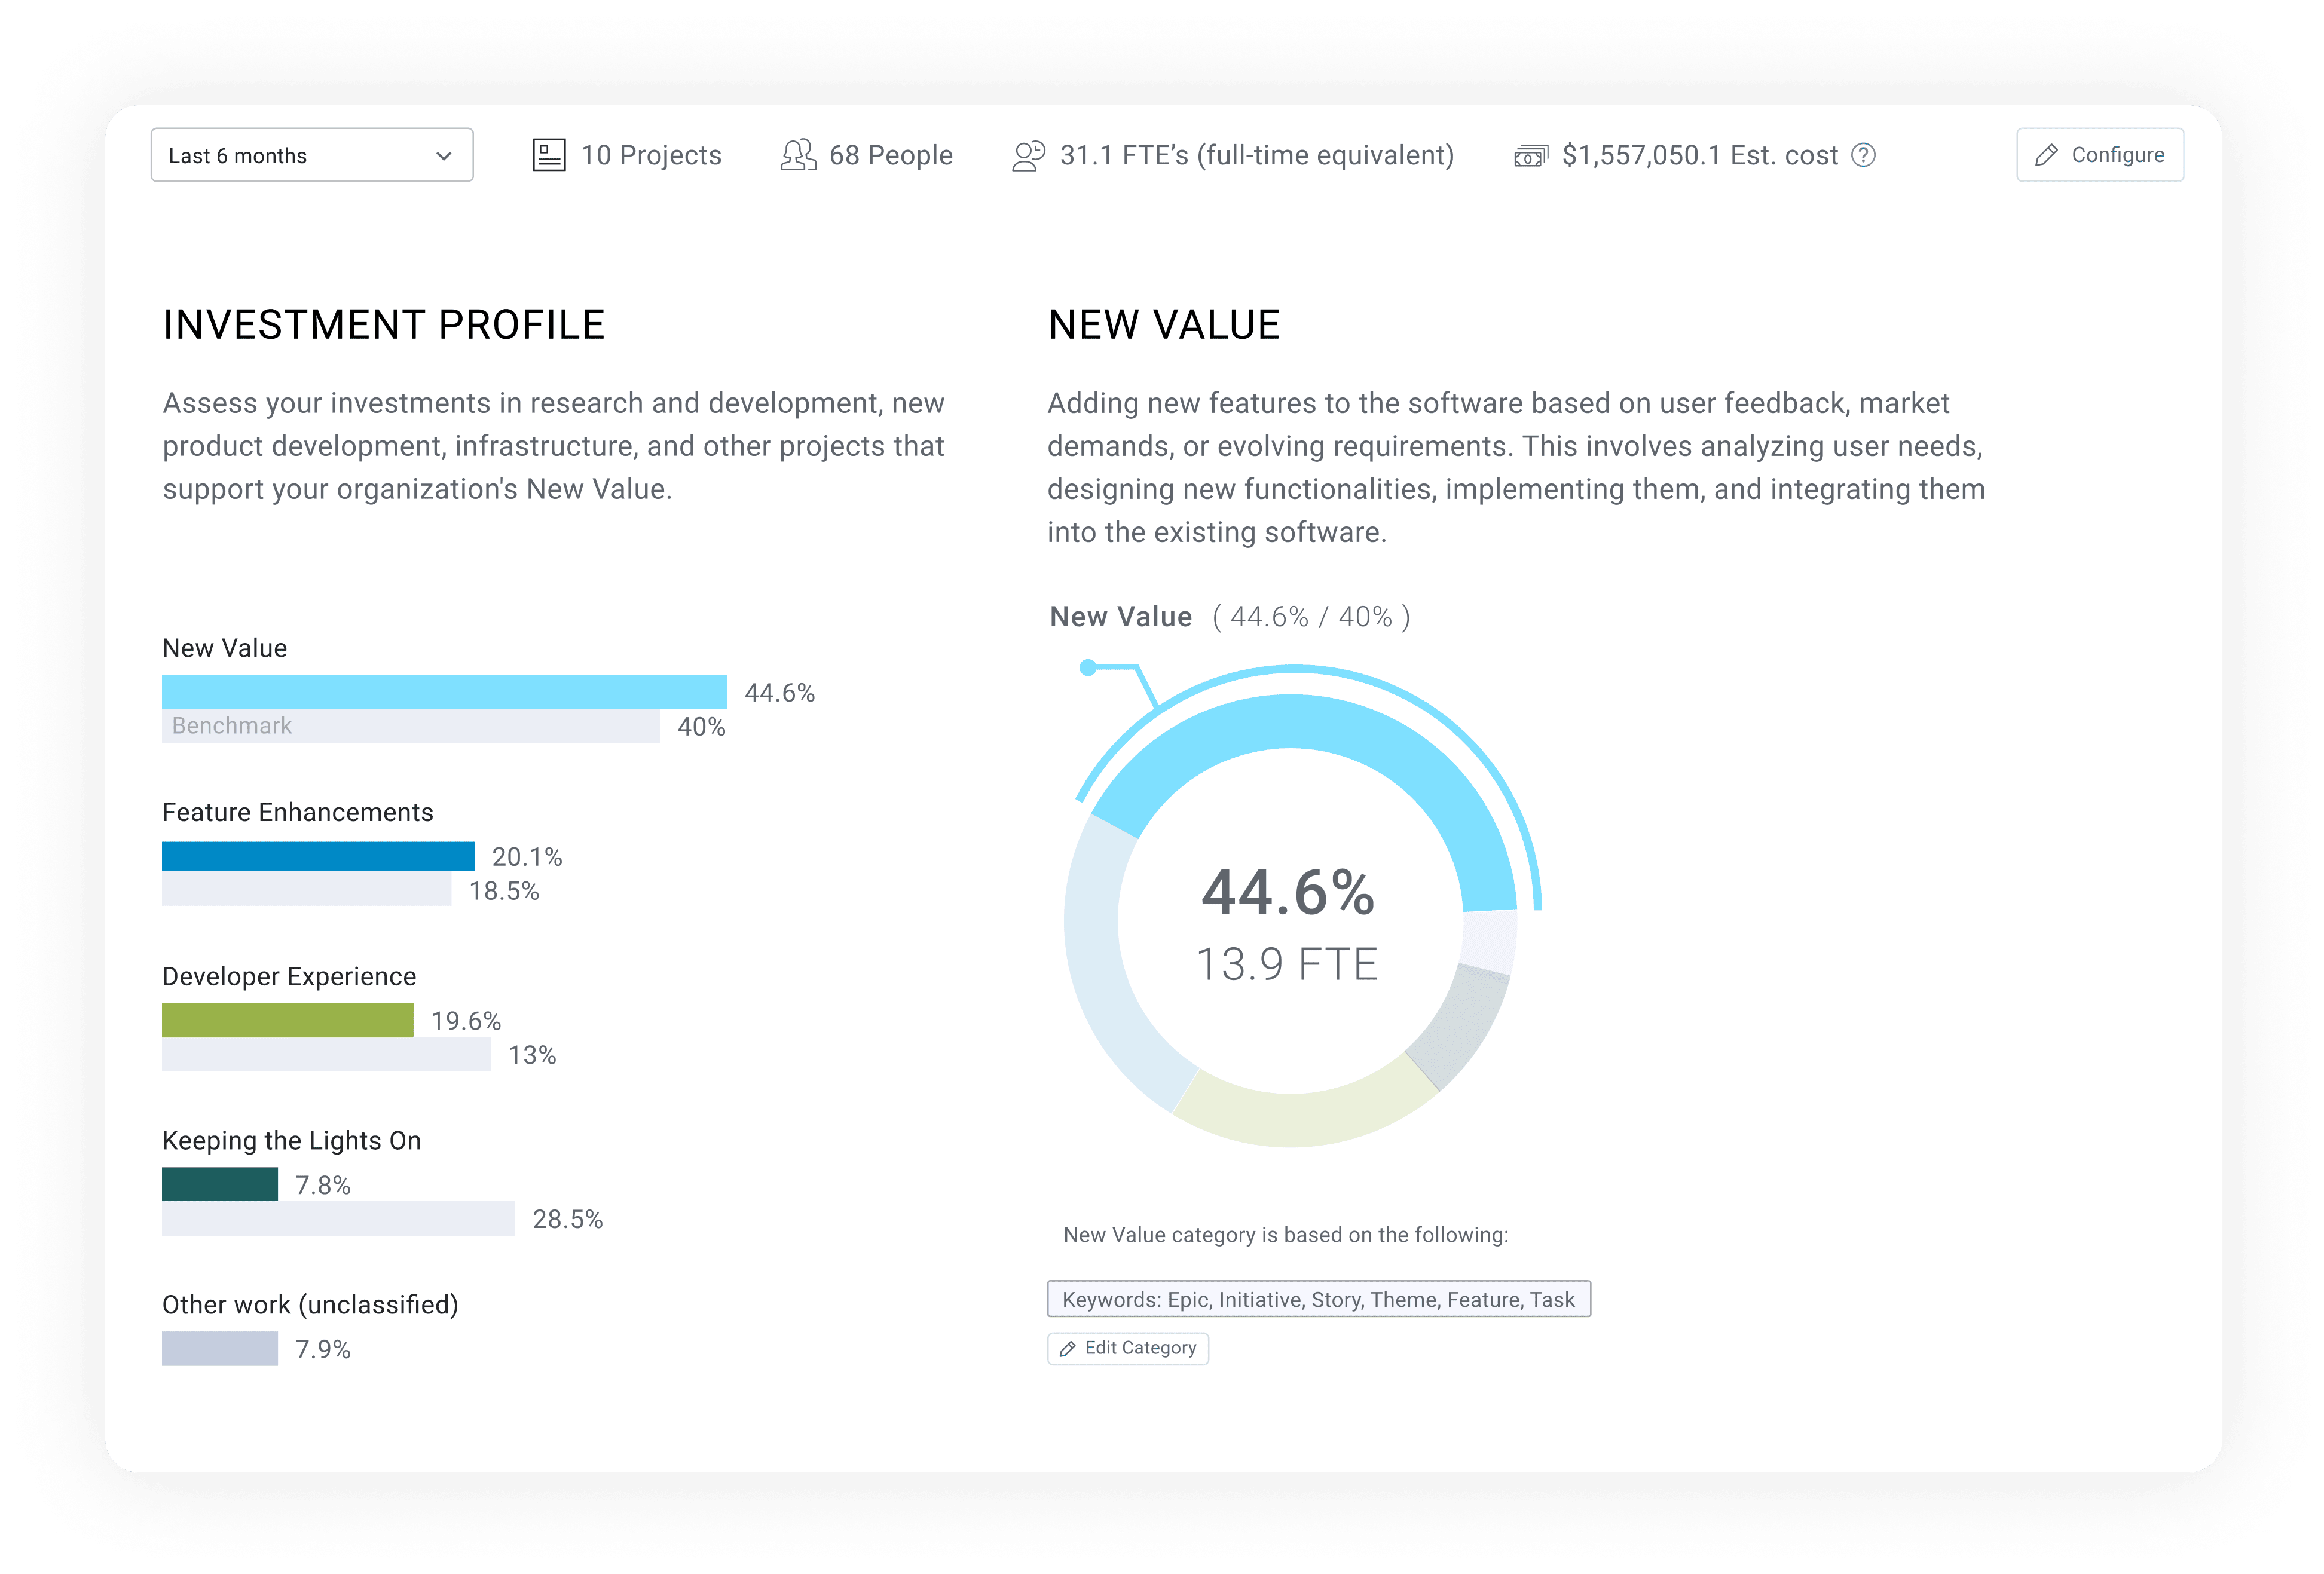
- Balancing New Value and Maintenance: Striking a balance between creating new features and maintaining existing systems (keeping the lights on).
Experience Metrics
Experience encompasses the morale and engagement of developers, directly impacting their productivity and overall job satisfaction. Key aspects include:
- Idle or Wait Time: This metrics collection shows the time between the various phases of the pull request process. Idle time kills productivity as it splits focus, creates a high cognitive load, and drives further slowdowns in the PR process.
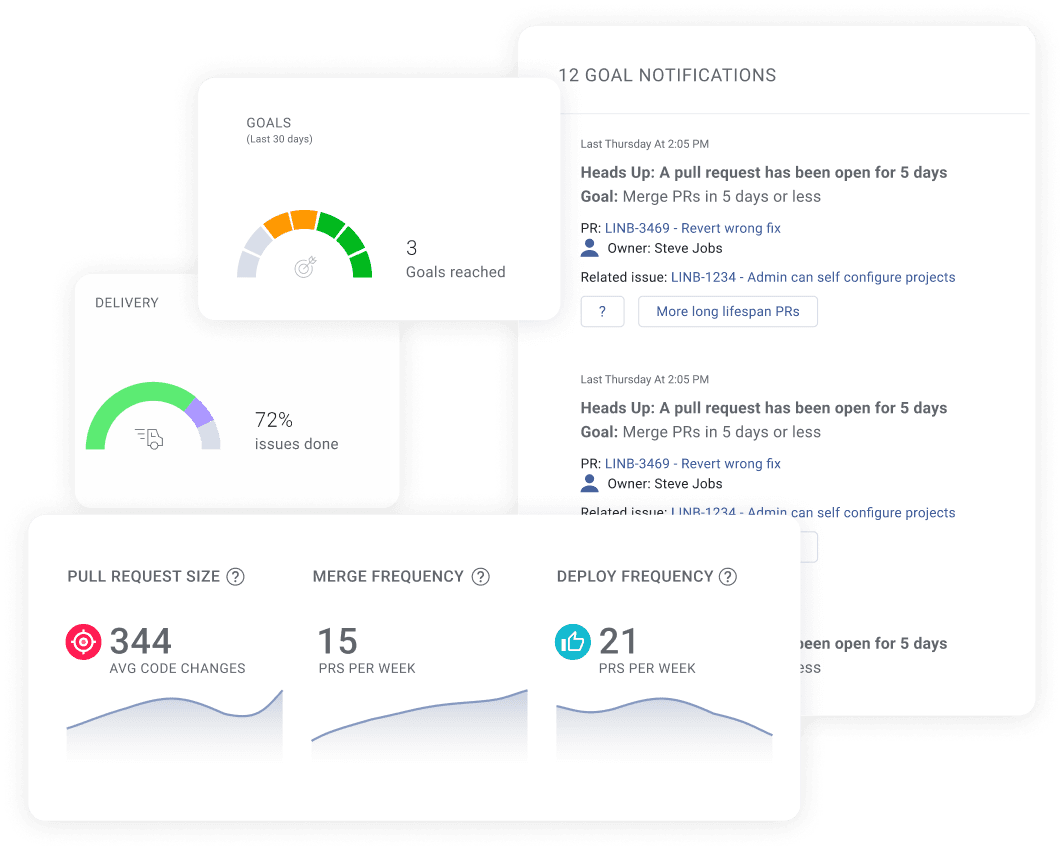
- Meeting Team Goals: When bottlenecks and inefficiencies are discovered (as informed by industry benchmarks), effective teams set data-backed goals against them (in addition to automated workflows). Regularly attaining these goals indicates both developer effectiveness and a good developer experience.
- Task Balance: Ensuring a healthy mix of tasks, including both bug fixes and engaging new challenges, to keep developers motivated and interested.
- Skill Expansion: Encouraging developers to explore new parts of the codebase and expand their skill sets, promoting continuous learning and growth.
- Knowledge Expansion: Continuously expanding knowledge of the codebase and learning new programming languages and technologies.
- Coding vs. Code Review: Balancing time spent on writing code with reviewing and providing meaningful feedback on others’ code to maintain high code quality standards.
- Unplanned and Added Work: Unplanned work is a normal part of any engineering organization. A healthy amount of planning and scoping flexibility is good, but it needs to be addressed when it begins to impact the delivery of roadmap items promised to the business.
- WIP: Managing work-in-progress (WIP) to avoid overloading developers, helping them maintain focus and avoid burnout.
Organizations can significantly enhance developer productivity by understanding and optimizing these aspects of efficiency, effectiveness, and experience, leading to better outcomes for both the developers and the business.
How to Use These Metrics to *Actually* Improve
Enhancing developer productivity is crucial for a business to maintain a competitive advantage. To achieve this, a structured approach is essential. This section provides step-by-step instructions on accelerating developer productivity by focusing on three key areas:
- Goal setting using quantifiable engineering metrics
- Automating productivity improvement and toil reduction
- Using data to inform conversations, recurring syncs, developer ceremonies, and every decision
By optimizing for each of these, organizations can create an environment where developers thrive and produce their best work.
Setting Data-Backed Team Goals
By aligning operational goals with business-level OKRs and using metrics and engineering benchmarks to guide the goal-setting process, organizations can ensure that their engineering efforts are both effective and aligned with broader business objectives.
This approach not only drives continuous improvement but also reinforces the relevance and impact of the development team's work on the overall success of the organization. Here’s the high-level process:
- Start with Organizational Level OKRs: Establish high-level objectives that align with business priorities. For example, "Increase engineering efficiency by 20% by the end of Q2."
- Cascade Goals to Teams: Break down organizational OKRs into team-specific goals. Ensure that each team's objectives contribute to the overall organizational goals. For example, "Team A to reduce average PR review time by 25% in the next quarter."
- Use the SMART Framework: Make sure each goal is Specific, Measurable, Achievable, Relevant, and Time-bound. For example, "Reduce average cycle time from 10 days to 7 days by the end of Q1."
- Monitor Progress and Adjust: Regularly track progress against these goals using dashboards and reports. Adjust strategies as needed based on real-time data and feedback.
For a deeper dive into goal setting, check out Engineering Leader’s Guide to Goals and Reporting.
Automating Productivity Improvements
Automation is key to accelerating productivity. Automation:
- Streamlines repetitive tasks
- Reducing manual overhead
- Enables developers to focus more on high-value activities that drive business outcomes
For more on this, check out the Engineering Leader’s Guide to Programmable Workflows
For automation to be effective, it must integrate seamlessly into the developers' existing workflows. Automation should be intuitive and non-intrusive, enhancing the developers' work rather than complicating it. Developers spend most of their time either collaborating with the team in their favorite communication tools or writing/reviewing code. The following tools meet developers where they are and help with many common tasks:
- Bot Assistance: A developer chat bot that automates tedious data entry tasks, speeds up code reviews and approvals, reduces toil/idle time, keeps team focused on any set operational goals, and helps developers prioritize daily tasks.
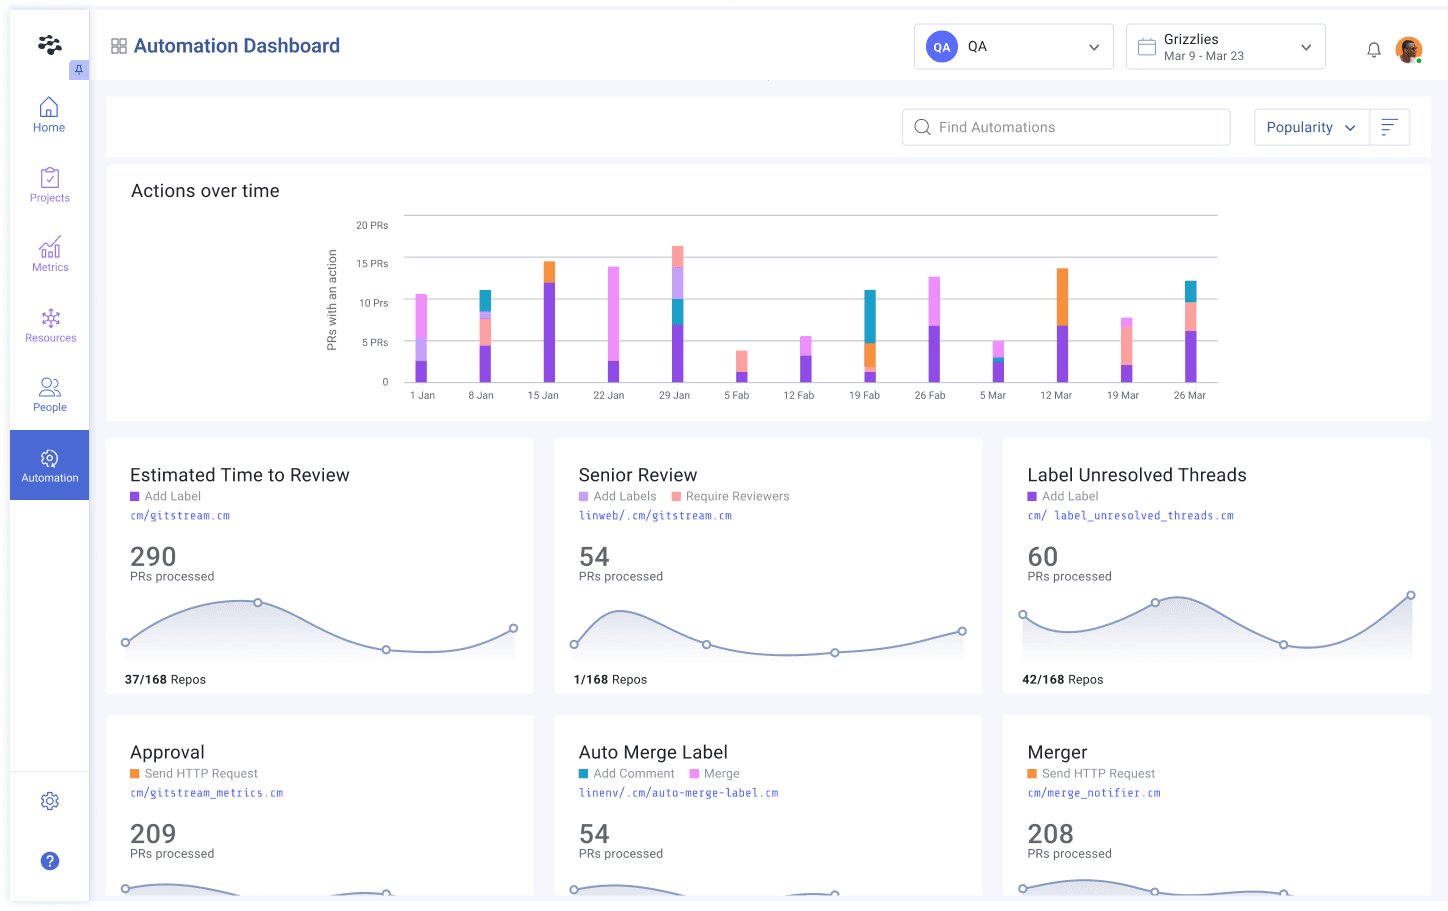
- Pull Request Orchestration: Holistic code-level automation and rules engine that can be applied to individual repositories or the entire organization. It classifies and routes pull requests (PRs), assigns the correct reviewer, selectively triggers CI pipelines, automates security checks, adds context for reviewers, automatically approves small PRs and safe changes, and much more.
Decision-Making, Reviews, Syncs, and Ceremonies
By leveraging the productivity metrics outlined above, managers and ICs will get more out of recurring syncs–like daily stand-ups, weekly check-ins, and sprint retrospectives. Additionally, managers can establish better habits with their team that lead to more informed conversations and more effective performance reviews.
Let’s say that before a 1:1 or performance review, both the manager and IC use the Developer Coaching Dashboard to get data on developers' experience, well-being, and performance. This level of visibility is perfect for:
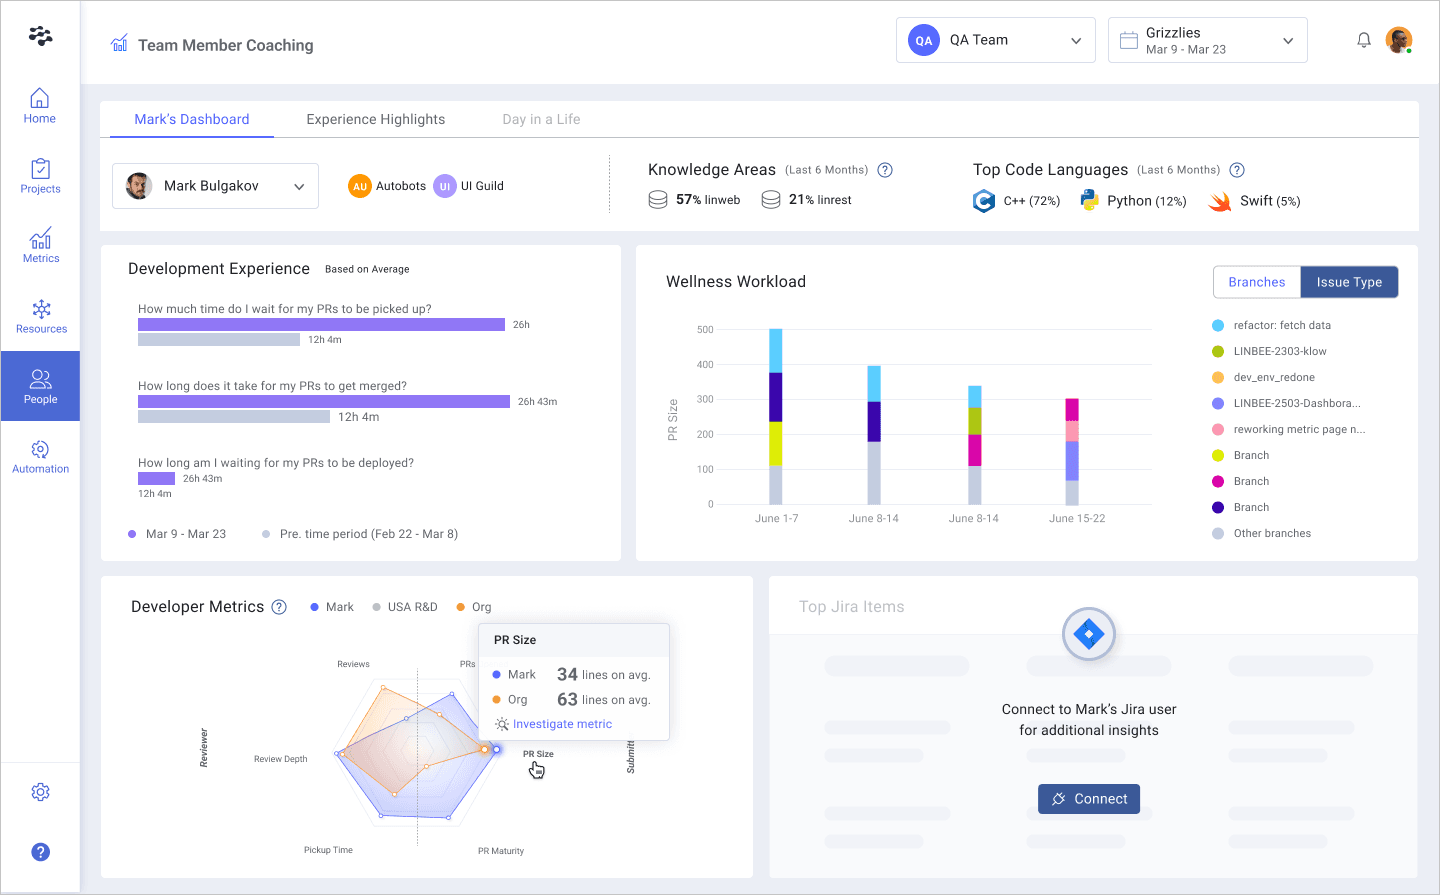
- Setting Context: Use metrics to provide context during one-on-one meetings with developers. For example, discuss specific KPIs such as PR review time or PR size to highlight areas of strength and opportunities for improvement.
- Identifying Bottlenecks: Leverage data to identify and address bottlenecks in the development process. For instance, if review times are consistently high, discuss strategies to streamline the code review process with automation. If cycle time is increasing or the project seems to be going off the rails, discuss potential causes, examine risk indicators, and collaboratively develop solutions.
- Goal Alignment: Ensure individual goals are aligned with team and organizational objectives. Use data to show how individual contributions impact broader goals, fostering a sense of ownership and accountability.
- Celebrating Success: Use data to recognize and celebrate team achievements. Highlight metrics that show improvement and acknowledge contributions that led to success.
- Conducting Performance Reviews: Ensure fairness, transparency, and objectivity with your performance reviews using data. In addition to operational and project metrics, use sentiment data from things like developer surveys. Remember that context–like role and seniority–matter just as much as the metrics themselves. Also, be sure to establish a habit of regularly examining this data with your team, not just during formal reviews–this is how developers continuously improve.
- Enhancing Regular Conversations: Metrics should enhance, not replace, conversations with your team. With data and transparency, you can foster more open communication, provide personalized feedback, emphasize skill development, and build trust because bias and feeling is removed from the equation. However, personal interactions give context and understanding that data alone cannot provide.
Start Improving Your Developer Productivity Today
Tracking and improving developer productivity isn’t about counting lines of code or completed story points—it's about understanding the broader context of team efficiency, individual contribution, and business outcomes. The 21 metrics outlined in this blog are designed to empower engineering leaders to gain actionable insights into their teams' performance, foster a culture of continuous improvement, and align engineering efforts with organizational goals.
Now that you’ve got the right metrics in place, you’re better prepared to evaluate and work to improve the productivity of your development team. Remember that productivity encompasses high-level operational measures like cycle time and other DORA metrics, leading indicators like pull request size, and investment strategy insights–everything needed for an efficient, effective development practice.
This comprehensive framework helps teams of all sizes identify bottlenecks, prioritize resources, and celebrate wins. But metrics alone won’t drive change; it’s the intentional use of data to enable better decision-making, cultivate team collaboration, and improve developer experience that truly spurs productivity. This metrics-driven approach ensures your teams stay focused, efficient, and aligned with your organization's strategic goals.
The LinearB SEI+ Platform is tailor-made to measure and accelerate developer productivity. It simplifies this process by consolidating these critical metrics into actionable insights. With features like workflow automation, real-time coaching dashboards, and predictive project delivery tools, LinearB helps you move beyond tracking productivity to actively improving it.
Start your journey to measurable productivity improvement today by getting a demo of LinearB and position your engineering team for long-term success.


