Value stream metrics are how you measure your efforts to deliver results. If you don’t measure your activities, you don’t know how well you provide value. But if you’re not watching the right metrics, you might be worse off. So which metrics should you use?
This post will look at the four most useful value stream metrics in software delivery. We’ll discuss what the metrics are, why they’re essential, and how you can use them to improve your value streams and your customers’ satisfaction.
Once you have that understanding, check out our other post, How To Easily Measure Key Flow Metrics, on how to implement systems to measure your flow metrics.
First, let’s level set by answering a fundamental question: what’s a value stream?
Table of Contents
What’s a Value Stream?
First, can you define a value stream without defining what you mean by value?
When we’re talking about business activities and how we organize and measure them, we often define value in monetary terms. But that’s not what value means in a value stream. In this context, value takes on a broader meaning; it’s the successful delivery of solutions to a stakeholder’s problem. When we’re talking about software development, value is new features, continuous improvements to existing features, and bug fixes.
So, a value stream consists of efforts to deliver products and services to clients. A client can be an internal or external stakeholder. Effort is the work you put into solving their problems.

When you look at a value stream, you’re looking at the entire process. It starts with a stakeholder expressing interest in or requesting value and only ends when a solution is delivered.
Value streams have stages, hence the stream abstraction. Each step adds value as the solution moves toward the stakeholder that initiated the request. Check out this presentation from Helen Beal if you want more insight into the stages of value stream management.
Steps that don’t add value are not part of the stream, and this is one of the areas where metrics can help you make data-driven decisions. How much effort are you putting into adding value vs. other activities?
Value Stream Metrics
Lead Time
How long does it take for your team to deliver a new feature? Time to value, or lead time, is a fundamental value stream metric. It measures how long it takes a request to travel from submission to release.

Lead time starts when the requirement or user story is requested, not necessarily when an iteration or sprint begins. Lead time measures the entire process: specifying, scheduling, coding, testing, and delivery.
Knowing how long it takes to deliver value is a helpful picture of your entire organization.
The agile process tries to shorten lead time by delivering smaller increments of value more frequently. It provides value faster by delivering it when the work is complete and not holding it back so you can deliver it as part of a larger release.
You can also look at implementing continuous deployment (CD) so that you deliver value as soon as it is ready. DevOps principles lend themselves to effective value streams. Deployment frequency is a powerful measure of how often you provide value. We’ll look at that metric below.
A shorter lead time means your streams are working well, and you’re delivering value rapidly. Longer times indicate a bottleneck somewhere, and you need to drill down into the stream to isolate it.
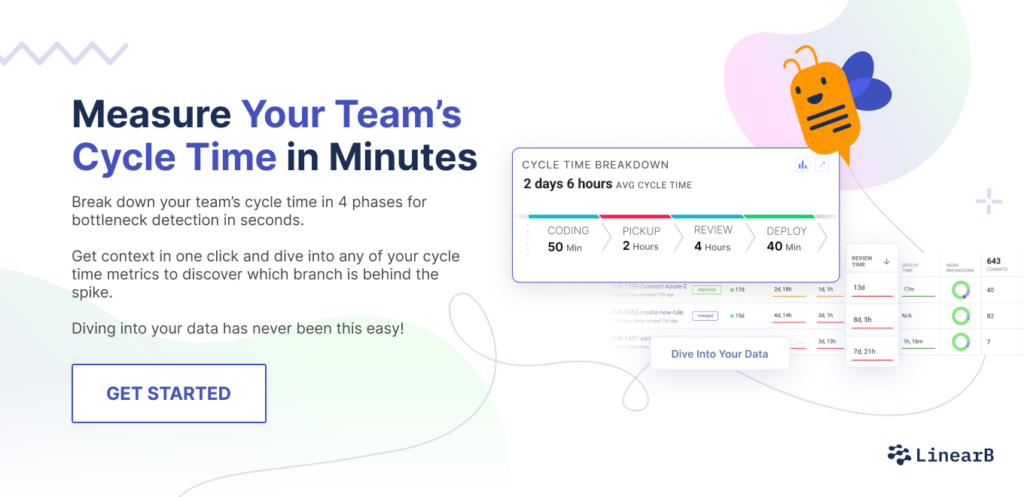
Cycle Time
Cycle time is how long it takes to deliver value after the work begins. It’s a key metric for software production that originated in manufacturing, where it refers to how long it takes a plant to deliver a customer order, including fabrication, assembly, and testing.
So, cycle time is a subset of lead time since it doesn’t include the specification and scheduling stages of the value stream.
Cycle time starts with your developers’ first commit and ends with a release to production. So, it includes coding time, pull requests, reviews, merges, and deploys.

The right tool can help you figure out where your cycle time is going. High coding time often means a project is too big or too complicated. Or it may mean that team members have neglected the project because of other priorities.
Pull requests that have high wait times for review can also indicate that teams are too busy or are not taking the process seriously. Long merge times are often another indicator of increments that are too large or too complicated.
Shorter cycle times mean your development process is efficient and streamlined. Longer cycle times point to inefficiencies and a slower time to market.
Deployment Frequency
Developing and delivering small increments of value is crucial in agile development and value stream management. Continuous delivery and produce value in small, fast, and frequent deployments are central DevOps principles. Deployment frequency is how you ensure that this process is happening.
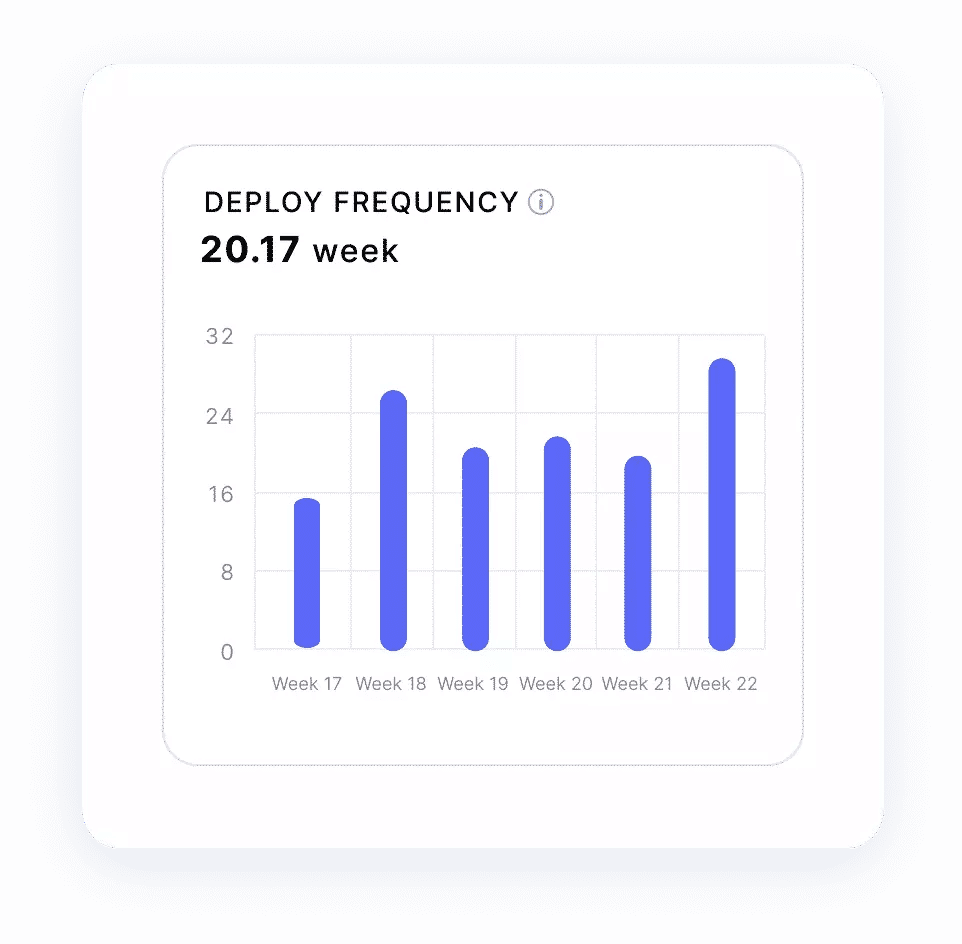
While cycle time measures how long it takes you to complete development cycles, deployment frequency measures how often you complete them. Deployments include bug fixes, improvements, and new features. All these activities represent value, though, so they’re all worth tracking.
You increase your deployment frequency by making your streams move faster. But, the most fundamental way to deploy more frequently is by implementing effective CI/CD pipelines.
Deployment frequency is how you measure results. A high frequency means you’re delivering value to your clients often. Low frequency means you’re not.
Defects
How many bugs are you finding in production? This metric, sometimes called escaped defects, is a measure of your overall code quality and the effectiveness of your value stream. Simply put, defects are the opposite of value and lead to dissatisfied customers.
Some defects make it to production because testing misses them. Other because you didn’t test at all. But a large number exist because the requirements were incomplete or incorrect.
Defects happen, and barring them never happening in the first place, tight feedback loops are the best way to take care of them. Keep your value streams moving quickly, and you’ll be able to address defects quickly. You’ll also have a better chance at catching them in testing because you’ll be working on small well-defined, bundles of value.
The number of issues discovered in production is a good measure of customer satisfaction. You obviously want to keep this metric low. If it creeps up, it may be an indicator of a poor testing or code review process. But, it’s often a sign of increments that are too large or too complicated.
Use Value Stream Metrics to Improve
We looked at lead time, cycle time, deployment frequency, and defects. These four value stream metrics will help you keep your clients happy and your organization on track. All these metrics point to the same two principles: small units of work and frequent releases. That’s not a coincidence since those principles are part of the agile manifesto.
Your metrics should do more than simply measure how well you’re doing. They should tell you what you’re doing well, what you’re doing wrong, and how to get back on track. LinearB can help you with all three.