# How to Use and Improve Your Iteration Burndown Chart | LinearB Blog

> An iteration burndown chart is a key component in agile and scrum. Learn several advantages and disadvantages of using burndown charts.

_This is a markdown rendering of a live HTML page on linearb.io, generated for AI/LLM consumption — it is not a markdown-only site. To get the full HTML page instead, request this URL with an explicit `Accept: text/html` header (no wildcard, no markdown preference)._


```json
{
  "@context": "https://schema.org",
  "@type": "BreadcrumbList",
  "itemListElement": [
    {
      "@type": "ListItem",
      "position": 1,
      "name": "Home",
      "item": "https://linearb.io/"
    },
    {
      "@type": "ListItem",
      "position": 2,
      "name": "Blog",
      "item": "https://linearb.io/blog"
    },
    {
      "@type": "ListItem",
      "position": 3,
      "name": "How to Use and Improve Your Iteration Burndown Chart",
      "item": "https://linearb.io/blog/iteration-burndown-chart"
    }
  ]
}
```

[Home](https://linearb.io/)

/

[Blog](https://linearb.io/blog)

/

How to Use and Improve Your Iteration Burndown Chart

# How to Use and Improve Your Iteration Burndown Chart

![Photo of Tarun Telang](https://assets.linearb.io/image/upload/c_limit,w_3840/f_auto/q_auto/v1/logo-mark-lg?_a=BAVMn6ID0)

By [Tarun Telang](https://linearb.io/blog/iteration-burndown-chart#tarun-telang)

|

June 7, 2022

![basil_james_7x_Th7ws6_T0_unsplash_scaled_3c68e1e80e](https://assets.linearb.io/image/upload/c_limit,w_3840/f_auto/q_auto/v1/basil_james_7x_Th7ws6_T0_unsplash_scaled_3c68e1e80e?_a=BAVMn6ID0)

An [iteration burndown chart](https://linearb.io/blog/sprint-burndown-chart) is a key component in an agile project, particularly in scrum. **It gives scrum teams and other stakeholders a quick view of whether the team is on track to complete the work for the current iteration.** However, burndown charts have several limitations.

In this post, we’ll start by learning about iterations in agile software development. Then we’ll examine the role of the burndown chart, why we use it, and its advantages and disadvantages, and how you can overcome a burndown chart’s shortcomings with LinearB’s Project Delivery Tracker tool.

## Table of Contents

* [What Is an Iteration in Agile Development?](#what-is-an-iteration-in-agile-development)
* [What Role Does the Burndown Chart Play in Iterations?](#what-role-does-the-burndown-chart-play-in-iterations)
* [Project Delivery Tracker Gives You The Complete Picture](#project-delivery-tracker-gives-you-the-complete-picture)
* [Better Planning, Better Execution, Better Software](#better-planning-better-execution-better-software)

## What Is an Iteration in Agile Development?

**An iteration, also known as a sprint in scrum terminology, is a time-boxed period during which a set of specific tasks are to be completed.** These tasks are generally related to the project under development and as much as possible they focus on delivering new features or functionality. The goal of an iteration is to complete the tasks within the set time frame so that the team can deliver the project to the customer on time.

[![On My Way Gif By Sticker Find & Share on GIPHY](https://media2.giphy.com/media/QC4omVTWEVFUDhzkUU/giphy.gif)](https://giphy.com/gifs/stickergiant-sticker-giant-on-time-right-QC4omVTWEVFUDhzkUU)

The team, led by the project manager or scrum coordinator, then creates a plan of how they will complete the tasks and assigns each task to a specific team member. The team members work on their assigned tasks throughout the sprint and update the rest of the team on their progress during [daily scrums](https://linearb.io/blog/scrum-meeting). Iterations usually last two weeks, but they can be shorter or longer depending on the team’s needs.
![Iterations usually last two weeks, but they can be shorter or longer depending on the team's needs.](https://assets.linearb.io/uploads/teamsneeds.png)

## What Role Does the Burndown Chart Play in Iterations?

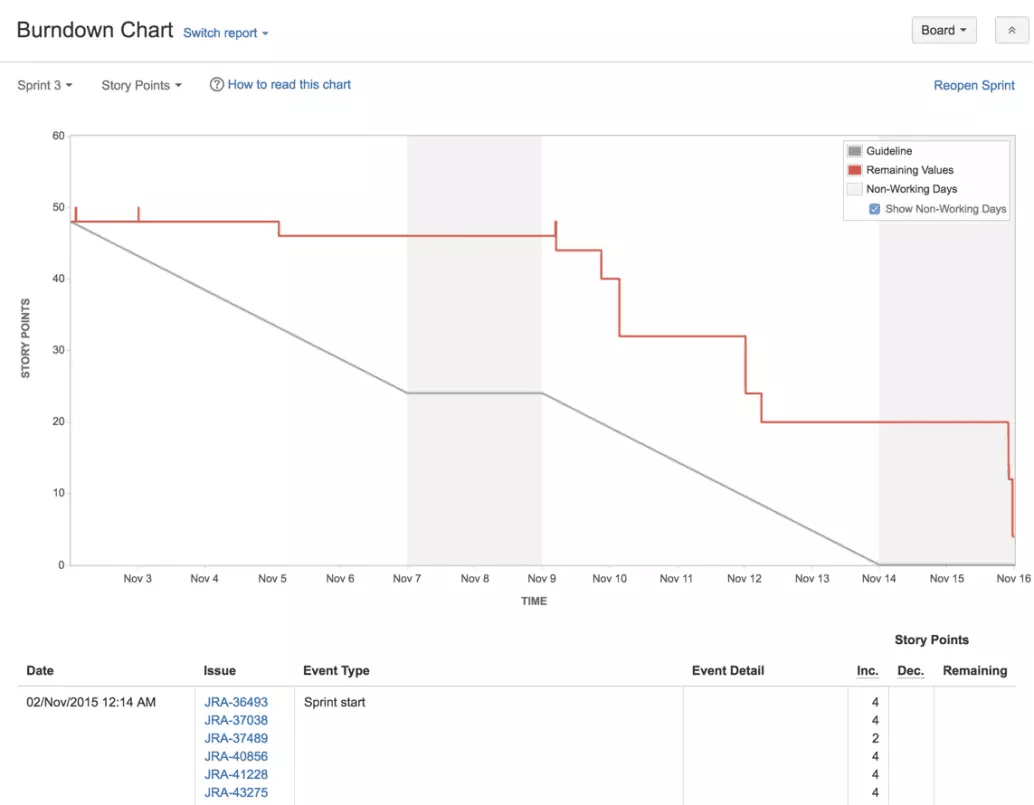
The burndown chart is a graphical representation of the amount of work remaining in an iteration. The vertical axis of the burndown chart represents the amount of work remaining, with “work” typically being defined as [story points](https://linearb.io/blog/story-points-definition-caution-on-estimating). The horizontal axis represents the days in the iteration:
![Example burndown chart in Jira](https://assets.linearb.io/uploads/jsw-burndown-chart-1-1024x797.png)Example of a burndown chart in jira

In grey, you have the ideal work remaining line. (As you can see, it consists of a set of straight lines so it’s unrealistic to expect that the team can stay on it exactly). The red line shows you the amount of work that has actually been completed.

In this chart, we see that progress in this sprint is slower than hoped for: The “actual” line is above the “ideal” line. And what if the “actual” line were below the “ideal” line? This would indicate that the project is ahead of schedule!

As the team is working during the sprint, the chart updates to record the work that they completed.

By the way, a burn up chart conveys the same information just slightly differently. You can read about the differences [here](https://www.wrike.com/blog/what-is-a-burn-up-chart/).

![The burndown chart is a graphical representation of the amount of work remaining in an iteration.](https://assets.linearb.io/uploads/amountofwork.png)

### Advantages of Burndown Charts

* A burndown chart provides a clear and succinct visual representation of progress and the amount of work left in a sprint.
* It helps identify potential risks or issues early on, allowing the team to course-correct as needed and avoid any last-minute surprises.
* Lastly, it can help improve estimation accuracy by tracking actual progress against estimated work remaining.

### Disadvantages of Burndown Charts

On the other hand, there are also many potential disadvantages to using a burndown chart:

* A burndown chart can be time-consuming to create and maintain, especially when the team makes it manually using a tool like Excel.
* It can often be challenging to interpret and use for tracking progress because the y-axis is not labeled with specific task types or categories. As a result, it can be difficult to tell if the remaining work is all of one kind or spread across multiple types and how the work maps to particular epics, projects, and user stories.
* It doesn’t provide insight into why the work remaining has changed. This is critical information for teams trying to improve their estimation accuracy.

## Project Delivery Tracker Gives You The Complete Picture

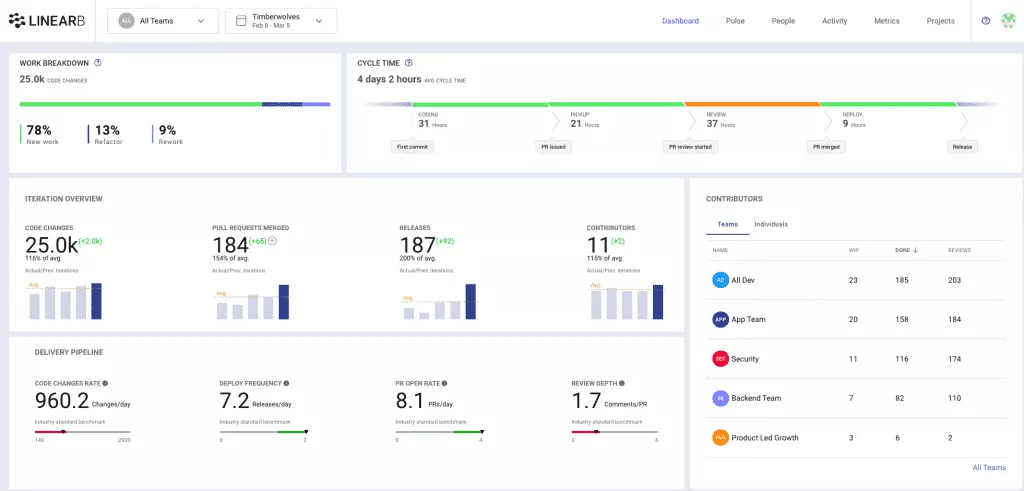
[LinearB’s Project Delivery Tracker (PDT)](https://linearb.io/project-delivery-tracker) is a project board designed specifically for development leads. It provides a complete picture of a project’s delivery status and detailed insights into its progress and the health of the team. It allows dev leaders to make informed decisions without interrupting their developers. All of this enables team leads to deliver higher quality software on time.
![LinearB's Project Delivery Tracker dashboard](https://assets.linearb.io/uploads/LinearB-PDT-dashboard-1024x491-1.png)LinearB’s Project Delivery Tracker dashboard

Let’s zoom in on some individual pieces of the Project Delivery Tracker to understand better how you can leverage LinearB to track your progress during a sprint.

### Work Breakdown

![work breakdown](https://assets.linearb.io/uploads/work-breakdown-png-1024x410.png)

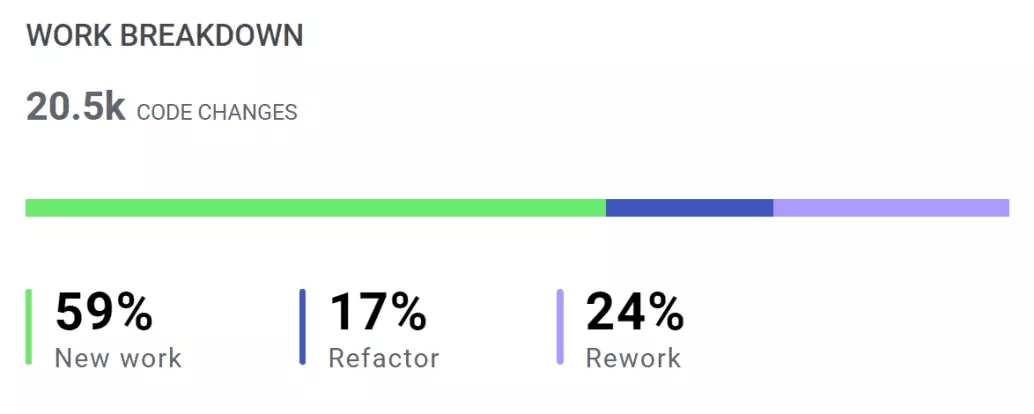
Remember how we talked about how the burndown chart just tells you the **amount** of work that has been completed? The work breakdown metric in LinearB tells you what **kind** of work has been done.

* **New work** is completely new code that is providing new functionality.
* **Refactor** is old code that has been rewritten.
* **Rework** is new code that has been rewritten.

If your burndown chart is showing that your team’s progress is lagging, you can look at the work breakdown to see where your team is spending their time. For example, a high refactor rate suggests that they are paying off technical debt and a high rework rate suggests that they are having to fix recently-introduced bugs.

### Cycle Time Breakdown

[![Cycle time breakdown. Dive into your data.](https://assets.linearb.io/uploads/cycle-time-deep-dive.png)](https://linearb.io/get-started)Get context around cycle time bottlenecks in one click. Diving into your data has never been this easy. [Get started with our free-forever account today!](https://linearb.io/get-started)

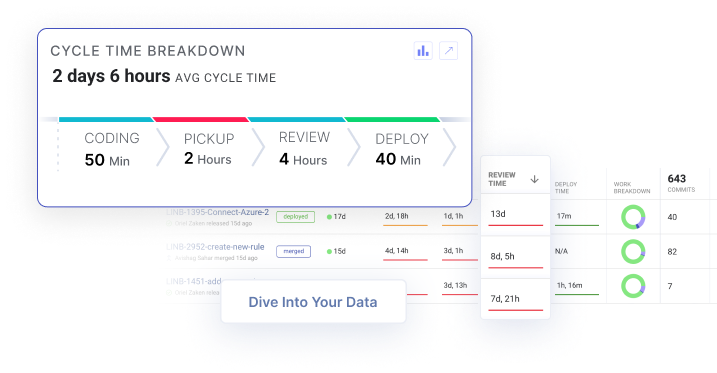
The burndown chart tells you whether you’re behind schedule, but it doesn’t tell you why. The [cycle time breakdown metric](https://linearb.io/blog/reducing-coding-time) in LinearB gives you instant insight into the bottlenecks slowing down your team. With just one click, you can see cycle times for individual issues so that your actions can be super targeted.

In the example above, coding and deploy times are healthy but review time is really slow. As a team lead, you now know that you need to address long review times, enabling you to start speeding up your team’s sprint burndown rate right away.

You could leverage LinearB’s WorkerB automation bot to send automated alerts to your team members to ensure that they stay on top of their reviews!

Get WorkerB alerts for PRs older than your custom threshold. [Book a demo today!](https://linearb.io/book-a-demo)

### Planning Accuracy

In addition to trying to increase the amount of work your team completes in a sprint, it’s also important to remember the other part of a burndown chart: the amount of work planned.

Time estimates are notoriously difficult in software development, and it’s especially difficult to predict the amount of work an entire development team can complete in a sprint. But LinearB’s planning accuracy can help, massively:

By looking across projects and sprints, you can see if your planning accuracy is consistently off and also why. A common cause is that unforeseen issues had to be tackled during the sprint, which you can see in the bright green “Added” portion of each of the bars in the chart.

If your team has to frequently take on unplanned work during a sprint, this suggests that there is technical debt in your codebase that is causing bugs or that requires time-consuming maintenance.

## Better Planning, Better Execution, Better Software

Burndown charts are an essential tool for managing a software development iteration. But, as we’ve seen, they only give you a simple gauge of your team’s progress. As a team lead, you need to understand in more detail where your team is spending their time, why you’re not achieving more progress, and why your initial plans may have been off.

LinearB gives you all of that insight, and it does it through metrics and charts that you can parse at a glance. And not only is LinearB easy to use, it is easy to set up.

To learn just how easy it is to start using LinearB, and all the ways it can help you to refine your processes and improve your team’s quality and speed, [set up a demo today](https://linearb.io/book-a-demo).

[![Improve your engineering organization at every level with LinearB](https://assets.linearb.io/uploads/GenericLineaRB3Pillars-1024x497.png)](https://linearb.io/get-started/)Want to improve your engineering processes at every level? [Get started with a LinearB free-forever account today!](https://linearb.io/get-started)

## Improve developer productivity with LinearB

Find us on

[](https://www.linkedin.com/company/linearb)
[](https://devinterrupted.substack.com/)

## Your next read

[![Cover image for Your software factory needs a context layer](https://assets.linearb.io/image/upload/c_limit,w_3840/f_auto/q_auto/v1/unnamed_4_b35455ae7a?_a=BAVMn6ID0)](https://linearb.io/blog/software-factory-2026-ai-benchmarks-code-review-roi)

Eng. Metrics

[Your software factory needs a context layer](https://linearb.io/blog/software-factory-2026-ai-benchmarks-code-review-roi)

Data from 2.7 million pull requests across 253 engineering organizations shows a widening gap between developers using AI deeply and everyone else. An adoption...

[![Cover image for AI agents are killing the pull request and reinventing CI/CD](https://assets.linearb.io/image/upload/c_limit,w_3840/f_auto/q_auto/v1/Blog_Post_Name_2400x1256_5_496cdfde2d?_a=BAVMn6ID0)](https://linearb.io/blog/circleci-rob-zuber-ai-agents-pull-request-cicd-sdlc)

Eng. Metrics

[AI agents are killing the pull request and reinventing CI/CD](https://linearb.io/blog/circleci-rob-zuber-ai-agents-pull-request-cicd-sdlc)

CircleCI CTO Rob Zuber explains why AI adoption is killing the pull request and forcing engineering teams to completely reimagine the software development...

[![Cover image for AI ROI comes from measuring engineering outcomes on day one](https://assets.linearb.io/image/upload/c_limit,w_3840/f_auto/q_auto/v1/Blog_AI_ROI_comes_from_measuring_engineering_software_security_2400x1256_2c5eae0862?_a=BAVMn6ID0)](https://linearb.io/blog/kraken-nik-sudan-measure-ai-roi-engineering-outcomes)

Eng. Metrics

[AI ROI comes from measuring engineering outcomes on day one](https://linearb.io/blog/kraken-nik-sudan-measure-ai-roi-engineering-outcomes)

Kraken Engineering Operations Lead Nik Sudan details how to establish day-one data infrastructure to accurately measure AI ROI. Discover why raw token adoption...

## Structured data

_Machine-readable metadata (JSON-LD) embedded in the page for search/AI context — not content rendered on the page itself._

```json
{
  "@context": "https://schema.org",
  "@type": "Organization",
  "name": "LinearB",
  "url": "https://linearb.io/",
  "logo": "https://assets.linearb.io/image/upload/v1715628027/logo-mark-lg.svg",
  "description": "LinearB is the engineering productivity platform that helps engineering leaders prove AI is improving throughput without sacrificing delivery confidence, flow efficiency, or developer experience.",
  "sameAs": [
    "https://www.linkedin.com/company/linearb"
  ],
  "award": [
    {
      "@type": "Award",
      "name": "LinearB is a Leader in the 2026 Gartner® Magic Quadrant™ for Developer Productivity Insight Platforms",
      "dateAwarded": "2026",
      "awardedBy": {
        "@type": "Organization",
        "name": "Gartner®"
      }
    },
    {
      "@type": "Award",
      "name": "Great Place to Work Certification",
      "dateAwarded": "2025-2027",
      "awardedBy": {
        "@type": "Organization",
        "name": "Great Place to Work"
      }
    },
    {
      "@type": "Award",
      "name": "America's Best Startup Employers 2025",
      "dateAwarded": "2025",
      "awardedBy": {
        "@type": "Organization",
        "name": "Forbes Magazine"
      }
    }
  ],
  "hasCertification": [
    {
      "@type": "Certification",
      "name": "SOC 1 Type 2"
    },
    {
      "@type": "Certification",
      "name": "SOC 2 Type 2"
    },
    {
      "@type": "Certification",
      "name": "GDPR Compliance certification"
    },
    {
      "@type": "Certification",
      "name": "ISO 27001"
    }
  ]
}
```

```json
{
  "@context": "https://schema.org",
  "@type": "Article",
  "headline": "How to Use and Improve Your Iteration Burndown Chart",
  "url": "https://linearb.io/blog/iteration-burndown-chart",
  "author": {
    "@type": "Person",
    "name": "Tarun Telang"
  },
  "datePublished": "2022-06-07T07:49:37.000Z",
  "dateModified": "2022-06-07T07:49:37.000Z",
  "image": "https://assets.linearb.io/image/upload/v1720000000/basil_james_7x_Th7ws6_T0_unsplash_scaled_3c68e1e80e.jpg",
  "publisher": {
    "@type": "Organization",
    "name": "LinearB",
    "logo": "https://assets.linearb.io/image/upload/v1777485755/linearb-logo-2026.png"
  },
  "description": "An iteration burndown chart is a key component in agile and scrum. Learn several advantages and disadvantages of using burndown charts.\n"
}
```

## More on linearb.io

### Top navigation

- [Book a Demo](https://linearb.io/book-a-demo)
- [AI Code Reviews — Catch security risks, bugs, and spec mismatches](https://linearb.io/platform/ai-code-reviews)
- [AI & Productivity Insights — See how AI tools affect cycle time and delivery speed](https://linearb.io/platform/ai-developer-productivity-insights)
- [Measure AI Impact — Track AI adoption and tie it to delivery outcomes](https://linearb.io/use-case/measure-ai-impact)
- [MCP Server — Chat with your data to spot patterns and boost output](https://linearb.io/platform/mcp-server)
- [Resource Allocation — Cost initiatives and shape your investment strategy](https://linearb.io/platform/resource-allocation)
- [Cost Capitalization — Capitalize engineering costs with audit-ready reports](https://linearb.io/platform/cost-capitalization)
- [Dev Team Management — Set targets and tie throughput to business outcomes](https://linearb.io/platform/goals-and-reporting)
- [DevOps Workflow Automation — Policy-based PR routing, approvals, and tests](https://linearb.io/platform/ai-workflow-governance)
- [AI Powered Support — Unify AI and human code delivery in one clear view](https://linearb.io/use-case/ai-powered-support)
- [Optimization — Surface friction with feedback and MCP insights](https://linearb.io/platform/developer-experience)
- [Reporting — Spot what's working and what needs attention](https://linearb.io/use-case/measuring-developer-experience)
- [Surveys — Turn developer feedback into actionable signals](https://linearb.io/platform/developer-surveys)
- [Platform overview](https://linearb.io/platform/overview)
- [Register now](https://linearb.io/event/the-great-software-factory-debate-2)
- [Customers](https://linearb.io/customers)
- [Pricing](https://linearb.io/pricing)
- [Why choose LinearB — Explore your data. Measure performance. Act to improve it.](https://linearb.io/why-linearb)
- [APEX framework — The operating model for AI-era engineering teams](https://linearb.io/resources/apex-framework)
- [Anti-FAQ — The questions other vendors won't answer](https://linearb.io/why-linearb/anti-faq)
- [Security — Enterprise-grade compliance and zero code access](https://linearb.io/security)
- [Build vs. buy — The hidden cost of building it yourself](https://linearb.io/resources/build-vs-buy)
- [Dev Interrupted Podcast — Conversations with engineering leaders](https://linearb.io/dev-interrupted/podcasts)
- [Reports & Guides — Deep dives on productivity and delivery](https://linearb.io/resources)
- [Webinars — Expert sessions on productivity and AI](https://linearb.io/resources?category=workshops)
- [Metrics Benchmarks — See how your engineering org stacks up](https://linearb.io/resources/software-engineering-benchmarks-report)
- [Blog — Product updates and practical insights](https://linearb.io/blog)
- [Help Center — Documentation, setup, and support](https://linearb.helpdocs.io)
- [API Docs](https://docs.linearb.io/api-overview)
- [Status](https://www.linearbstatus.com/)
- [Integrations](https://linearb.io/integrations)
- [LinearB Library](https://linearb.io/library)
- [Engineering metrics](https://linearb.io/library/engineering-metrics)
- [Platform engineering](https://linearb.io/library/platform-engineering)
- [Engineering glossary](https://linearb.io/library/engineering-glossary)
- [Developer productivity](https://linearb.io/library/developer-productivity)
- [AI in software development](https://linearb.io/library/ai-in-software-development)
- [Engineering management](https://linearb.io/library/engineering-management)
- [Developer experience](https://linearb.io/library/developer-experience)
- [DevOps](https://linearb.io/library/devops)
- [Engineering operations and the context layer](https://linearb.io/library/engineering-operations)
- [Engineering efficiency](https://linearb.io/library/engineering-efficiency)
- [Software delivery](https://linearb.io/library/software-delivery)
- [Research and data](https://linearb.io/library/engineering-benchmarks-and-research)
- [LinearB is a Leader in the 2026 Gartner® Magic Quadrant™ for Developer Productivity Insight Platforms](https://linearb.io/resources/gartner-magic-quadrant-dpi-platforms-2026)
- [Sign in](https://app.linearb.io/login)
- [Enterprise](https://linearb.io/solutions/enterprise)
- [Contact](https://linearb.io/contact-us)
- [About us](https://linearb.io/about-us)
- [Careers](https://linearb.io/careers)
- [Service agreement](https://linearb.io/services-agreement)
- [Privacy policy](https://linearb.io/privacy-policy)
- [DPA](https://linearb.io/data-processing-agreement)
- [Security FAQ](https://linearb.io/security-faq)
- [Substack](https://devinterrupted.substack.com/)

### Footer

_Additional links from the site footer, not repeated from the top navigation above._

- [GitHub](https://github.com/linear-b)
- [LinkedIn](https://www.linkedin.com/company/linearb)
- [Twitter](https://twitter.com/LinearB_Inc)