Bugs. They’re a fact of life for software developers – over a third of developers spend 25% of their time fixing bugs!
Sometimes, the bugs seem to be in control, not the developer.
Although bugs are inevitable, there are ways to prevent them. This will not only make your application more stable, but it will give your developers more time to spend building new features.
Code quality metrics help you to get a better grasp on the incidence and impact of bugs in your codebase. In this post, we’re going to look at the metrics you should be tracking and how you can improve them.
What Are Code Quality Metrics?
In short, code quality metrics tell you how good your code is. But code quality is highly subjective, which doesn’t lend itself to one, neat metric. Instead, you need a group of metrics that give you a more comprehensive and granular assessment of the quality of your code.
What Are the Impacts of Bad Code?
Poor code quality has a host of negative impacts:
- More fire drills for developers
- More code churn
- Higher pickup and review times
- Decreased velocity
- Missed promises
- Fewer features shipped in an iteration
- Less value delivered
Bad code doesn’t just result in bad final products. It also results in fewer features and products shipped, more stress for developers, and more tension between teams.
The Key Metrics
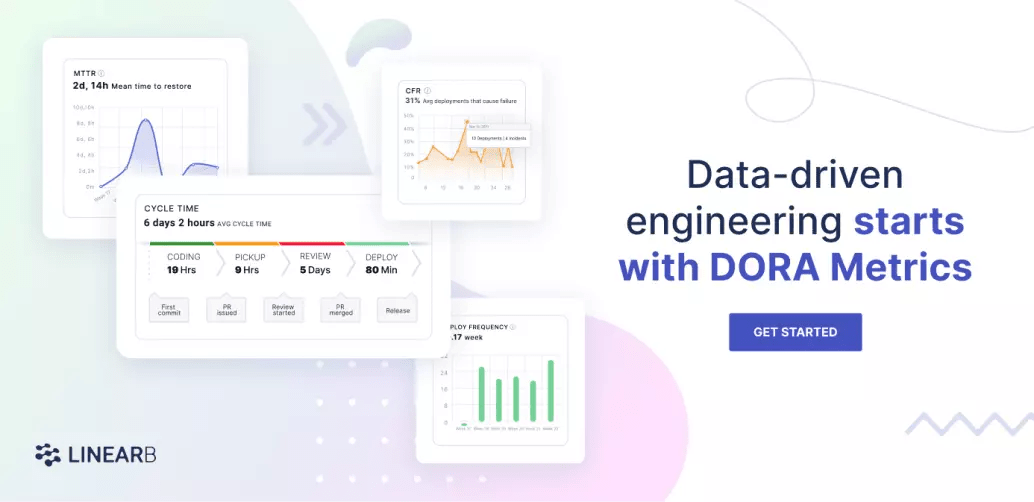
The four DORA Metrics have quickly become the industry standard, and for good reason. They’re really powerful, which is why we built the capability to track them into LinearB.
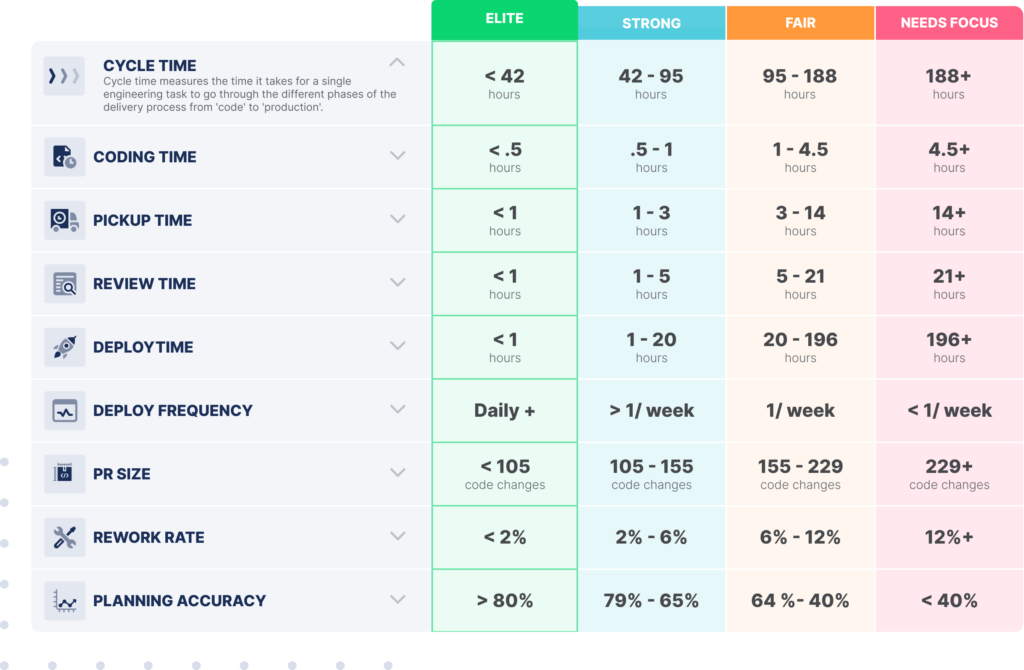
Our research has also identified other key engineering metrics. We studied 1,971 software development teams and 847k branches to establish the engineering benchmarks you can see in the table below:
 Want to learn more about being an elite engineering team? Check out this blog detailing our engineering benchmarks study and methodology.
Now that we have all these metrics, let’s look at which ones you can leverage to improve your code quality.
Lagging Indicators Are Good…
Lagging indicators will change after you deploy your code into production.
The two most effective lagging indicators are Change Failure Rate (CFR) and Mean Time to Restore (MTTR), both of which are DORA Metrics.
Change Failure Rate measures how often a code change results in a failure in production. A high CFR indicates that buggy code is being regularly merged into the source code.
Mean Time to Restore is the average amount of time it takes to recover from an incident. One way to look at MTTR is that it tells you the severity of the bugs being introduced. Are they quick fixes or more widespread problems?
 LinearB provides DORA metrics right out of the box so you can discover your DORA metrics in minutes. Get started today!
…But Leading Indicators Are Better
The issue with lagging indicators is that they let you know of issues after they occur and have already caused problems for your users.
In contrast, leading indicators measure the quality of your code before it goes into production.
This enables you to take action that will prevent bugs and system outages and achieve high quality software without harming the user experience. Another benefit of leading indicators is that they shine more light on the causes of bad code. This means that examining your leading indicators helps you to cure the causes of bad code, not just mitigate their impacts.
Here are three well-established leading indicators:
- Cyclomatic complexity: This measures the number of possible execution paths in a piece of code. Code with a high cyclomatic complexity is harder to understand and therefore harder to debug, maintain, and build upon.
- Halstead complexity measures: These are a common way to measure the structural complexity of some code. They’ve been around for a while, but they’re less popular than they once were because the needs of modern software are different than when Maurice Howard Halstead created his measures in 1977.
- Test coverage: This tells you the percentage of your code that is executed while it is going through unit tests. The higher the test coverage, the more confidence you can have that your code does not contain bugs.
There are many more leading indicators, all of which are available in LinearB:
- Work In Progress (WIP): WIP tells you how much is on a developer’s plate. If a developer has a high amount of WIP, this increases the chances that they had to rush and they ended up writing sub-par code.
- PR Size: A large PR means that there are more distinct things that the author implemented, which increases the chances that they overlooked something. Large PRs are also harder to review for errors and code smells. (By the way, our research found that the best teams keep their PRs under 225 lines of code.)
- Review Depth: A shallow code review suggests that the reviewer did not thoroughly review the code, increasing the chances that buggy code that fails to follow coding standards will make its way into production.
- Merges Without Review: A PR with no reviews means that no one but the author checked it over. This is super risky because even the best developers can make mistakes that can cause big problems.
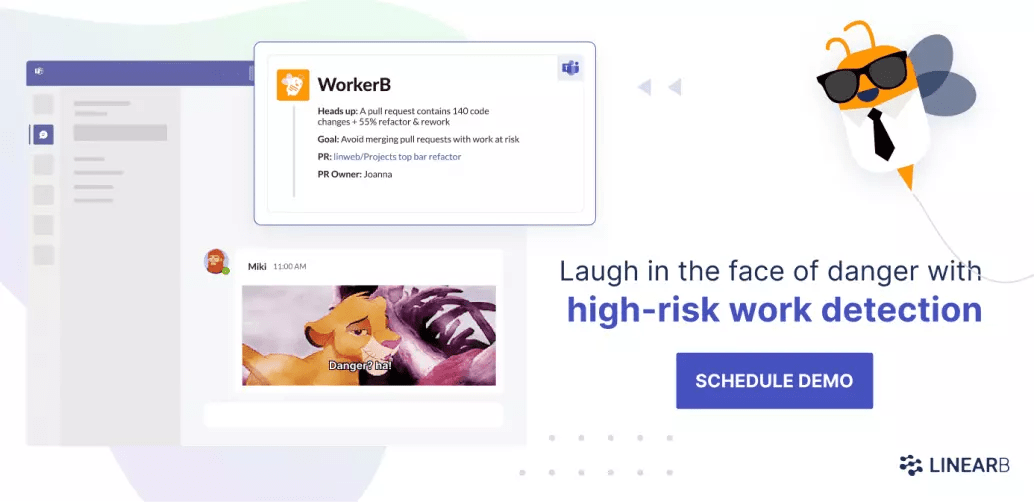
- High Rework Rate: A high rework rate indicates that a PR has redone a lot of recently-shipped code. This means that the new code is going to touch a lot of the application, which means that it needs to be thoroughly reviewed. LinearB’s WorkerB automation bot can flag high risk work so that you can be sure it gets the attention it deserves.
 Want to eliminate risky behavior around your PRs? Book a demo of LinearB today.
The Four Steps to Improve Code Quality Metrics
Now that we’re familiar with the different metrics you can use to measure code quality, let’s walk through the concrete steps you can follow to start improving code quality in your teams.
1. Benchmark Your Current Metrics
Before anything, you need to know where you stand right now. With LinearB, you can get clear measurements of key engineering metrics and then compare them to our engineering benchmarks.
2. Set Goals For Your Team
Once you’ve benchmarked your metrics, you can pick out which ones need work. It’s best to pick these as a team so that there is a shared sense of ownership.
LinearB’s Team Goals tool helps you set goals then track your progress against them. It’ll keep your teams accountable, focused, and motivated to improve.
We recommend picking 1 or 2 metrics to work on at a time. Anymore than that, and it’s overwhelming. A solid goal is to aim to boost performance by one tier over a quarter. For example, if you currently have a “fair” PR size, you could aim to boost this to “strong” over the next quarter.
3. Drive Toward Success
Once you set your goals, the task is then to execute. LinearB’s WorkerB automation bot helps you to do this. It will inform you when something happens that is going to work against the attainment of your goals. For example, if you’re trying to reduce PR size, then you can ask WorkerB to notify you when a large PR is created. You can then intervene right away.
 Improve your code quality and developer workflow with smaller pull requests. Get started with your free-forever LinearB account today.
4. Keep In Mind the Bigger Picture
While it’s important to be focused on specific goals to improve software quality, it is also important to keep in mind the bigger picture. Ultimately, the success of an engineering org, and the company as a whole, depends upon how much value you’re creating for your customers.
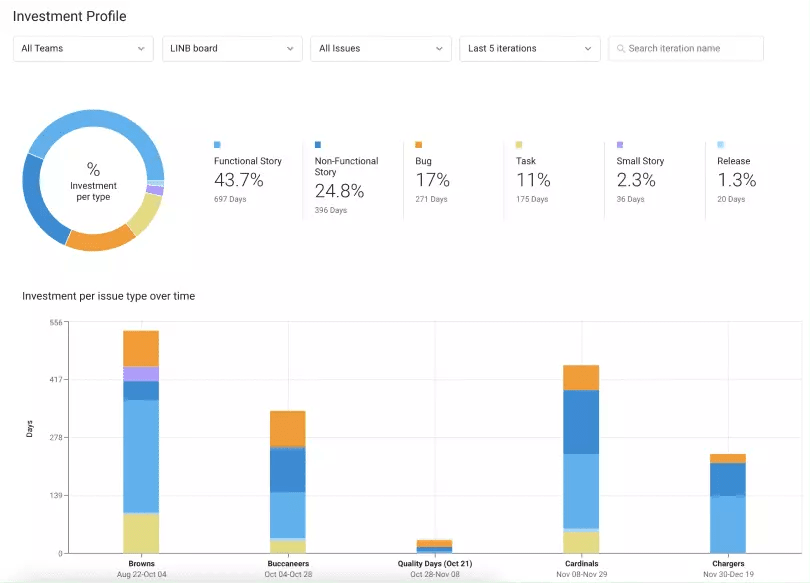
LinearB enables you to connect the work that your engineers are doing with the goals of the business. You can see things like how much work went into specific issues, epics, and projects and whether that work was spent fixing bugs, paying off technical debt, refactoring legacy code, or shipping new features.

It’s also essential to help your developers see this bigger picture. This will foster cross-company alignment, and it will motivate your teams. When they can appreciate the importance of their work, they will be driven to execute better and to take on projects that can make the most valuable contributions.
Recently on the Dev Interrupted podcast, Kathryn Koehler, Director of Product Engineering at Netflix, explained how giving your developers more context is all part of treating them like adults and empowering them to make decisions:
Conclusion
It’s easy to say that high quality code is important. It’s much harder to actually improve the quality of code that a team ships.
I hope that this blog post has made it easier. With the right metrics, you can get a handle on the subjective term “quality.” With LinearB, it’s a breeze to start leveraging metrics, as well as additional tools like Team Goals and our WorkerB automation bot, to drive improvements in your teams.


