The Dawn of Generative AI Code
By the end of 2024, Generative AI is projected to be responsible for generating 20% of all code – or 1 in every 5 lines.
Nearly every engineering team is thinking about how to implement GenAI into their processes (and measure AI metrics), with many already investing in tools like Copilot, CodeWhisperer or Tabnine to kickstart this initiative.
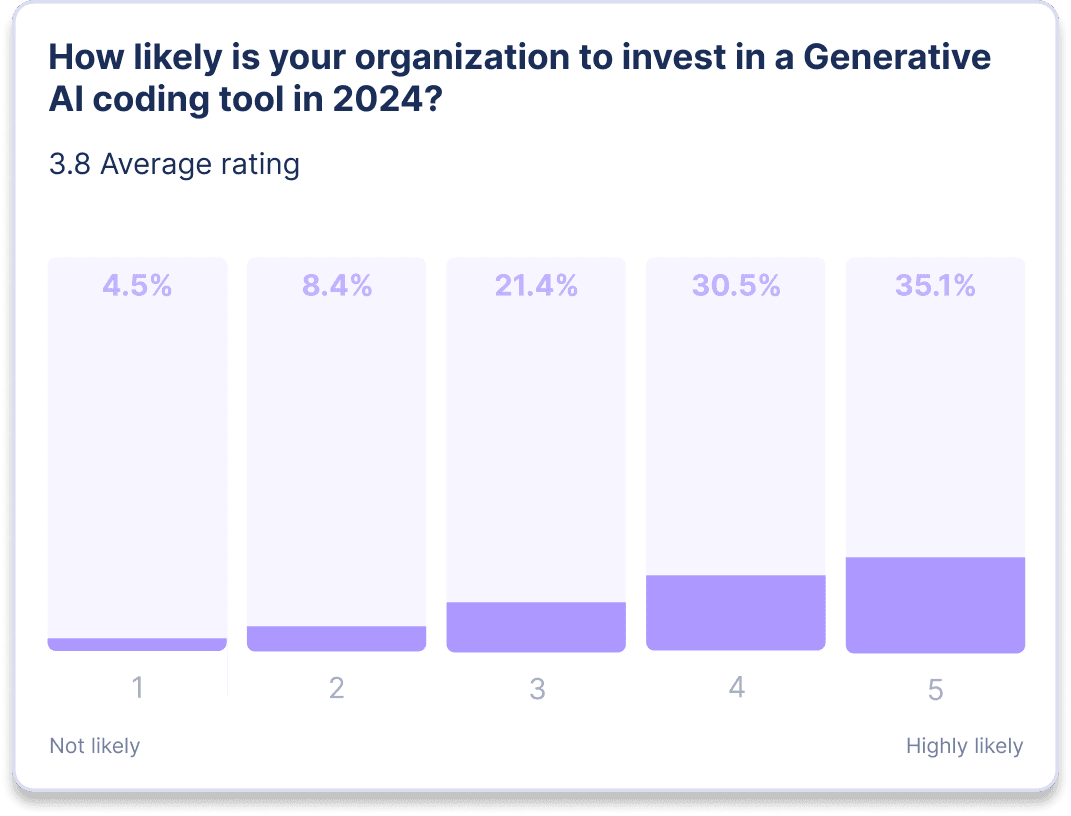
In fact, our survey revealed that 87% of participants are likely or highly likely to invest in a GenAI coding tool in 2024.
As with any new tech rollout, the next question quickly becomes: how do we measure the impact of this investment? It’s every engineering leader’s responsibility to their board, executive team, and developers alike to zero in on an answer and report their findings.
At LinearB, we like to break this question of impact into the following three categories:
- Adoption
- Benefits
- Risks
In this year’s GenAI Impact Report, we break down each of these categories in detail, share key insights from our survey, and explain how to track the best AI performance metrics that measure the impact GenAI has on the software delivery process.
The following data was compiled from a study of 150+ CTOs, VPs of Engineering, and Engineering Managers – hailing from start-ups and Fortune 500 companies alike.
We hope that you’ll walk away from this report not only understanding how you can start measuring AI metrics as well as the impact of GenAI code, but also the mindset of your peers heading into 2024.
Generative AI Metrics: Adoption, Benefits and Risks
As previously mentioned, it can be useful to break Generative AI metrics into the following three categories:
1.) Adoption
2.) Benefits
3.) Risks
Adoption
Many engineering leaders are managing dozens, if not hundreds of developers, making it nearly impossible to manually monitor usage of any new tool, let alone one as all-encompassing as GenAI.
Once you’ve started using AI for software development – or even if you’re still considering rolling out a tool like Copilot – there are three main questions you’ll want to answer:
- What AI metrics should we be tracking?
- What use cases are we solving with GenAI?
- Which parts of my codebase are being written by a machine? New code? Tests?
- Is my team actually using this? If yes, to what extent? Are we scaling our usage over time?
As a baseline, tracking the number of Pull Requests (PRs) Opened that have GenAI code is a great place to start measuring adoption.
By studying this metric across various segments of your engineering org – and across different timelines – you can answer more advanced questions about adoption, like:
- Which devs, teams or groups are adopting GenAI the fastest?
- Is adoption still growing, has it plateaued or is it tapering off after initial excitement?
- Which parts of the codebase (e.g. repositories, services etc.) are seeing the highest adoption? Are our AI metrics at a healthy level?
Benefits
Then, there’s the question of benefits – is GenAI actually helping my team the way I expected it to?
In theory, a GenAI tool that’s writing chunks of code for your team should be reducing coding time and speeding up simple tasks. As such, you’ll want to evaluate your team’s throughput and velocity to answer the following questions:
- Are we getting the intended benefits from GenAI?
- Is my team moving faster as a result?
- Are we actually shipping more value?
There are several AI metrics you can track here:
Coding Time – The time it takes from first commit until a PR is issued. This metric can help you understand whether GenAI is actually helping to reduce the amount of time it's taking developers to code. Ideally, you’ll see a decrease in this metric as GenAI adoption grows.
Merge Frequency – How often developers are able to get their code merged to the codebase. Merge Frequency captures not just coding time, but also the code review dynamic. This metric can help you understand whether GenAI is helping your developers move faster – a higher merge frequency indicates faster cycles.
In addition, use Completed Stories to track an increase in story delivery velocity, and Planning Accuracy to track improved predictability in your sprints – two possible, though indirect, benefits of introducing GenAI into your coding process.
Risks
Along with GenAI adoption and benefits, there are some important risks to track as well. Besides common concerns about security, compliance and intellectual property, the adoption of GenAI for coding heralds a fundamental change in the “shape” of your codebase. While it allows for much faster creation of code, are your review and delivery pipelines ready to handle this? It is essential that you’re able to gauge how your team's processes are being impacted so you can get ahead of any risks before they affect delivery.
Now, let’s get into some core AI metrics to track here.
PR Size – GenAI makes it easy to generate code. An inflation in average PR size is an early indicator of inefficiencies, as larger PRs are harder and slower to review, and far more risky to merge and deploy. Track PR Size to ensure your teams’ GenAI PRs aren’t bloating.
Generated code is, in many cases, more difficult to review. It’s harder for the PR author to reason about it and defend it - since they didn’t actually write the code themself. Use the Review Depth and PRs Merged Without Review metrics to ensure GenAI PRs get proper review, and the Time to Approve and Review Time metrics to check for increased bottlenecks in your review pipeline.
Finally, use Rework Rate to understand if there is an increase in code churn, and Escaped Bugs to track overall quality trends.
Survey Results
Adoption Status
The writing is on the wall: GenAI is poised to revolutionize the software delivery landscape as we know it, with massive implications around the way developers will write, test and ship code for years to come.
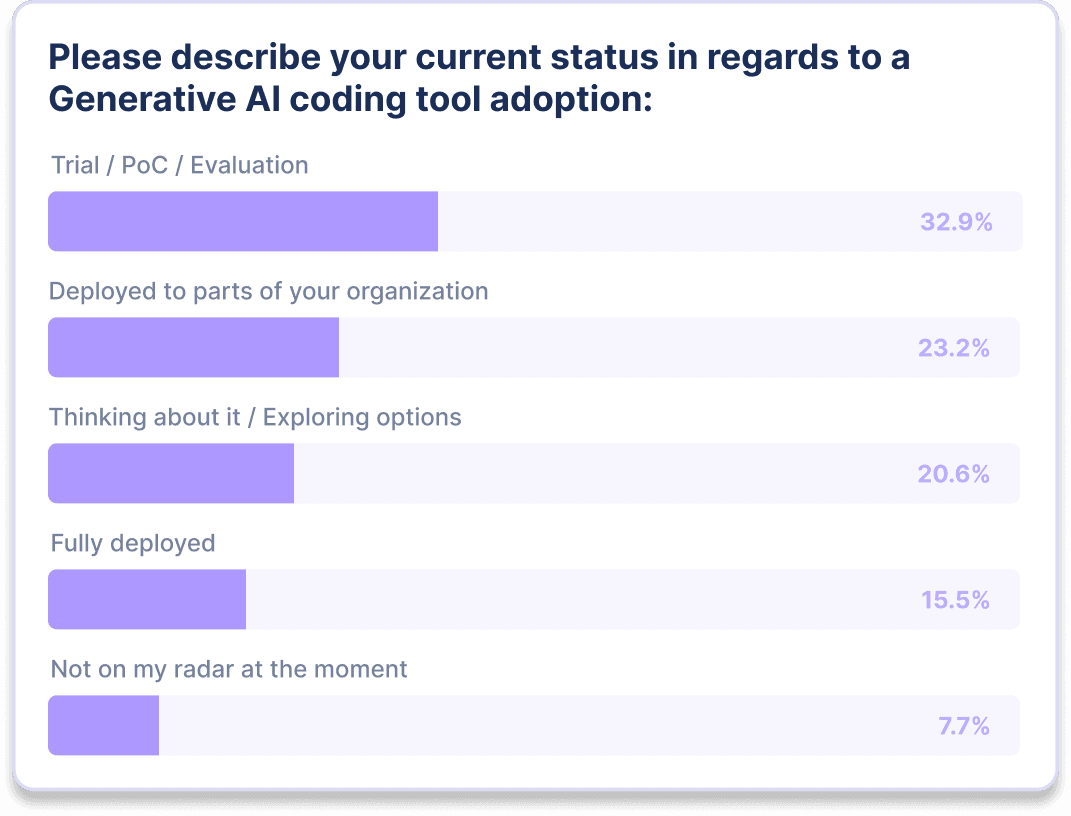
Our survey revealed that 87% of Orgs are planning to invest in a GenAI tool in 2024. Additionally, 71.6% of Orgs are currently in or through a GenAI tool adoption process.

Use Case by Adoption
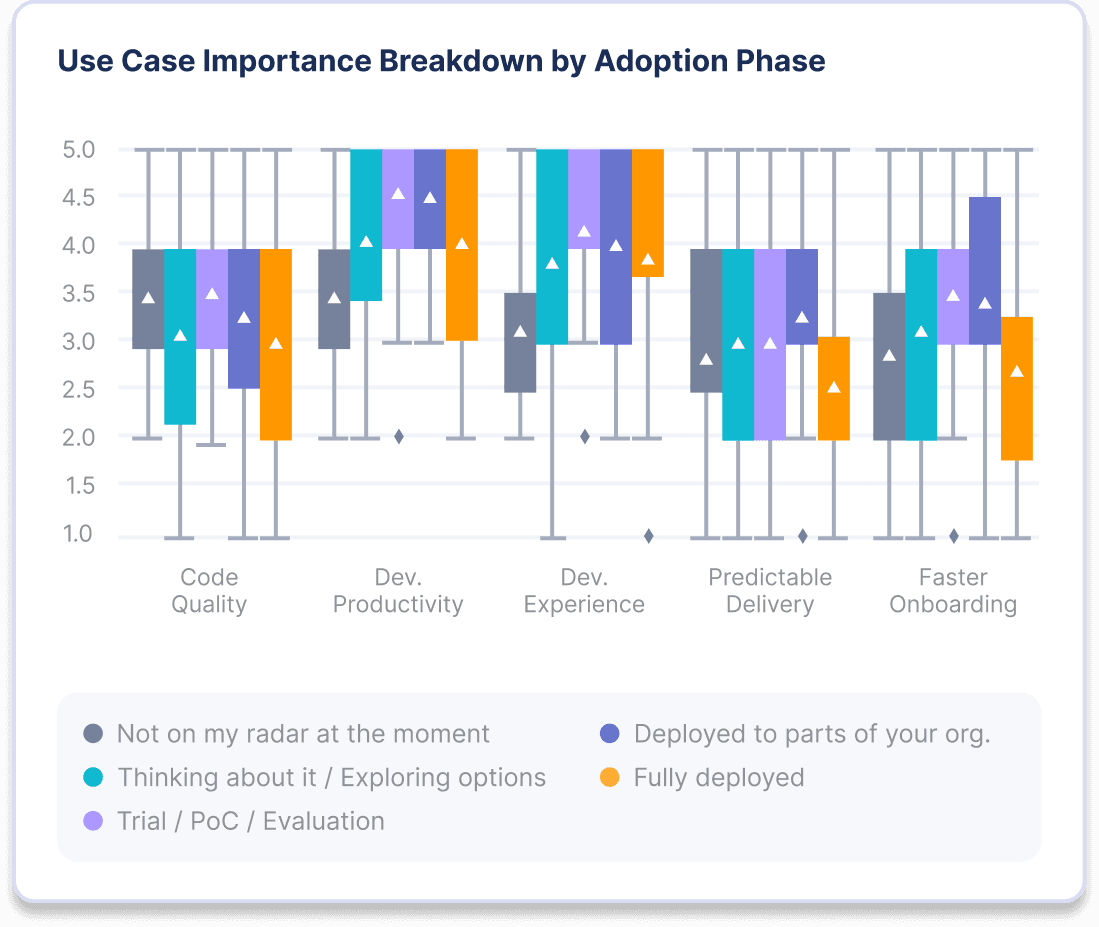
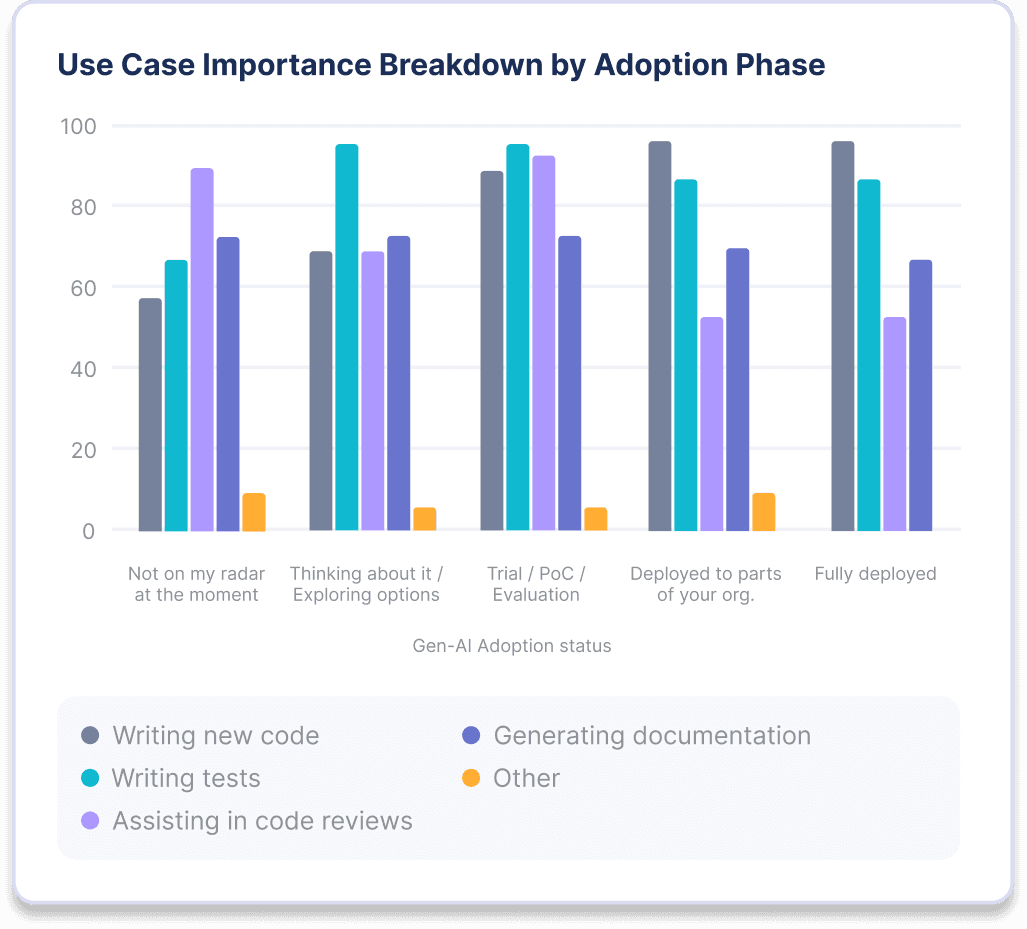
We polled our survey participants on key GenAI use cases, as well as their adoption for each one.
Organizations who are further along in their GenAI tool adoption journey see Developer Productivity and Developer Experience as their key use cases.
Code Quality and Assisting in Code Reviews as use cases lose luster further down the adoption journey.
Measuring Impact
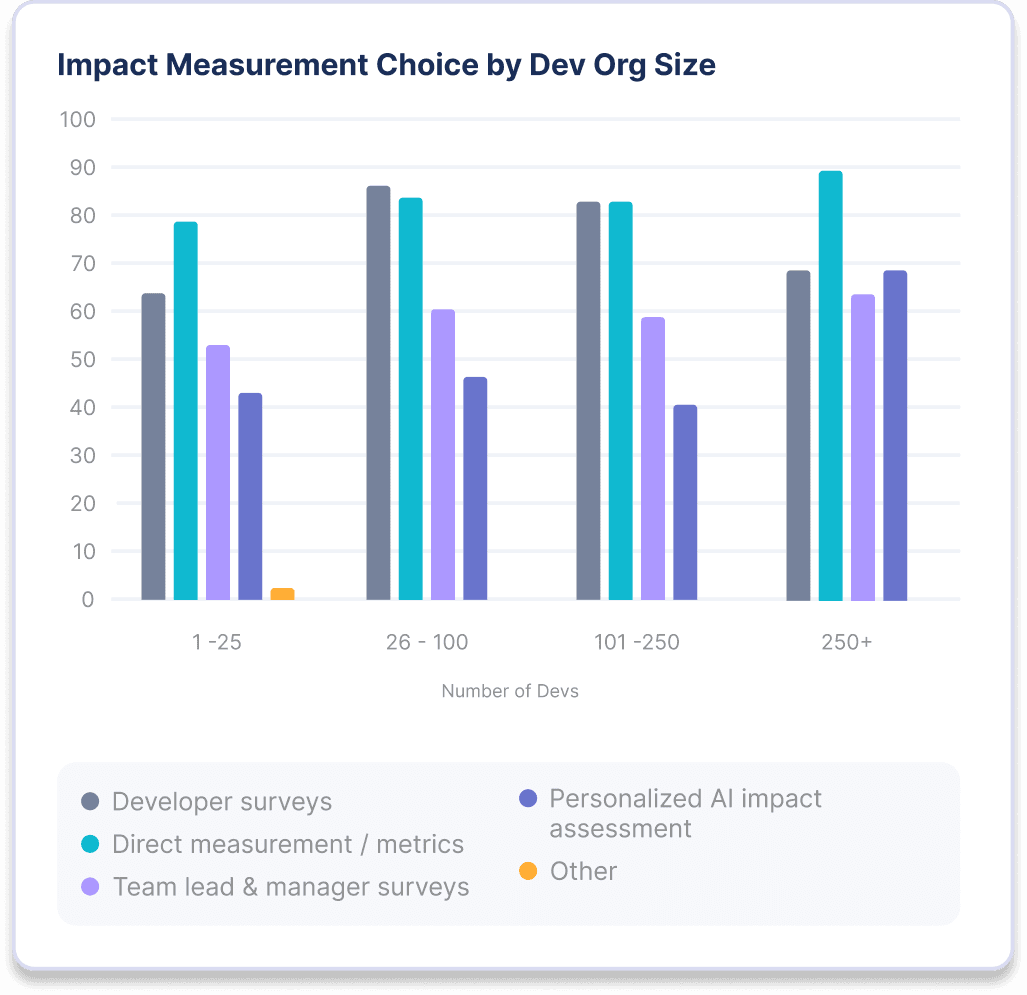
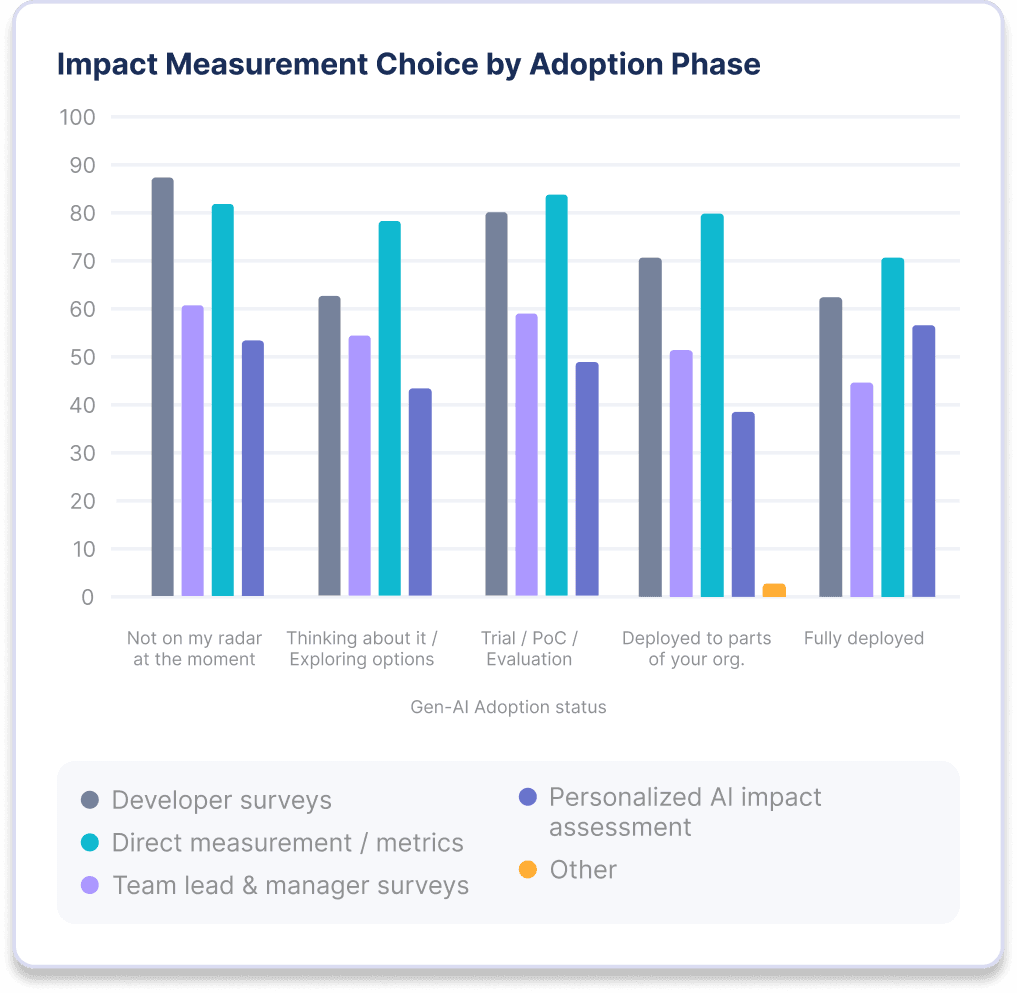
In terms of measuring impact, our results revealed that both larger companies and organizations further in their adoption journey prefer direct (hard) AI metrics of the impact of their GenAI Code tools vs. qualitative (soft) surveys.
It’s also important to point out that organizations further along in their GenAI journey seem to rely less on surveys than ones who have not yet started. Additionally, team leads and manager surveys are an unpopular method – except at larger organizations.
Risks: Perceived vs. Reality
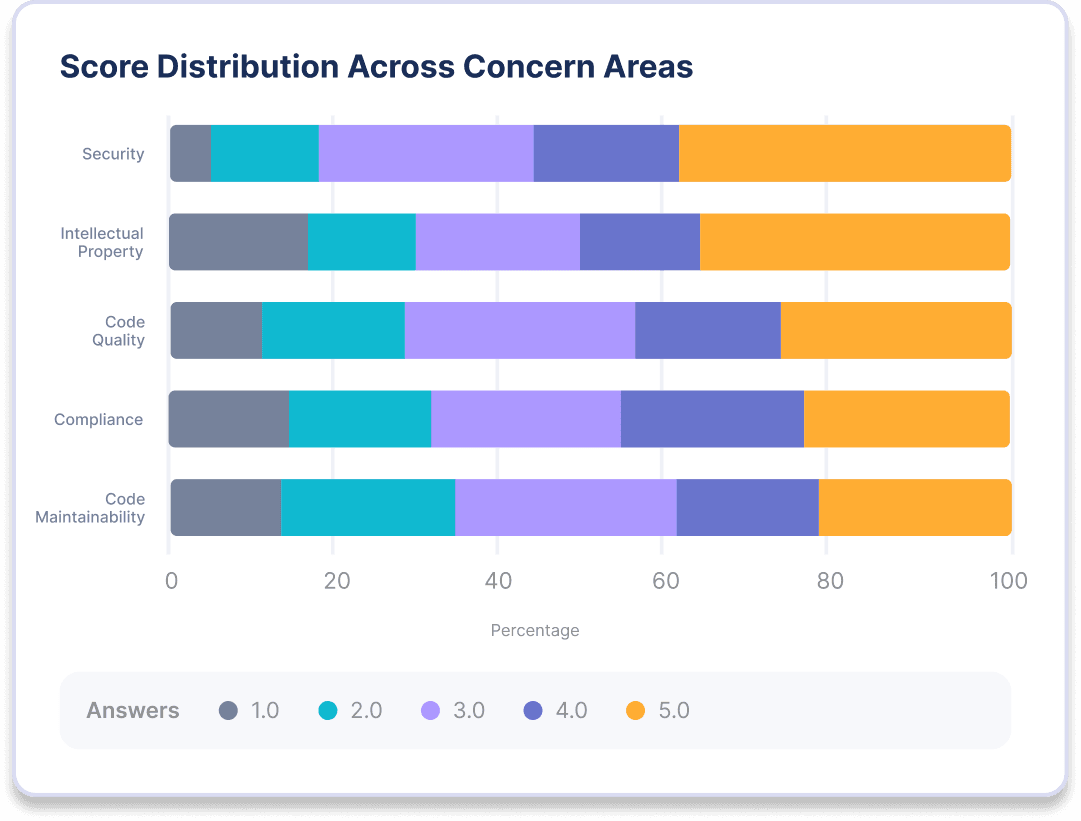
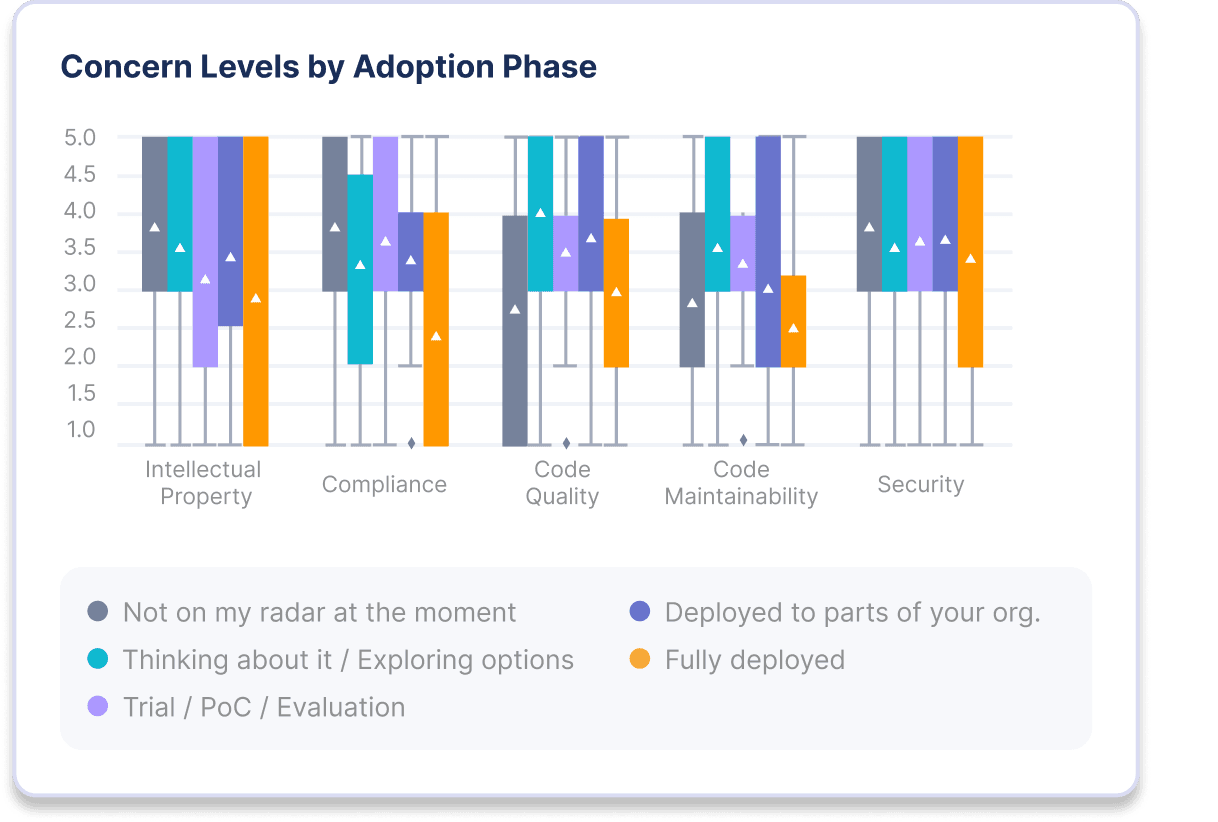
To dive deeper into the perceived risks of GenAI code, we asked our survey participants to rate the following concerns about using a GenAI coding tool from 1-5 (1 being Not Concerned and 5 being Highly Concerned): Security, Intellectual Property, Code Quality, Compliance, and Code Maintainability.
In our data, we found that:
Security is the top concern for all – followed by Compliance / Quality / IP.
Risk levels drop across the board as adoption grows with IP and Compliance taking the biggest hits.
AI Metrics
This is likely the point where you’re asking questions like: ‘How to choose the right AI metrics for your project?’ and ‘How do you measure AI performance?’
In this section, we’ll break down the most important Generative AI metrics broken down by adoption, benefits, and risks – and then we’ll talk you through how our team is measuring them today.
With LinearB, engineering leaders can track a custom dashboard with all of the below AI metrics, so they can evaluate the status of their GenAI initiative at any given point in time.
Generative AI Metrics: Adoption Pull Requests Opened: A count of all the available pull requests issued by a team or individual in all the repositories scanned by LinearB, during a selected time frame. Pull Requests Merged: A count of all the available pull requests merged by a team or individual in all the repositories scanned by LinearB, during a selected time frame. |
Generative AI Metrics: Benefits Merge Frequency: The average number of pull or merge requests merged by one developer in one week. Elite merge frequency represents few obstacles and a good developer experience. Coding Time: The time it takes from the first commit until a pull request is issued. Short coding time correlates to low WIP, small PR size and clear requirements. Completed Stories: A sum of the story points that transitioned to and remained in the “Done” state through the end of a given sprint. Planning Accuracy: The ratio between planned issues and what was actually delivered from that list. |
Generative AI Metrics: Benefits PR Size: The number of code lines modified in a pull request. Smaller pull requests are easier to review, safer to merge, and correlate to a lower cycle time. Rework Rate: The amount of changes made to existing code that is less than 21 days old. High rework rates signal code churn and is a leading indicator of quality issues. PRs Merged Without Review: All the pull requests that were either merged with no review at all, or pull requests that were self reviewed. Pull requests that are merged with either self-review or no review increase the risk of introducing bugs or broken code to production. Review Time: The time it takes to complete a code review and get a pull request merged. Low review time represents strong teamwork and a healthy review process. Time to Approve: The time from review beginning to pull request first approval. |
How LinearB Does It
LinearB’s approach to measuring adoption, benefits and risks for GenAI code starts with PR labels. Every pull request that includes GenAI code is labeled, allowing metric tracking for this type of work. From there, you can compare success AI metrics against the unlabeled PRs.
Engineering leaders have two main options when it comes to labeling PRs withGenAI code:
- Manual Labeling
- Workflow Automation with gitStream
The first option, albeit time-consuming, is certainly doable. To start, ask your team to manually label all PRs that they authored with GenAI. Or you can create a team of all contributors with a Copilot or Tabnine seat.
From there, you can conduct an analysis that compares quality AI metrics and efficiency AI metrics from before and after your team’s GenAI usage started (more on this later).
Alternatively, you can leverage a workflow automation tool, like gitStream, to auto-label PRs based on criteria such as:
- List of users included in the GenAI experiment
- Hint text in the PR title, commit messages, or PR comments
- You can also use gitStream automation to streamline manual labeling using a Yes/No button and enforce filling out that yes/no info as part of the PR flow.
After selecting one of the above options as your method of tracking GenAI code, it’s time to quantify the impact itself using the AI metrics above.
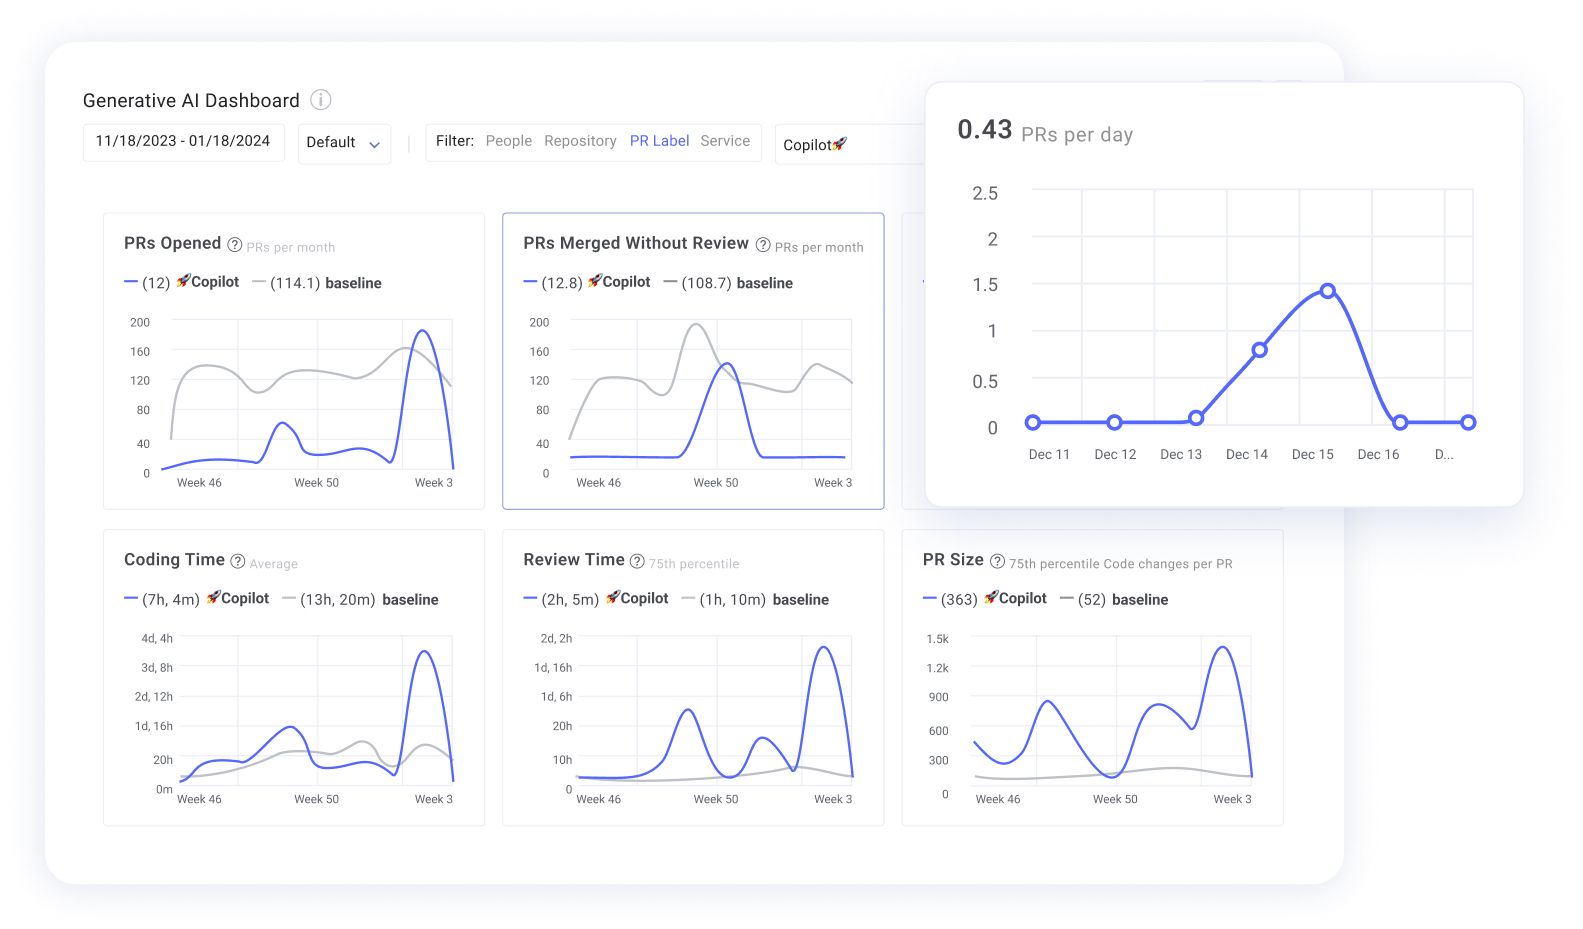
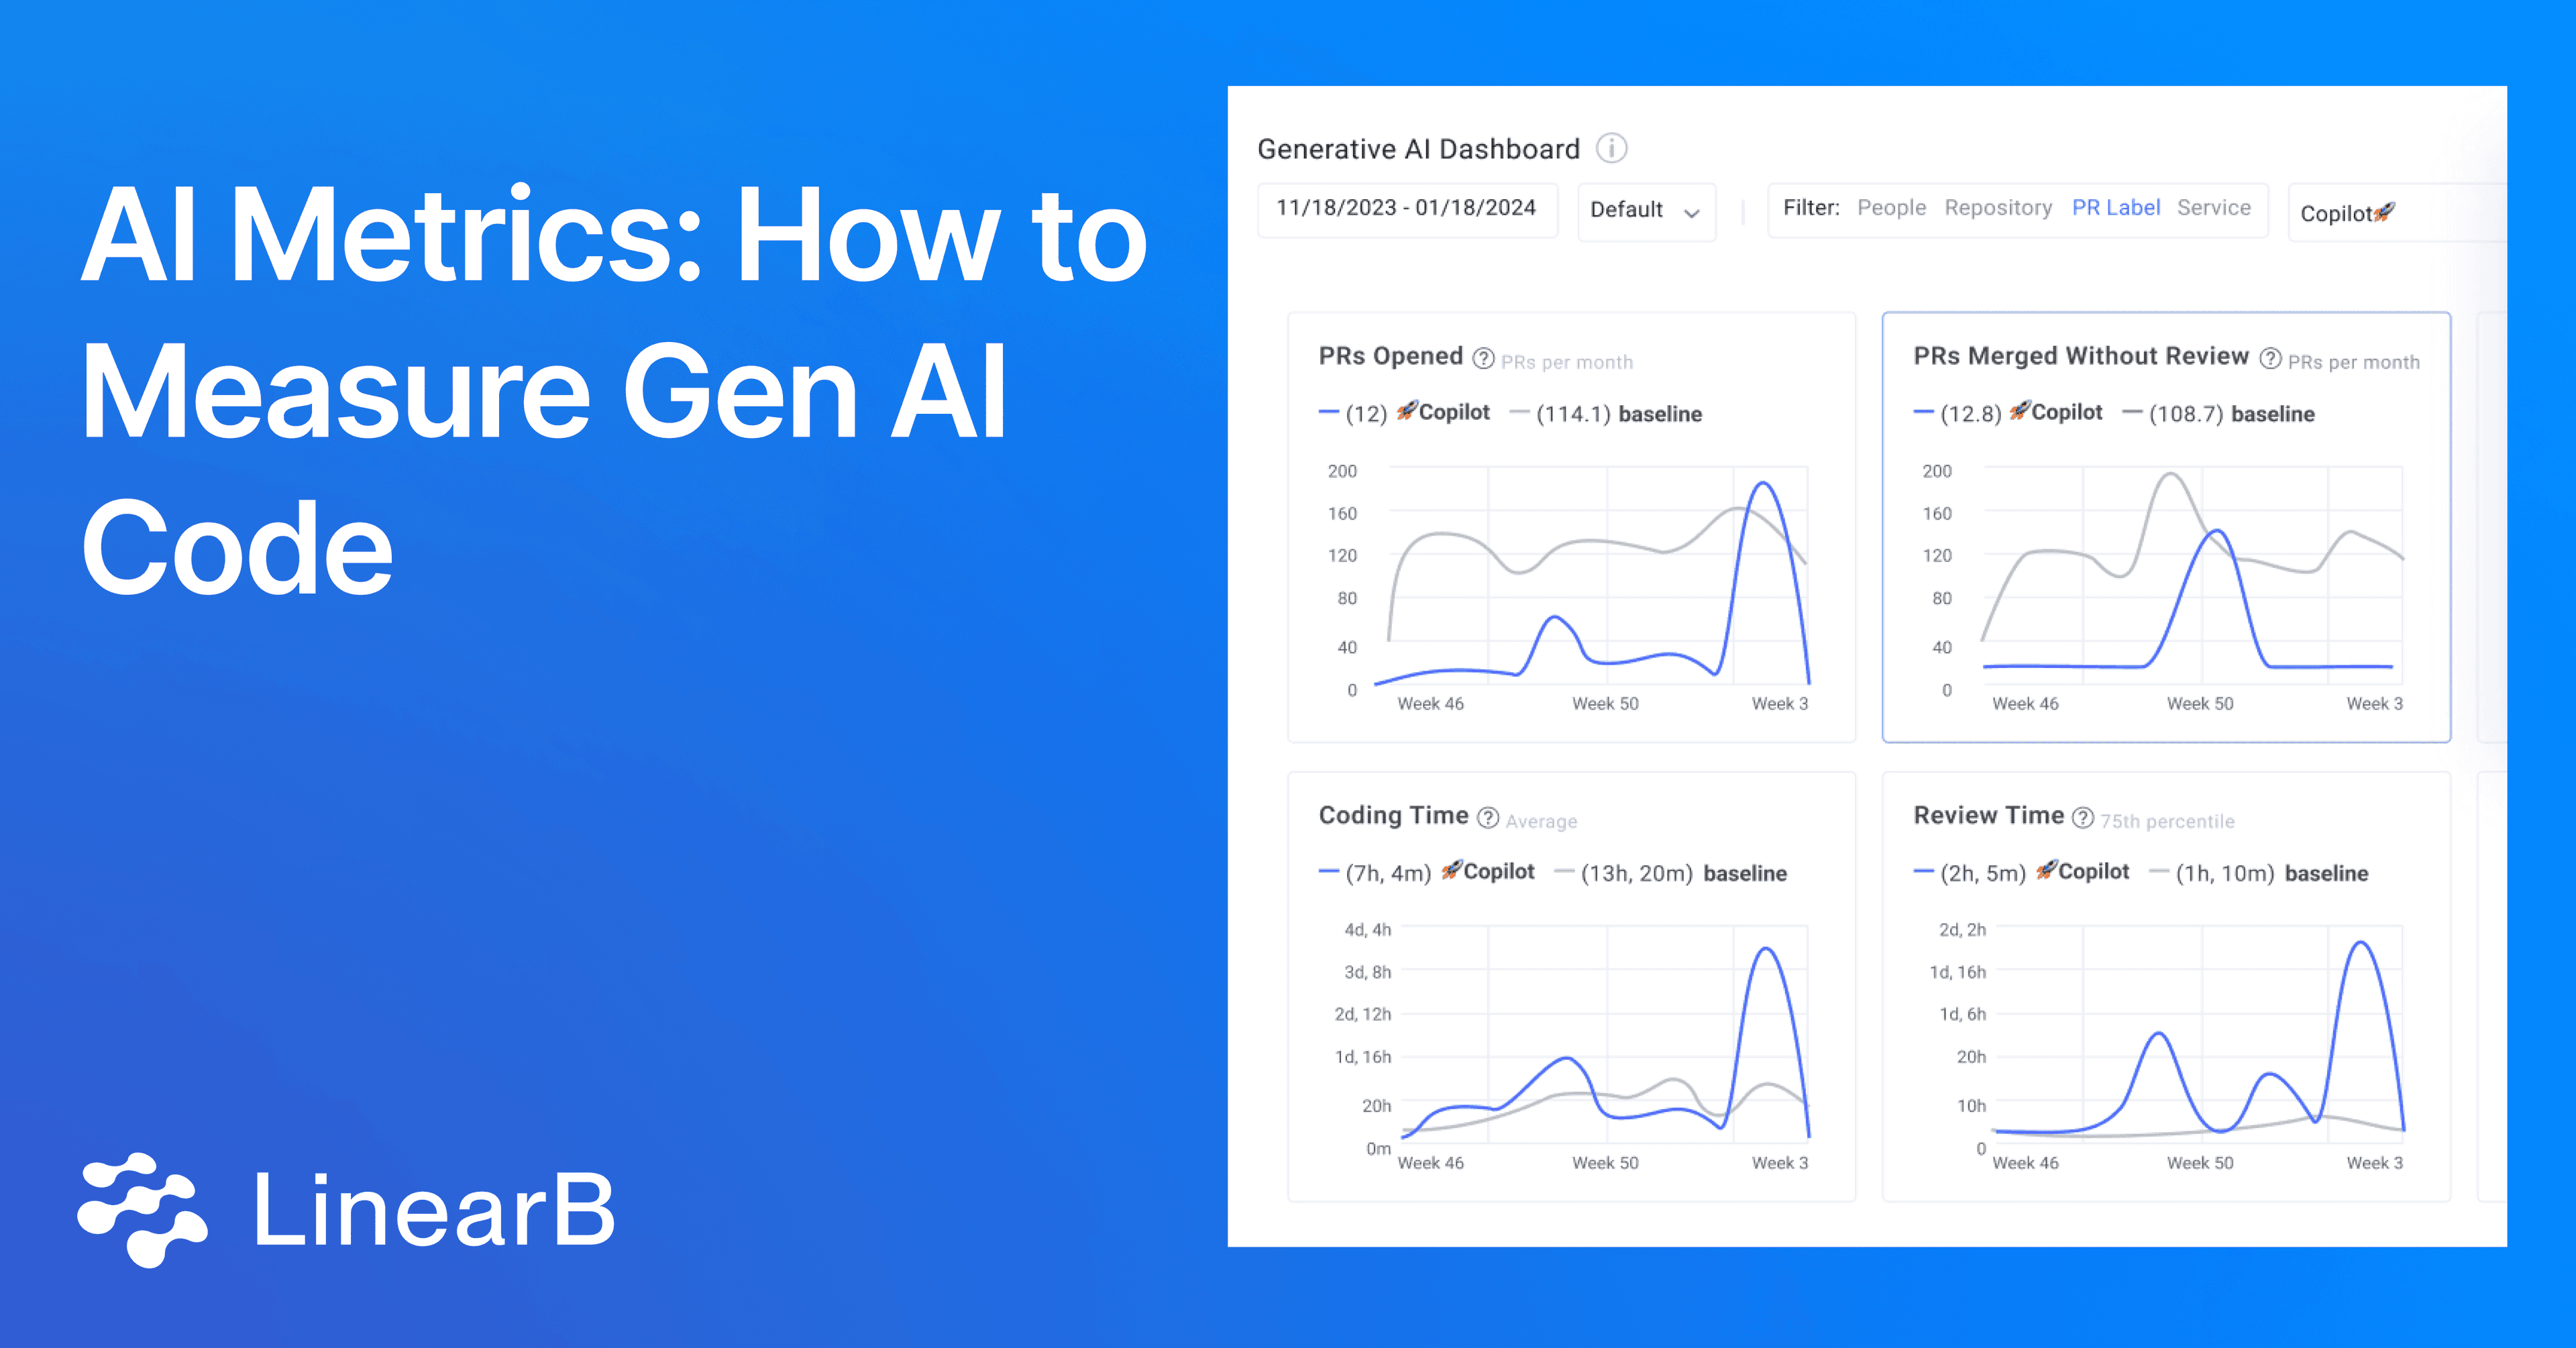
This is our custom GenAI dashboard. Note that we’ve labeled all PRs with a Copilot label in GitHub, and used this PR label in the dashboard filter definition. In this view, the blue line at the bottom represents all PRs with a Copilot label, and the gray line represents all other PRs (our baseline in this case).
Now, let’s take a closer look at the merge without review metric, for example. At LinearB, our engineering team has collectively agreed that no PR written using GenAI should ever be merged without review.
In the graph, you can see that we had a spike in PRs merged without review in November. This is an anomaly that we’d want to investigate further. Whenever we see a trend in our data that doesn’t match our expectations, we drill deeper into our data by clicking on the spike in the graph. This will bring up a list of all the PRs that contributed to this datapoint, so we can take a closer look at all the GenAI PRs we merged without review.
Moving forward, we can also leverage gitStream to block all GenAI code from getting merged without a proper review – doing so will ultimately improve the health of our AI metrics.
The Future of Initiative Tracking
As exciting as it is to talk about the future of the software delivery landscape, the reality is that GenAI is likely just one initiative that you as an engineering leader have in flight right now.
Your mind is probably also spinning about your developer experience initiative, your agile coaching initiative, your AI metrics initiative, your test coverage initiative, your new CI pipeline initiative, etc, etc.
Universal label tracking with gitStream allows you to measure the impact of any initiative you’ve kicked off with your team. This way, you can answer questions like:
- What is the ROI on this new 3rd party tool we bought?
- Should we roll this agile coaching initiative out to the rest of the organization?
- Is changing up my CI pipeline allowing us to speed up our delivery? By how much?
Advocating for more headcount or even for another funding round is much more effective when you can point to a dashboard with tangible engineering results – like a 61% decrease in cycle time for example – that you can trace back to any given initiative, GenAI or otherwise.

