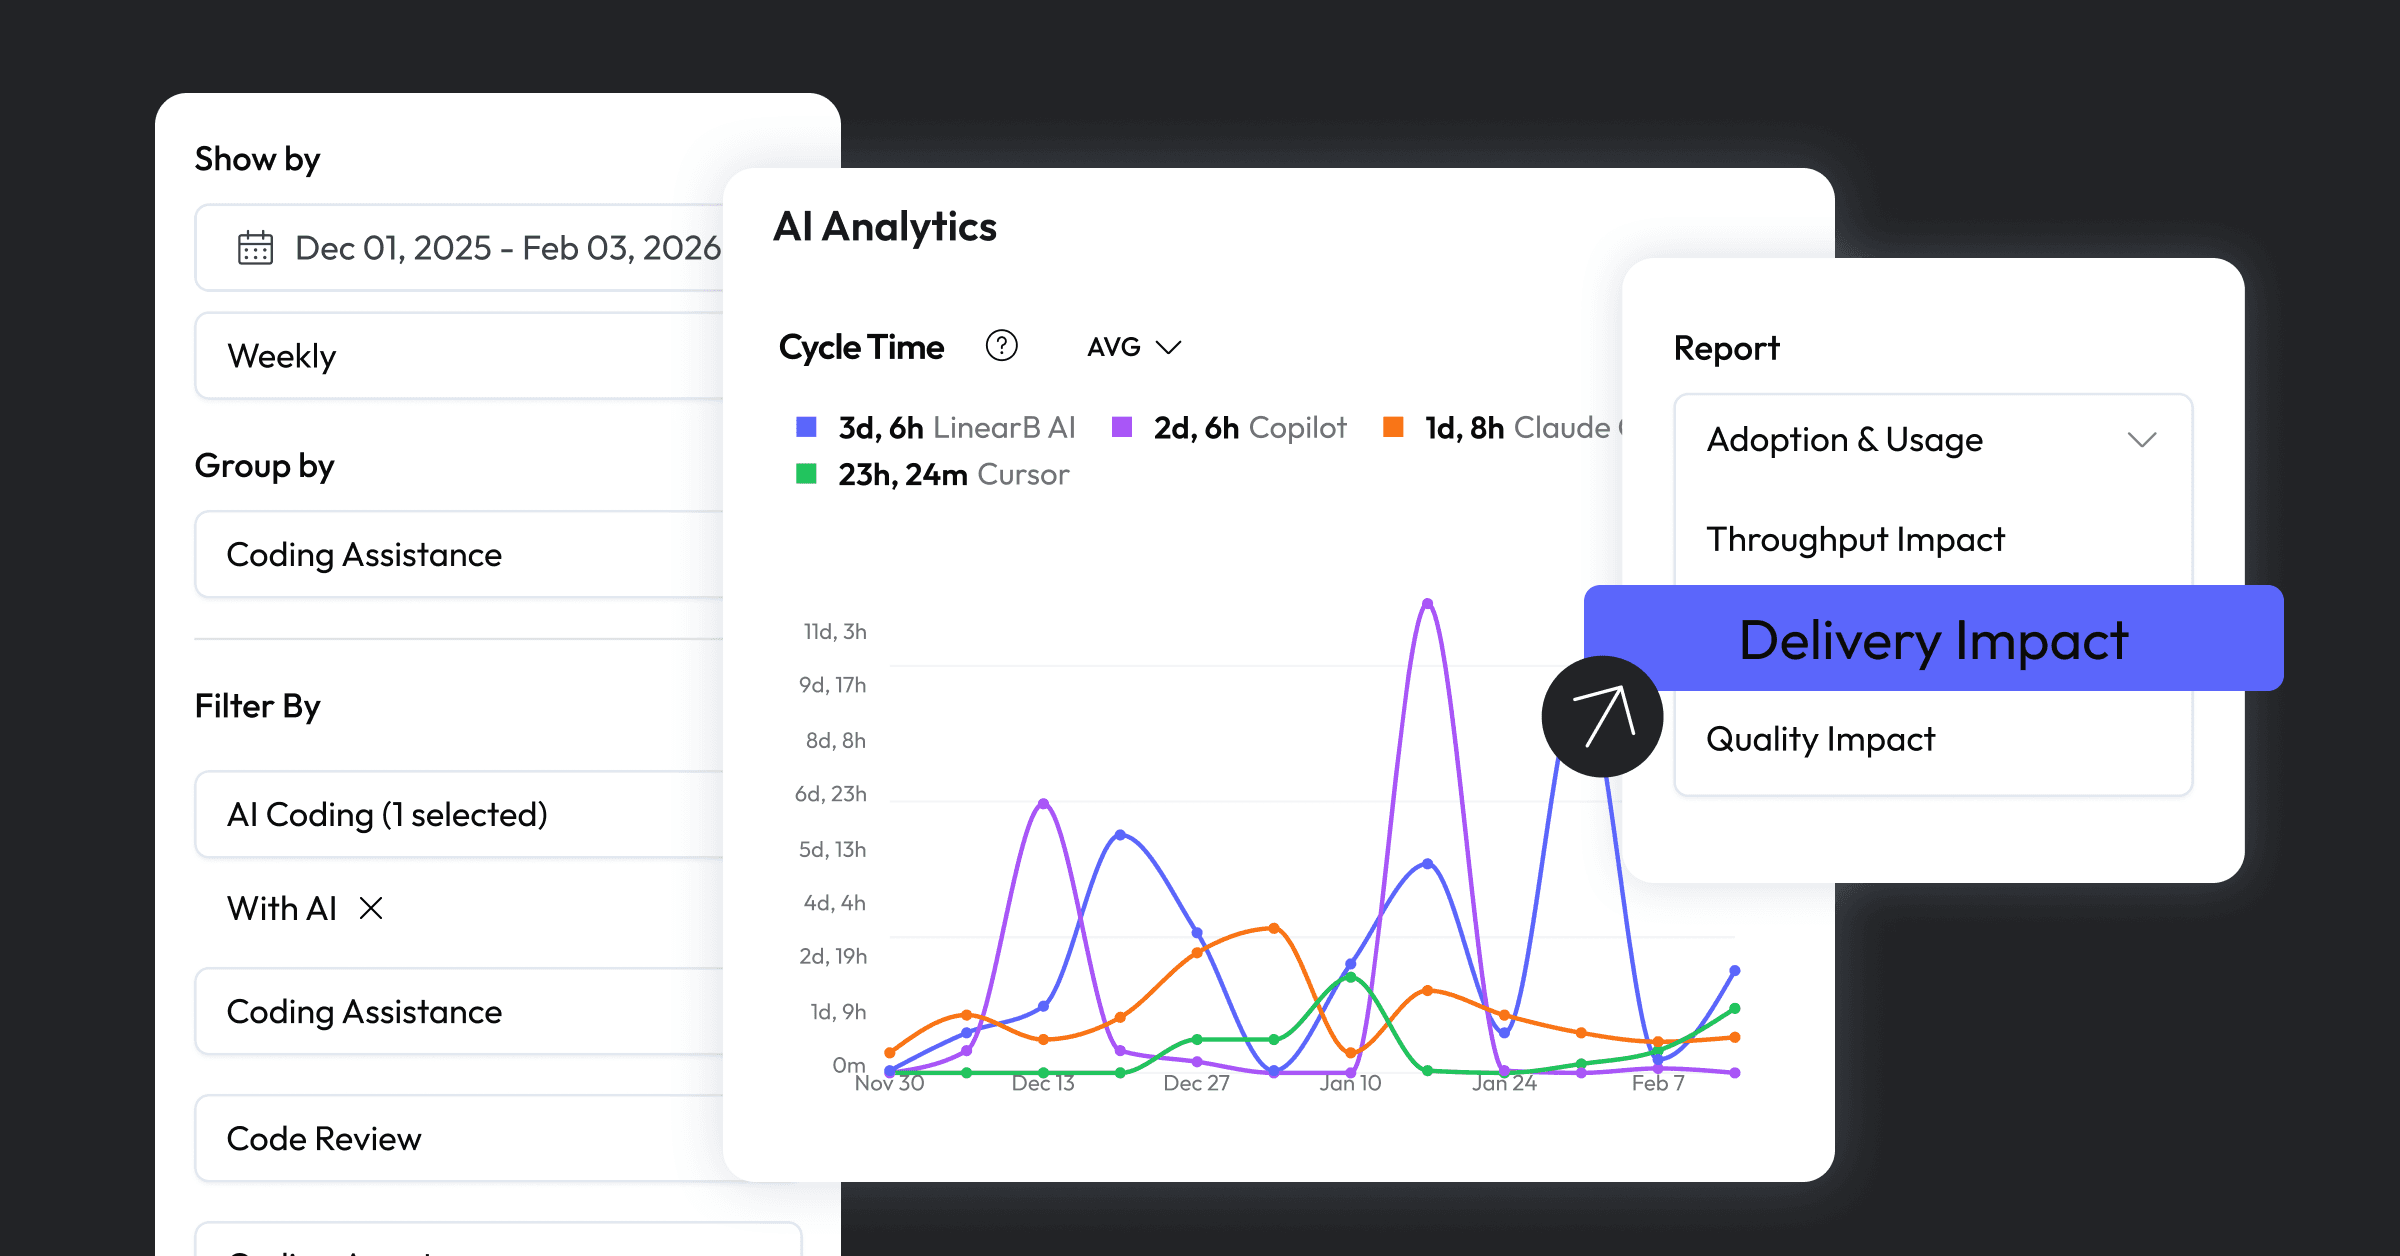
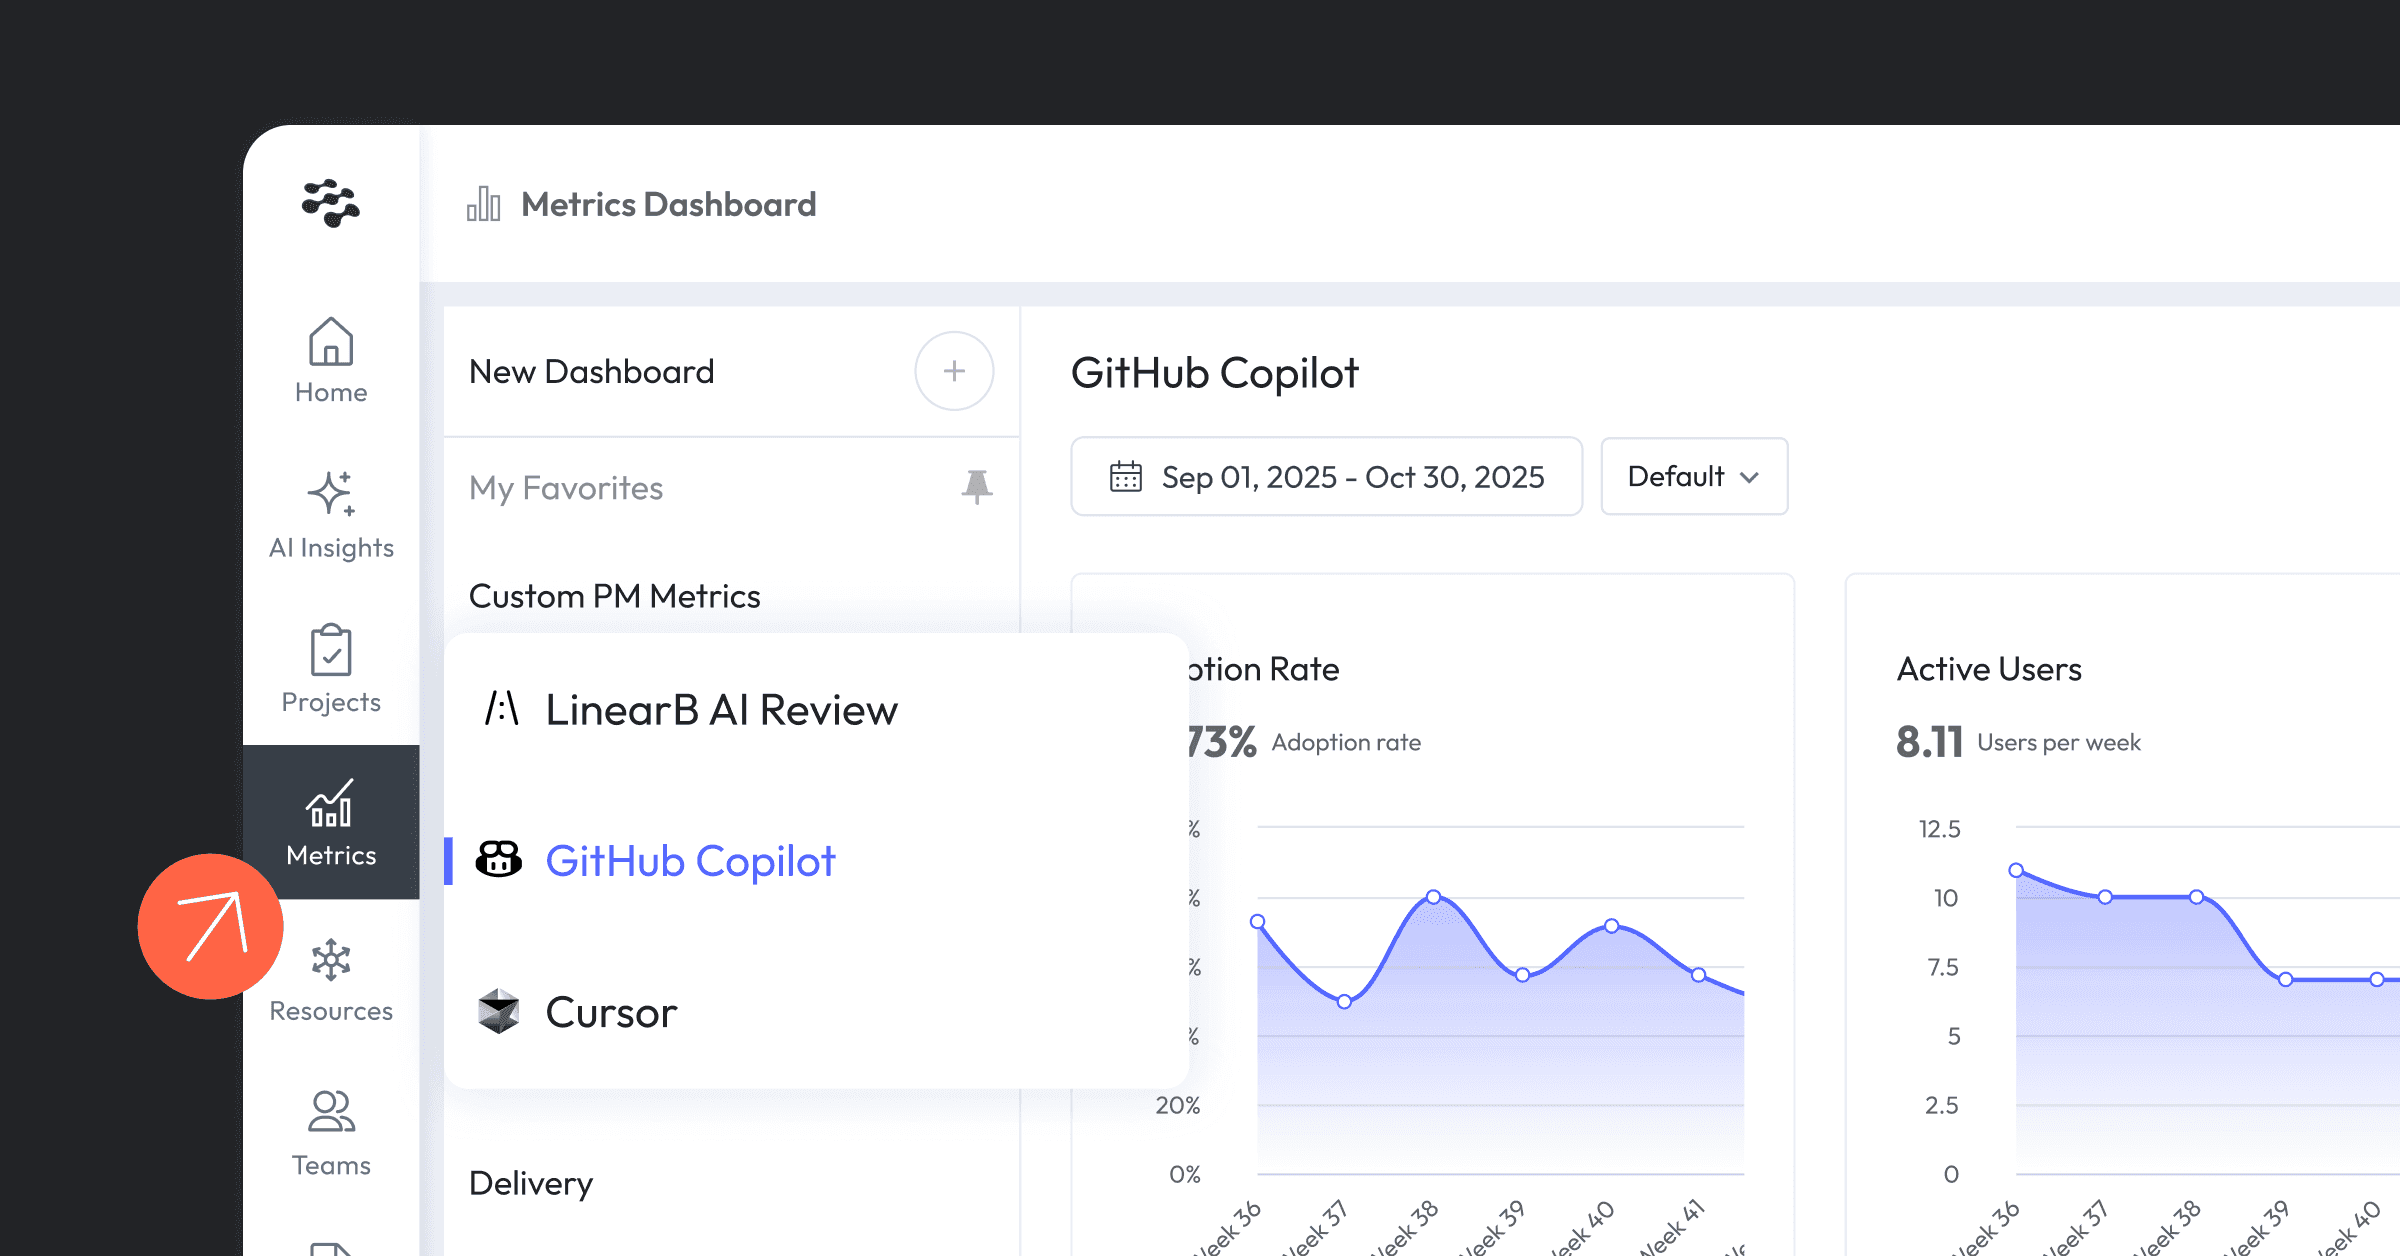
As we wrap up our vacations and get back into our routines, we’ve got a big end-of-summer update: LinearB just released some awesome new features and enhancements that help engineering leaders fulfill their dual mandate of delivering operational excellence and driving better business outcomes!
Teams looking to take their first steps in an improvement journey need to focus on three key areas:
- Delivering a great developer experience
- Building a highly flexible and bespoke engineering metrics program
- Optimizing engineering investment strategy to ensure focus on the right things
The Summer Launch enhancements and new features will help you do that.
Let’s dive into the LinearB Summer Launch!
Significant Developer Experience Enhancements
A key aspect of building a great developer experience is to automate as much as you can, reduce cognitive load as much as possible, and ideally be able to illustrate the impact of those changes.
The latest updates and new features for LinearB and gitStream (powered by LinearB) do just that.
WorkerB Mentions

You’ve just wrapped up a coding session, pushed your final commit, issued a PR, and asked for a review. Congrats!
Some time goes by and someone makes some comments…but you’ve already moved on to the next 5 tasks. Now you have to go to git and re-familiarize yourself with the code and your PR so you can address their feedback.
The cognitive load of this context switch exacts a high price in time and focus, and it can all be avoided with just a little bit of information.
Sound familiar?
Fortunately LinearB and its developer productivity bot, WorkerB solved this problem with WorkerB mentions! Now, when a reviewer tags the PR author in a comment via git, WorkerB will fire a Slack notification that contains:
- The content of the comment (so you don’t have to go to the git provider)
- The person who tagged the user in the comment
- A link to take users to the PR/comment
This all helps improve the developer experience and remove a lot of cognitive load present in the “standard” PR process.
You can learn more about WorkerB here: https://linearb.helpdocs.io/article/6k0uw2e7e3-worker-b-mentions-notifications
Selective CI
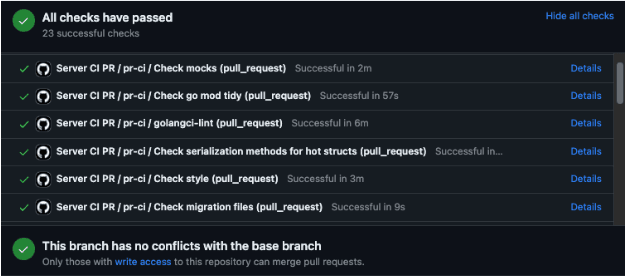
Fun fact: it's not uncommon for organizations to have 10-20 billable CI minutes running for every PR on their repo. That means if an organization averages 20 PRs a day, they will surpass the entry-level paid version of GitHub Actions in about 10 business days. This is especially true given the complexity of some CI processes: they’re often actually two things, like a GitHub action that triggers CircleCI services, for example. So the minutes are ticking by even faster.
If this sounds like it can get expensive and time consuming quickly, you’re absolutely right.
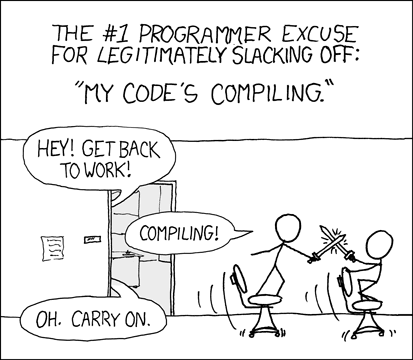
Selective CI–the newest gitStream rule–makes it possible for users to build and test only specified components or modules instead of the entire system. This enables gitStream users to:
- Selectively trigger CI pipelines to reduce merge wait time and cut costs
- Save time and computing power by running tests on smaller code subsets
- Speed up the development cycle with quicker feedback on changes made - catch bugs earlier in the development cycle when they are easier and cheaper to fix
- Improve overall code quality by encouraging developers to write smaller, more modular code that is easier to test and maintain
Want to try gitStream? Get started here!
gitStream ROI Insights
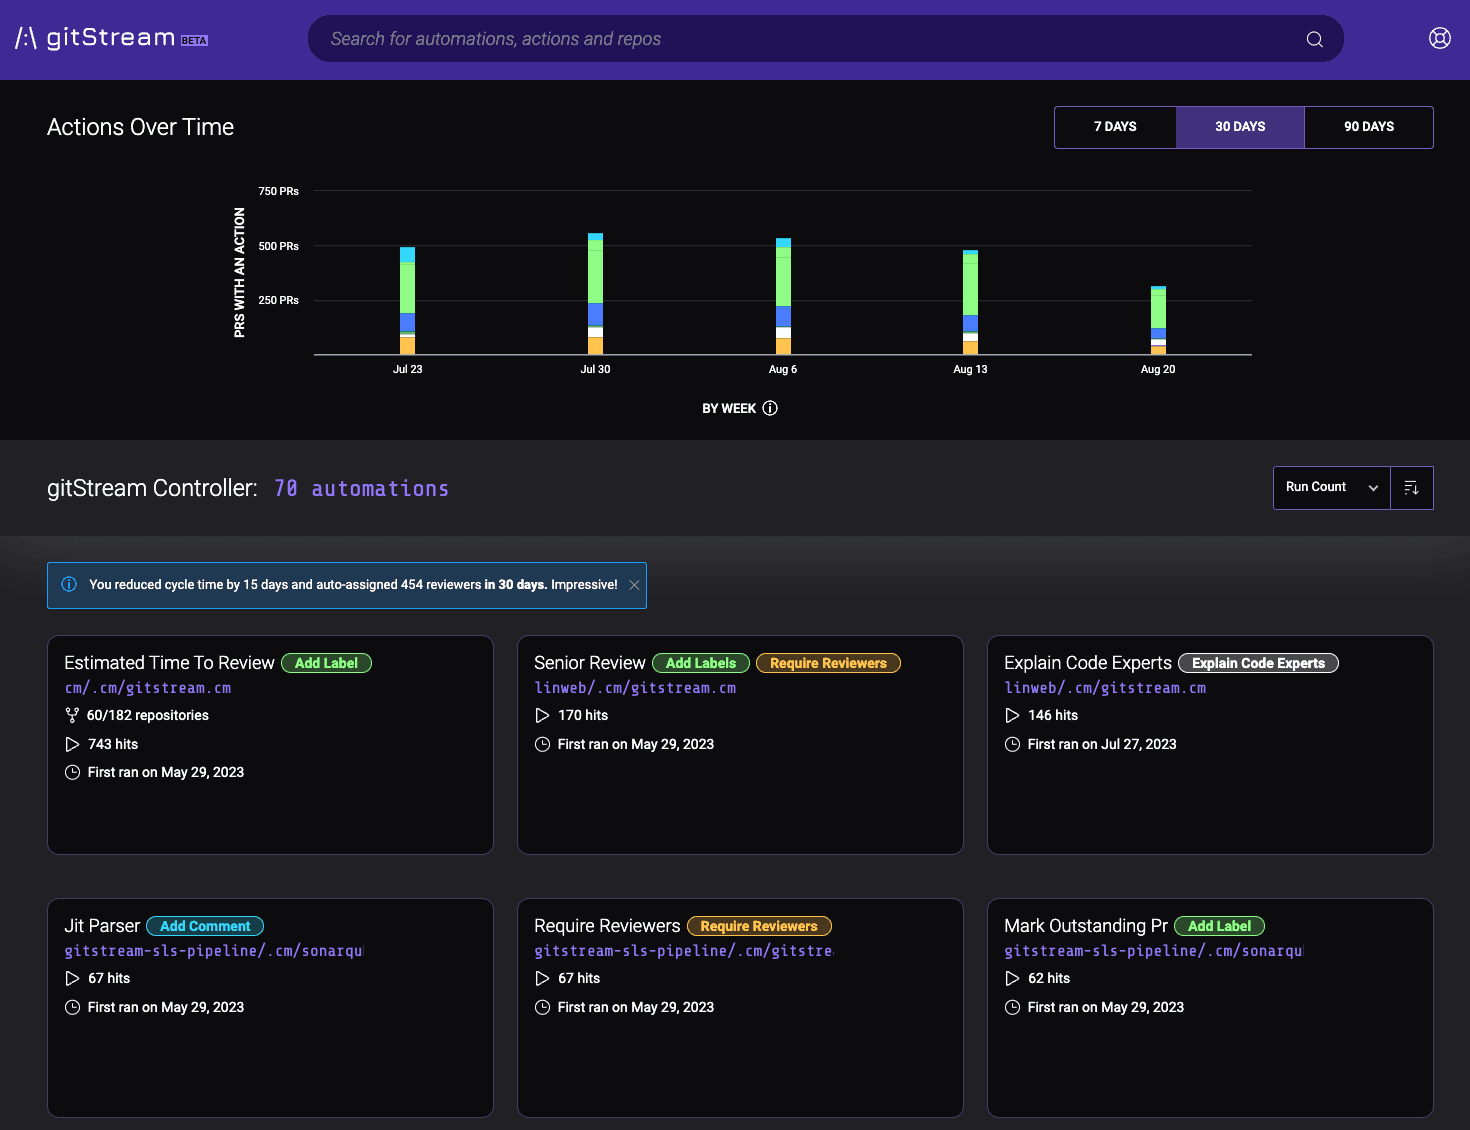
Improving processes and becoming more efficient is absolutely essential for an engineering team, but so is being able to measure that improvement and the associated ROI.
The gitStream App, a control plane solution that helps leaders visualize what automations and gitStream actions their teams are using, now breaks down the time saving impact of those improved processes and programmable workflows.
Basically it answers the question of if a developer falls in the woods, do they still have trouble finding a reviewer (or something like that)?
See your automation ROI
Better Accuracy, Flexibility, Insights, Security, and User Experience
All of these aspects–data accuracy, metrics flexibility, on-demand insights, and streamlined, secure sign in–are foundational to building an engineering metrics program that can actually drive results.
Here are the enhancements to the LinearB platform that are all about making it even easier to get impact metrics that will inform your improvement strategy and help you better align to your dual mandate.
Calculate Metrics Your Way
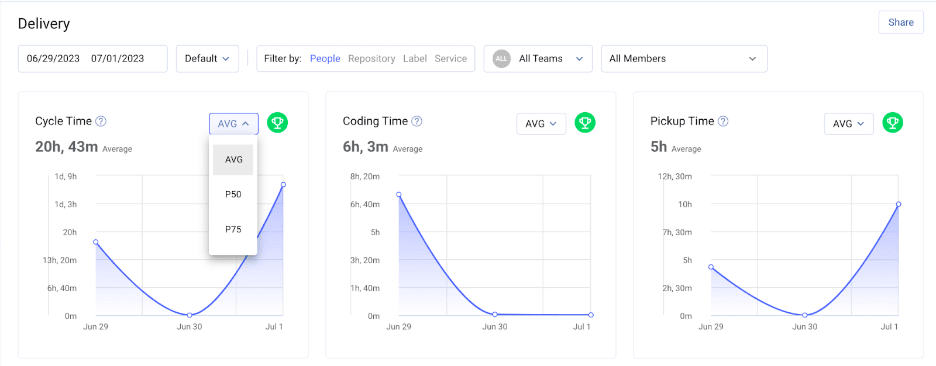
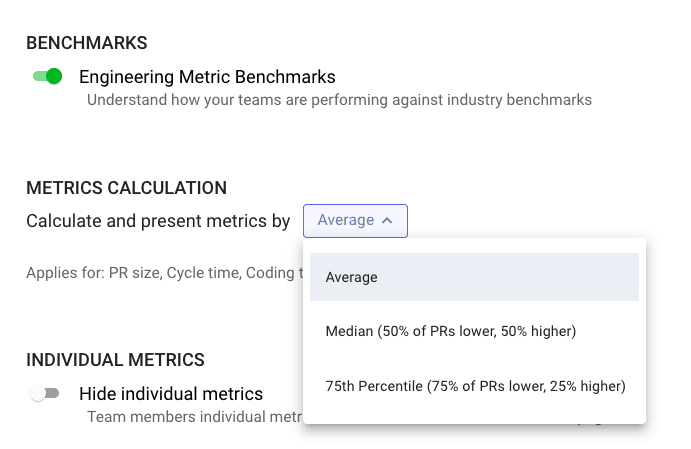
When building an engineering metrics program, flexibility is crucial. In this case, flexibility in how metrics are calculated. LinearB users can now choose between three different calculation methods for key engineering metrics–set for the organization or on a per-metric basis.
The addition of Median and P75 as calculations options is all about providing the most accurate data and platform flexibility as possible for engineering metrics. Teams can now choose between three different calculation methods and apply them to individual metrics:
- Average by Volume: Ideal for aggregating measurements that have a relatively even distribution and overall trend.
- 50th Percentile (Median): A stable measurement that’s good for seeing long-term trends. However the median will typically not show short-term trends or anomalies.
- 75th Percentile (Recommended): This is less sensitive to extreme values or outliers in the data. By using P75, we focus on the performance of the majority of cases, providing a more robust and reliable measure.
Set your metrics calculation strategy
Flexible Incident API
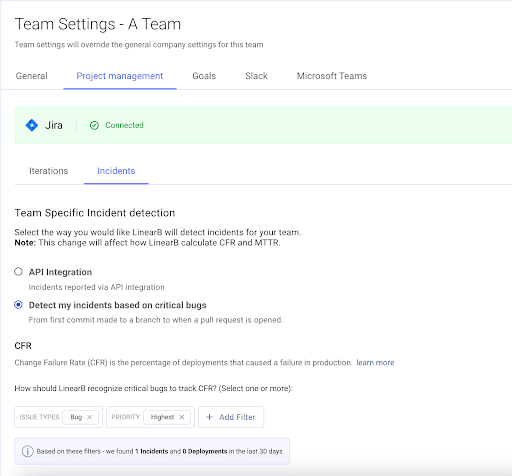
During our Spring Launch we introduced the Incident REST API to help customers populate data, customize their incident detection strategy, and help teams working on not-yet-supported PM tools get their stability DORA metrics (MTTR and CFR) right out of the box. Additionally the API also improved data accuracy as it helped teams overcome PM board hygiene issues–a nearly universal problem.
Now this data flexibility extends all the way to the team level (instead of company-wide settings).
Please note this feature is in beta. Work with your LinearB representative to get access to the Incident API.
New Customizable Dashboard for Teams and Groups (Team of Teams)
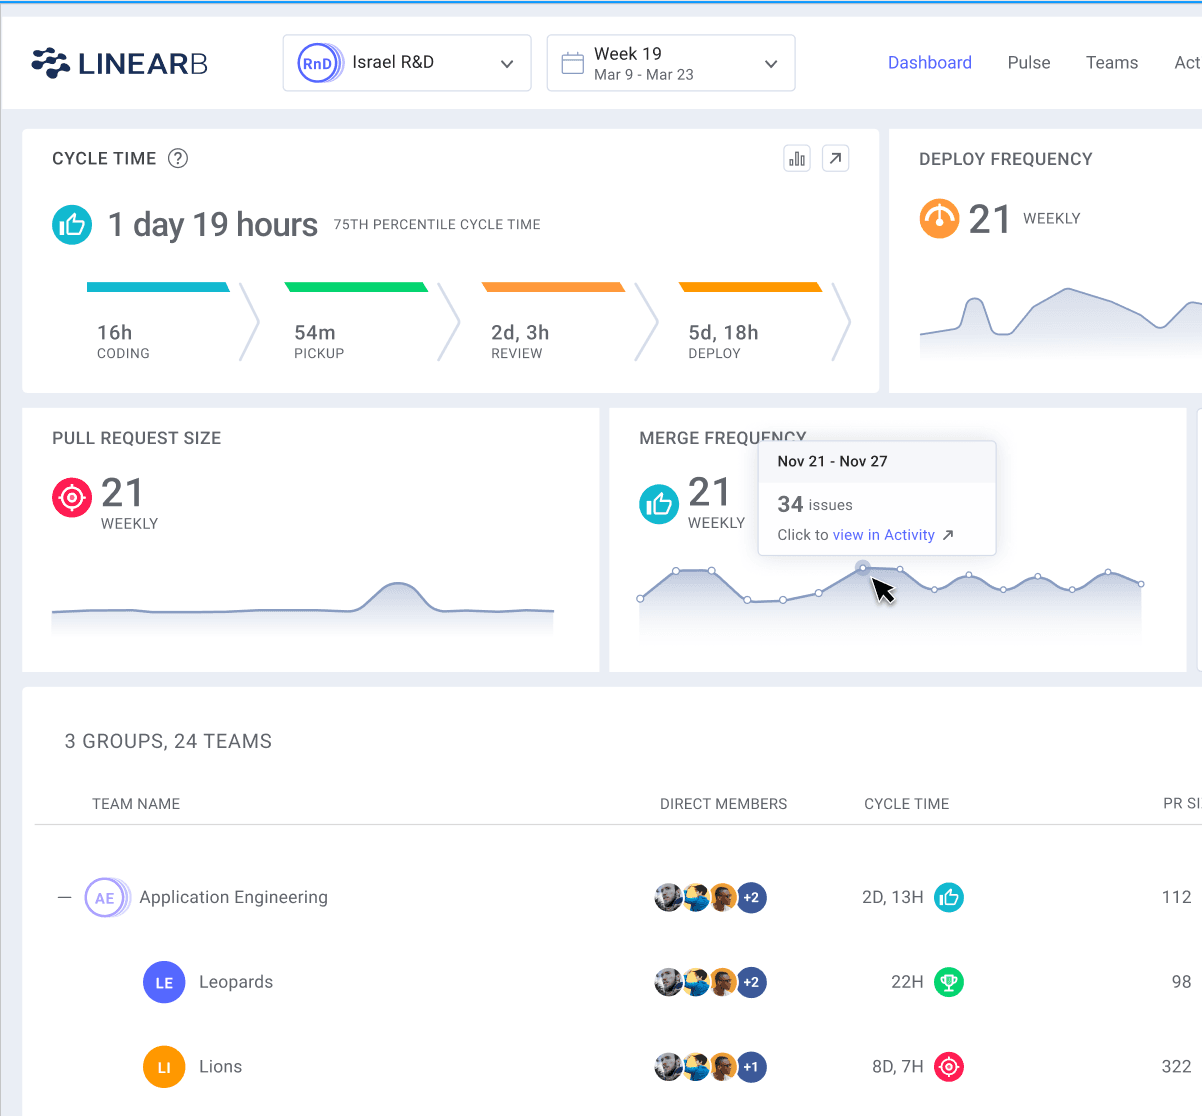
Another major enhancement from the Spring Launch was the ability to build nested teams or groups. This flexible reporting structure allows organizations–especially ones that are scaling–to get metrics for projects and initiatives that span multiple teams. This reporting structure is also valuable for getting abstracted/aggregated benchmarks on how well teams collaborate on priority projects–using tried and true engineering metrics like cycle time and PR size.
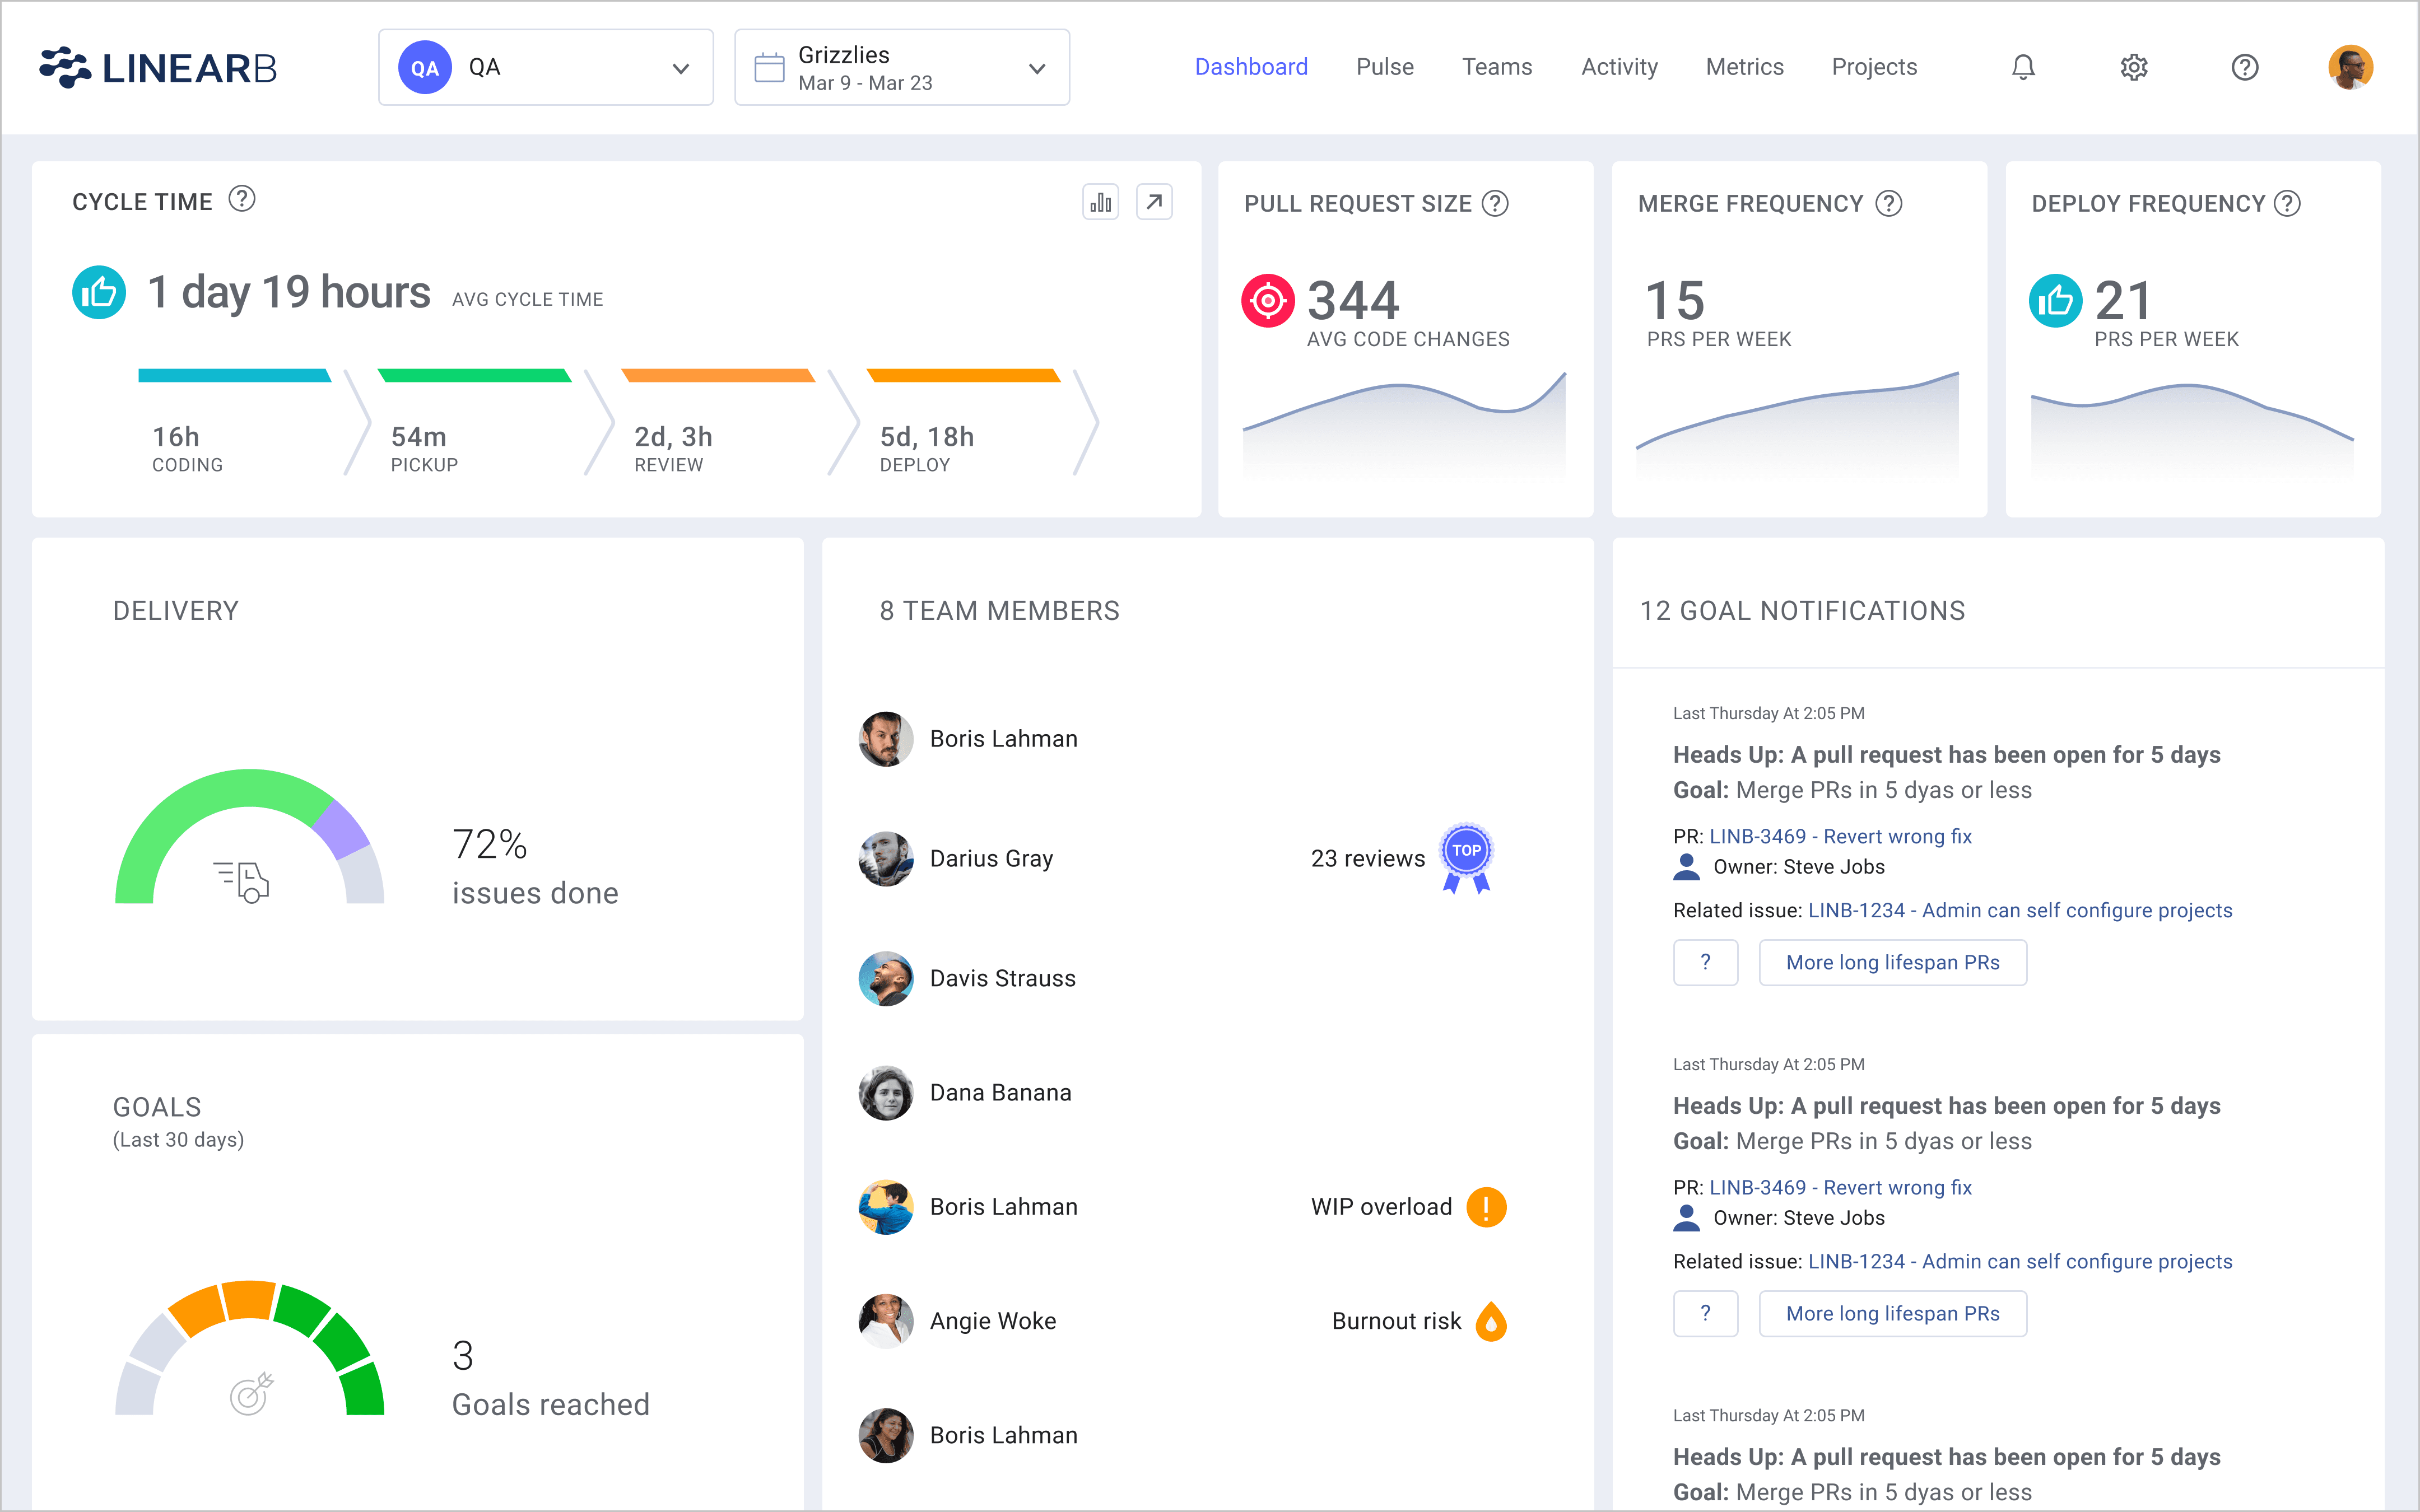
With the Summer Launch, not only is group reporting now GA, we’ve also extended that reporting to the home dashboard–the place to go for insights at-a-glance.
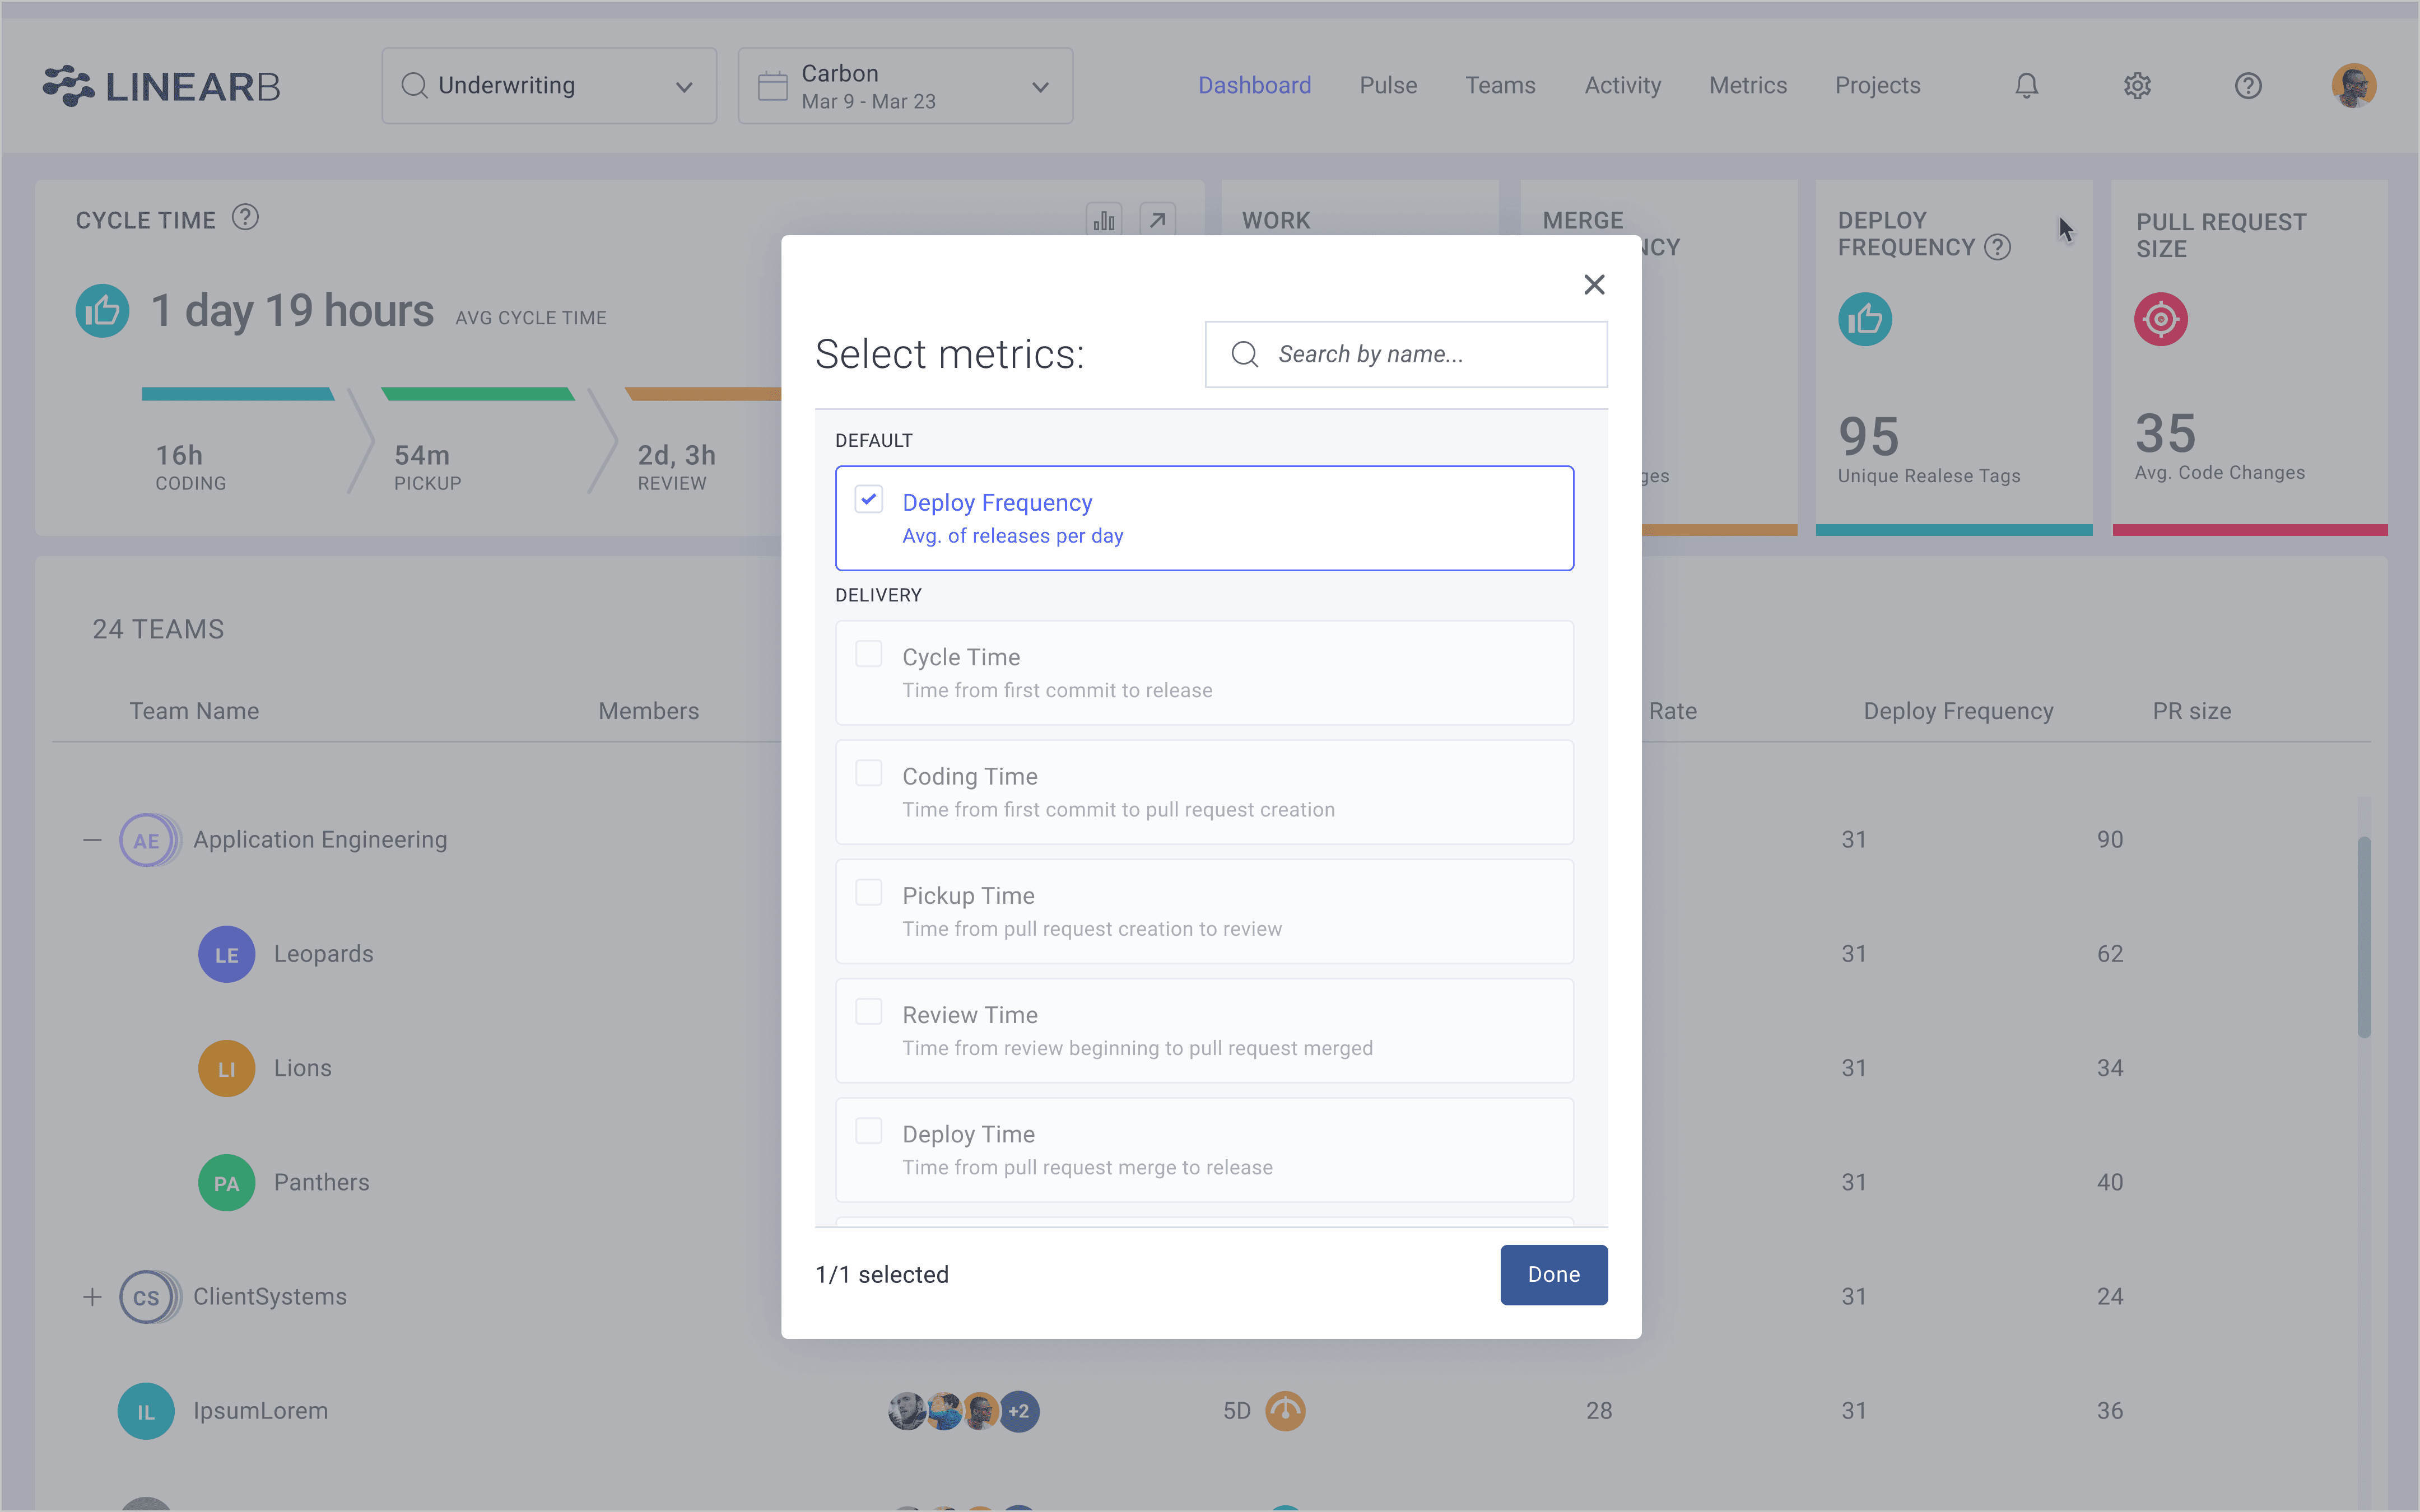
But more than that, we’ve significantly upgraded the home dashboard by making it modular and customizable, streamlining the process of extracting meaningful insights an engineering manager or team/group lead needs to understand how well a team or group (team of teams) is executing. This collection of widgets:
- Surfaces the metrics that matter most for leaders at the moment
- Provides context with benchmarks
- Showcases what a team or group is working on at a high level
- Offers all of this insight across a customizable date range
- Positions core insights, guidance, and goals front and center for groups
- Enables teams to quickly deep dive into root causes and formulate data-backed improvement strategies
Want to see how your teams stack up against the industry? Join the Software Engineering Benchmarks Report release webinar! In addition to receiving a pre-release copy of the report, LinearB’s CTO, Yeshai Beeri, will walk you through the data and showcase metrics like DORA, engineering investment benchmarks, and new metrics like Capacity Accuracy.
Enforce SSO for All Users
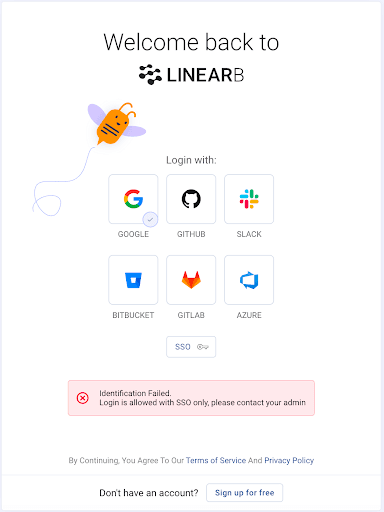
Rounding out the metrics and useability enhancements for the Summer Launch is the ability for administrators to make SAML SSO the default login method for all users. Integrating seamlessly with your preferred SSO provider (like Azure Active Directory, Okta, or any other SAML-compatible solution) new login method:
- Makes it is easier and faster than ever to sign in
- Removes the need to remember credentials for all of the tools they use daily
- Increases security posture and reduces overall risk
- Makes meeting compliance mandates easier
- Simplifies user management
Learn more about setting up SSO for LinearB
Resource Allocation, Predictable Delivery, and Business Alignment Improvements
Operational excellence should be a top priority for engineering teams. However, efficiency won’t help the organization much if teams are focused on the wrong things. Said another way, if your team is elite at handling bugs with an industry leading MTTR, that’s fantastic! BUT if you’re spending 60% of your development time on bugs and other “Keeping the lights on” tasks, that means you’re not spending enough time on things like creating value for customers (and the business) with new features and enhancements or quality days to improve your offering.
Engineering teams need to strike a balance and ensure that they’re devoting enough time to initiatives that align to the needs of the business and drive positive outcomes.
All New Investment Profile
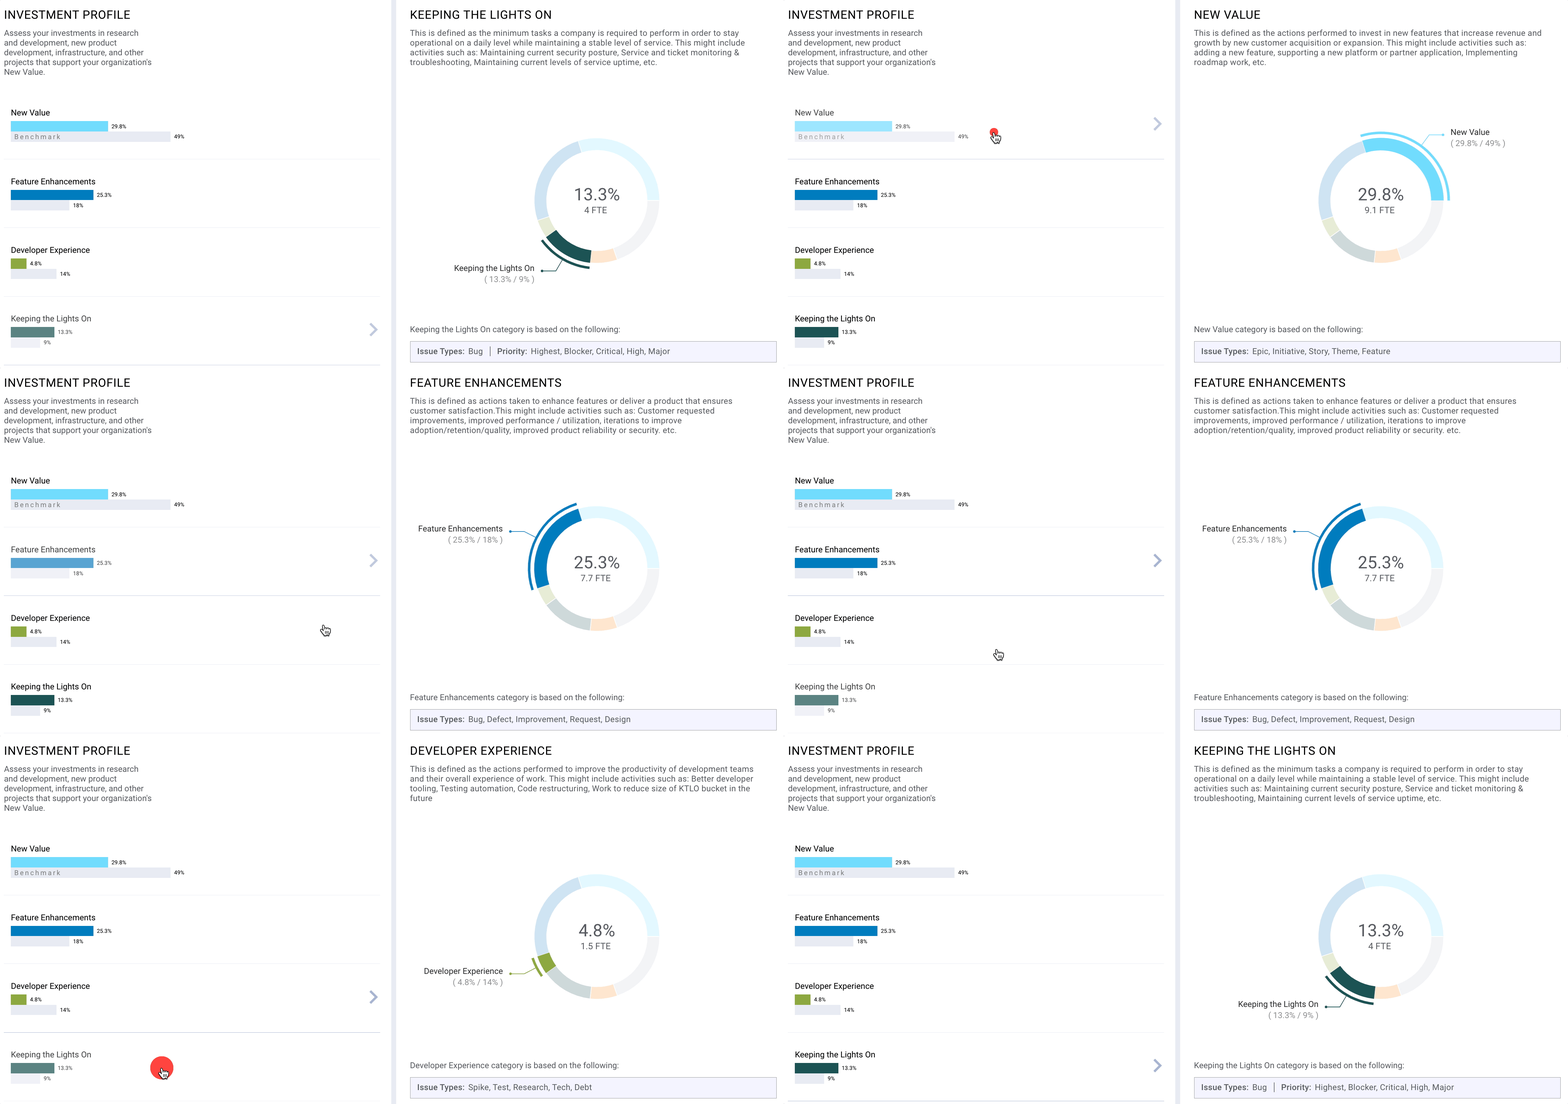

This new dashboard shows you where your dev teams are spending their time and whether that breakdown aligns with industry best practices. The view uses fully customizable investment categories that ingest specified Jira issue types, labels, custom fields, and keywords to segment work into buckets and illustrate how much of total dev time is being spent in each area.
In addition to pre-populated benchmarking for Investment Profile that comes out-of-the-box, you can also customize your benchmarks to suit the specific needs and realities of your teams.
Investment Profile also highlights an “Inefficiency Pool” that illustrates the percentage of your efforts that have the potential to increase your team’s overall efficiency by addressing common bottlenecks in the development process–such as context switching and idle time. You can address this pool by improving your impact metrics with workflow automation and team goal setting.
Some insights that Investment Profile can provide:
- Spending too much time on Keeping the Lights On? You may have an overall quality issue that you’ll need to address (like large PRs, shallow reviews, or too many PRs merged without review).
- Spending too little time on the developer experience? This can be a proof point–even in down economies–that a new automation tool may be warranted.
If you’re on a Business or Enterprise subscription of LinearB, explore Investment Profile and see what jumps out at you in terms of how your teams have been spending their cycles.
Don’t have LinearB yet? Get started here!
Flexible Project Reporting
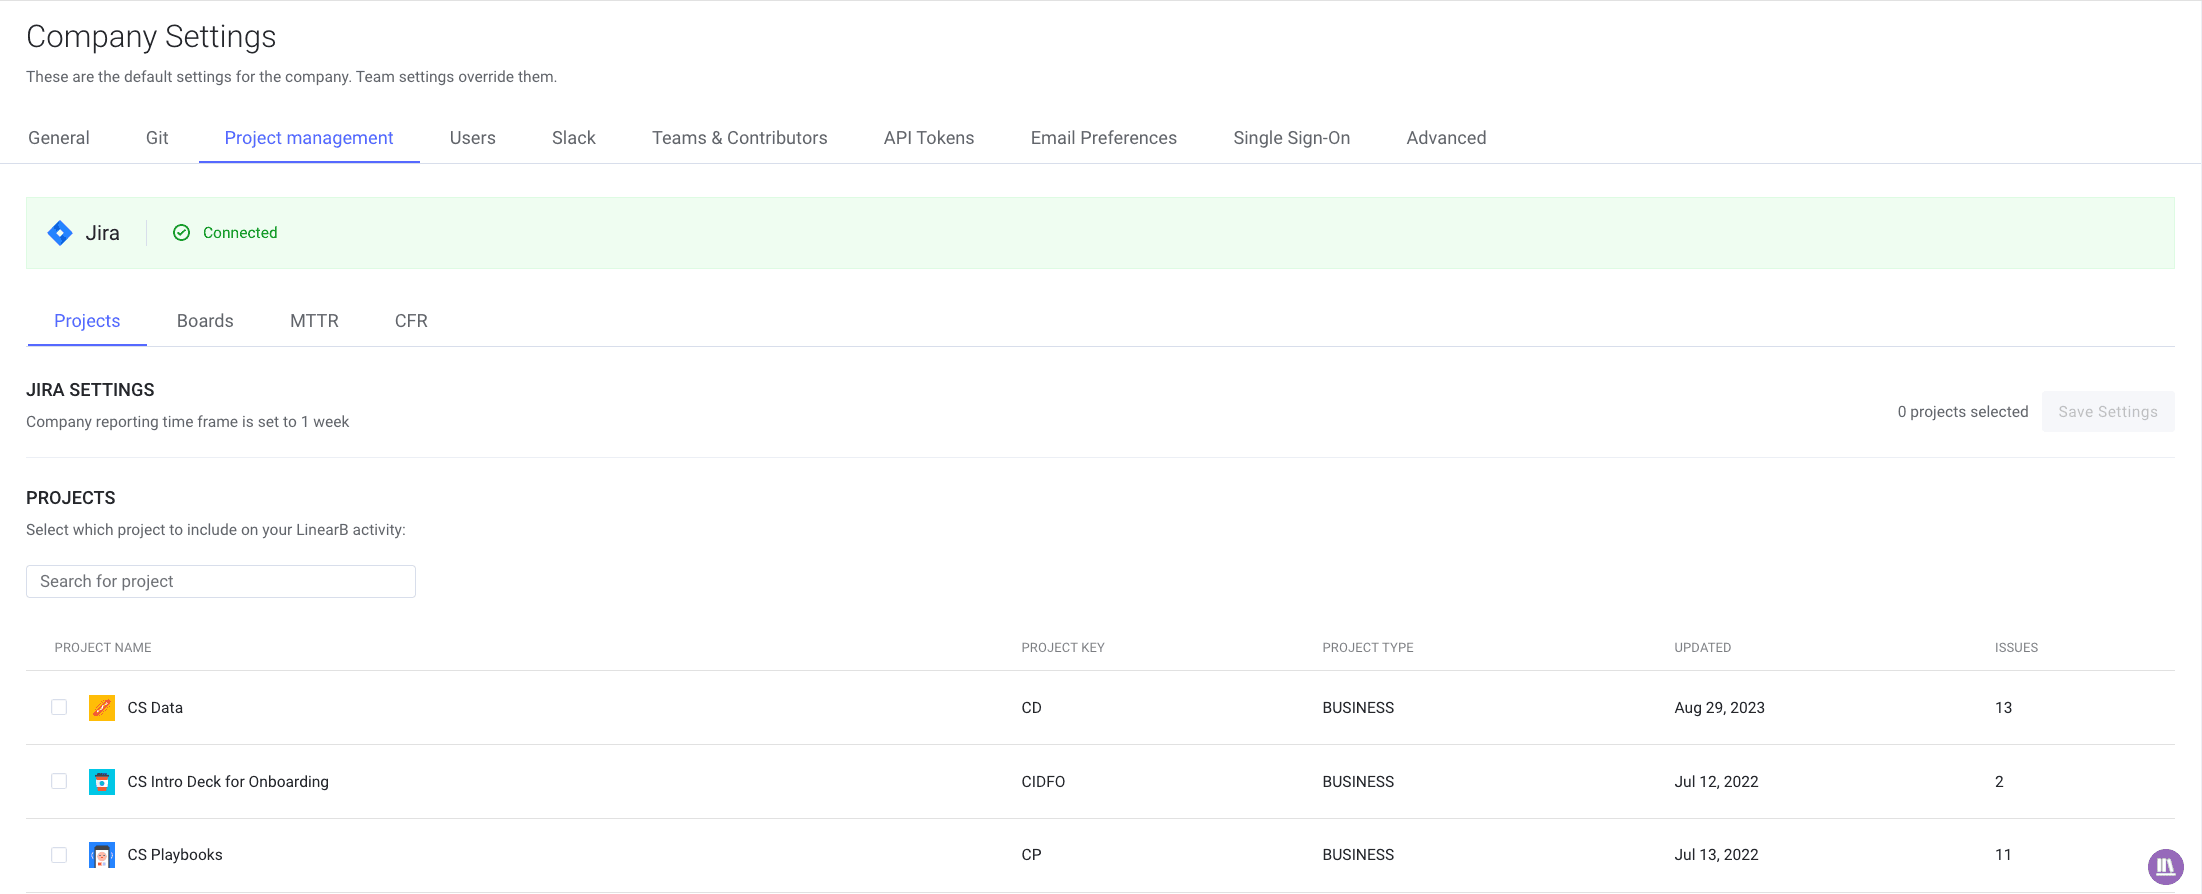
This reporting flexibility enhancement helps leaders ensure that they share only what they want to and nothing else. Got sensitive project data that you’re not ready to give out to the entire organization? No problem! Administrators can ensure sensitive data remains hidden by excluding projects from LinearB project reports and choosing which projects appear on the Resource Allocation dashboard via Company settings.
Learn more about Resource Allocation
Looking to make sense of metrics, what they mean, and where your teams fall? Join the Software Engineering Benchmarks Report release webinar! LinearB’s CTO, Yeshai Beeri, will walk through the data and show you how elite engineering teams perform against the benchmarks in the report–which you’ll receive early when you register for the event!
Resource Allocation Reporting for Custom Fields/Labels/Tags
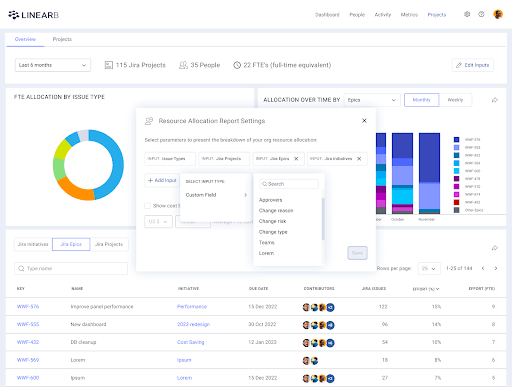
We’ve said it before but it bears repeating: we believe that tools should be flexible and reflect how your teams work, not require them to change how they work. Often that means structuring projects and initiatives using custom fields, labels, and tags (for Azure folks). This enhancement shows engineering leaders what issues are being prioritized, how projects are resourced, and the estimated cost of those decisions–all using data from custom fields, labels, and tags.
This view helps leaders control spending, mitigate delay risks, automate reporting on capitalizable projects for finance, and build a connection between engineering output and ROI. The Custom Fields/Labels/Tags enhancement (1) provides more flexibility in how customers use the tool and (2) ensures that RA provides the most accurate data possible.
Get started with Resource Allocation
Resource Allocation for Azure Boards
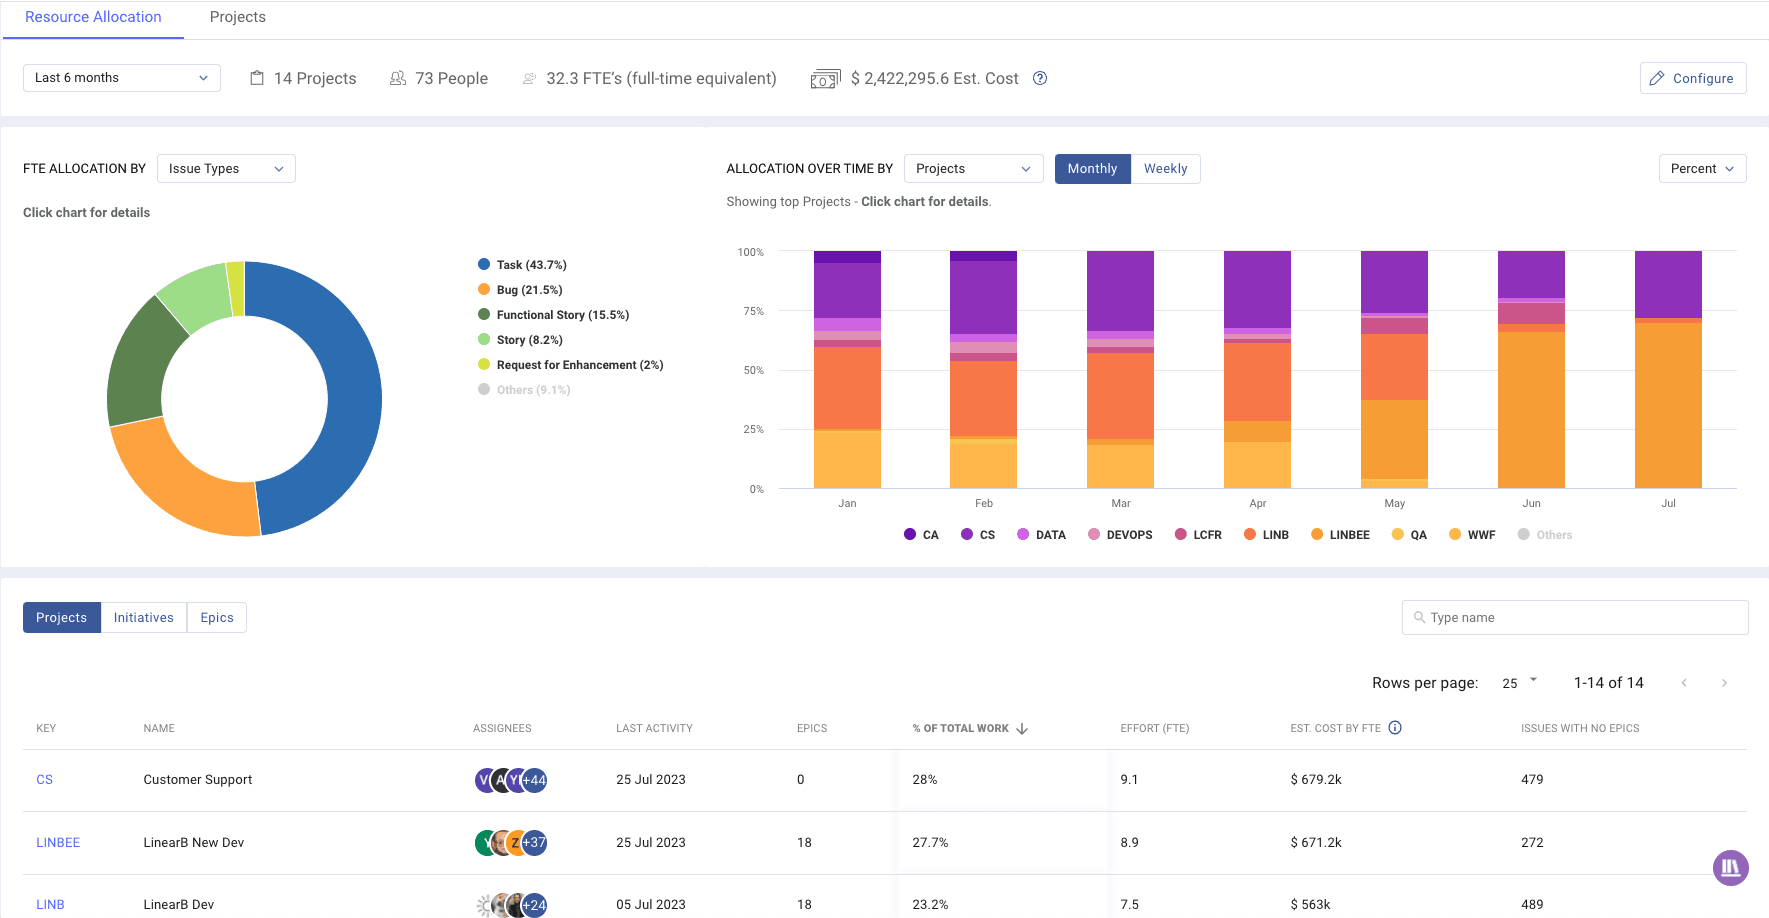
The business-focused engineering metrics you need are now available for teams that have invested in the Microsoft ecosystem. LinearB now better integrates with Azure DevOps (specifically Azure Boards) and provides the Resource Allocation view to correlate key engineering health metrics to business impact for teams on Enterprise and Business subscriptions.
As of 8/21/2023, Resource Allocation for Azure DevOps (Boards) is GA! Customers leveraging Azure DevOps can get started with Resource Allocation today and showcase the relationship between engineering health and business ROI.
Build your Resource Allocation dashboard
Azure Team Scope Definition
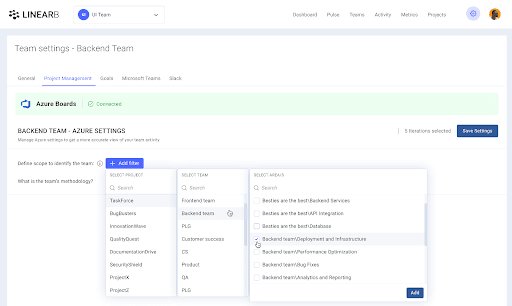
LinearB loves Microsoft! We’re continuing to invest significant resources in ensuring a tight integration with Azure DevOps with the latest GA feature: Azure Team Scope Definition!
Now teams on Azure DevOps (Boards) can customize their scope of work, define iterations, and see their git metrics for those iterations–all at the team level. The best part: building these reporting structures uses familiar Azure Boards terms and naming conventions!
This granular reporting helps ensure that metrics are always as accurate as possible and reporting is highly flexible to accurately reflect the unique makeup of teams and the engineering organization as a whole.
Conclusion
The Summer Launch offers a ton of new functionality that will help engineering leaders deliver a great developer experience, build a robust metrics program, align to the needs of the business, and meet their dual mandate.
As a reminder, many of these features were the result of your feedback. It’s invaluable to us as we work to improve the product and provide more value to our customers. Please don’t hesitate to reach out with enhancements and features you’d like to see in future LinearB releases!
If you don’t have LinearB, you can get started right here with a free account! If you’re the type of person who likes a guided tour (and who doesn’t?!) schedule a demo.
Now go enjoy the last few days of summer!


