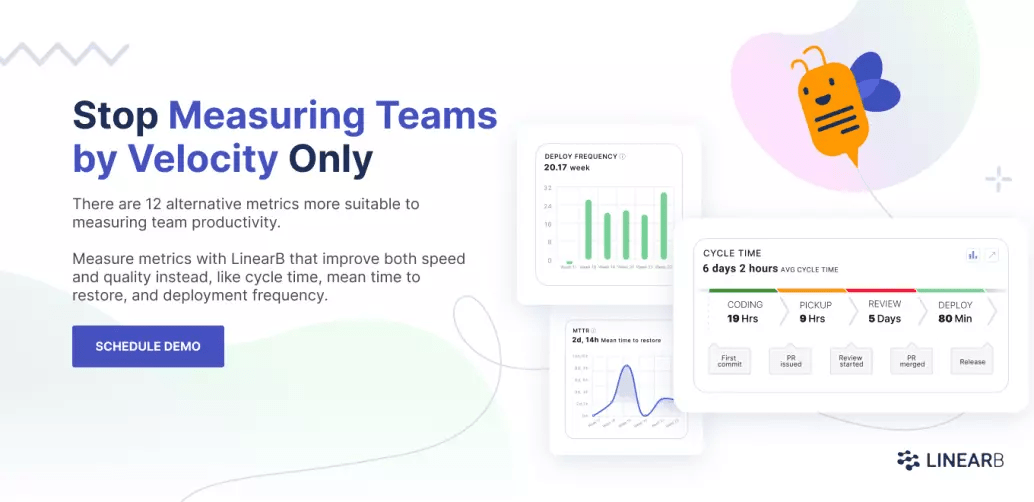
Developer velocity is a metric that helps estimate how much work a software development team can complete within a specific period of time. It’s a popular, although often misused, development metric for planning capacity and measuring productivity in software companies.
“But what do you mean misused?” you ask. Well, let’s take it one thing at a time.
Table of Contents
- What Is Developer Velocity?
- How Do You Calculate Velocity?
- Developer Velocity Problems
- Better Measures for Better Results
- Looking Beyond Developer Velocity
What Is Developer Velocity?
Velocity measures how much work team members can complete during a sprint. The creators of this metric wanted it to be an indicator of your team’s speed in delivering business value. Then, you’d use the result as a benchmark to improve developer velocity.
So, if you have an average developer velocity calculated, it’s a common misconception that you can estimate how long it’ll take your team (or teams) to finish a project. But the formula for developer velocity is deceiving. And by ‘deceiving’, we mean it isn’t as simple as it looks.
How Do You Calculate Velocity?
The simplest formula for calculating velocity is measuring the number of story points completed over a period of time.
So, if your team works in two-week sprints, and they completed 20 story points during the last sprint, their velocity was 20. This should mean that you can safely schedule 20 more points of work for the next sprint.
After you complete the next sprint, you calculate the velocity again. Sure, it varies a bit, but after a few iterations, you’ll have a good running average. And you can use this average for capacity planning.
Seems easy enough, right? Wrong! We’re about to shatter your false sense of security.
Developer Velocity Problems
So, nothing in the world is perfect—and that includes developer velocity. Even this seemingly innocent, straightforward metric has some serious problems. Let’s look at a few of those.
Velocity Is an Inconsistent Measure
Your developer velocity assessment helps you estimate how much work your dev team can accomplish in a sprint. But are you measuring your team’s ability to predict/assess story points? Or are you simply noting their ability to get story points done?
And does this matter? Yes!
Okay, so story points can be a relative measure that your team agrees upon. And in this case, it might be fine if velocity becomes a relative measure. So it’s okay if your team continues with the same code base over multiple sprints.
But what happens when you shift to a new product? You may find that your velocity measurements are almost worthless for the first few sprints, if not longer.
And what happens when you add new people to your team? You don’t even have to move to a new code base to see the accuracy of your velocity measures take a nosedive. When someone new starts writing your user stories, your relative scale might shift under your feet.
Finally, you can’t use velocity to measure your entire engineering org. No two teams are alike, so trying to compare the output of multiple teams together is a recipe for disaster. Instead, you need to measure each team’s own velocity, instead of your entire org at once.
Check out what Ben Matthews, Director of Engineering at Stack Overflow, has to say about developer velocity:
Velocity Can Hurt Quality
What happens when a team places its focus on velocity? It means that they’re measuring their productivity based on their ability to finish user stories at a consistent pace. We’ve already seen how inaccurate this measure can be, but that’s only half the story. Velocity tends to place all your emphasis on new behavior because it’s a reductive measure. It doesn’t account for all the other work your teams do to ensure that your application works well.
Jim Highsmith wrote about how this affects product quality:
“Time after time I hear comments from managers or product owners, “Your velocity fell from 24 last iteration to 21 this time, what’s wrong? Let’s get it back up, or go even higher.” In this scenario, velocity has moved from a useful calibration tool (what is our capacity for the next iteration?) to a performance (productivity) measurement tool. This means that two things are short-changed: the quality of the customer experience (quantity of features over customer experience) and improving the delivery engine (technical quality).”
It’s not hard to see how this happens. Your teams are struggling to maintain velocity, so they’ll cut corners. They’ll start skipping code reviews or stop writing unit tests. You’re basically accumulating technical debt, and that’s unacceptable in ordinary conditions.
And do you think they can just push the accumulated work to the next sprint? No! They’ll have to focus on maintaining or increasing developer velocity in that next sprint. So quality takes a serious hit to the face while the metrics keep “improving”.
Velocity Is Easy to Game
But you don’t always have to cut corners to maintain velocity. You can simply start gaming the system! Just pad your story points, and everything works out by itself. (This is bad, we aren’t actually telling you to do this).
Many developers under pressure to hit a velocity target will do this to protect themselves and stay in the top quartile. Development managers might quietly (or not) do the same to protect their team. As a result, the metric used for measuring progress and estimating capacity is more shared fiction than a useful yardstick.
So clearly, developer velocity is a dangerous metric. But what should you use instead?
Better Measures for Better Results
So if velocity isn’t an effective metric, what is? Fortunately, we’re here to give you some better ways to measure and improve productivity all throughout the product management process.
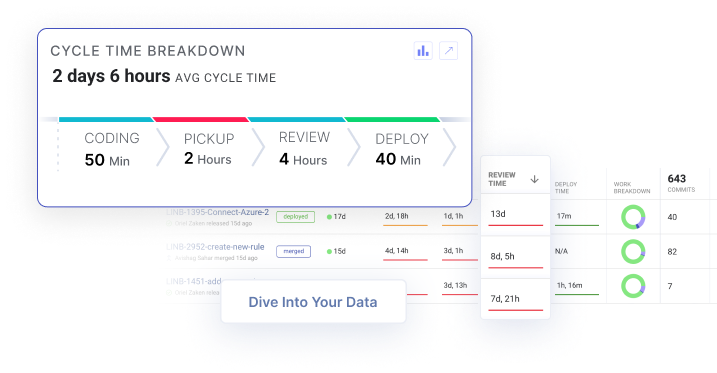
Measure Cycle Time
Instead of measuring how much work a team completes during a sprint, cycle time measures how long it takes to deliver the job. In other words, cycle time is the time between a developer’s first commit and production release.
Cycle time will often span multiple sprints, so it doesn’t replace velocity’s alleged goal of planning sprint capacity. What it does is tell you how efficient your development process is. Short cycle times mean work travels from development, through testing, to deployment quickly. Longer times actually indicate a bottleneck you need to clear.
And LinearB can help you track and improve your cycle times! Our Team Goals feature helps each of your teams set working agreements on where and how to improve. And you can even automate the improvement over the next sprints with the WorkerB bot!
Measure Change Failure Rate
So by now, we’re all well aware that developer velocity can harm your quality. So how about you use the Change Failure Rate metric? This powerful quality measure shows you the percentage of code changes that lead to production failures. Simply put, it’s code that needs to be refactored or cut entirely after it’s been deployed. If your team ends up with a high change failure rate, they might need to rethink their PR review process or make smaller deployments more often.
As we mentioned above, anything you measure will likely be gamed. That is, people will change their behavior to optimize whatever you’re measuring. With developer velocity, we noted the negative, distorting effect this has on what a development team does.
Metrics like cycle time and change failure rate can be gamed, but the great thing is that you want them to be gamed. You want your teams working to optimize these metrics. So gaming them results in good things.
These metrics were carefully devised to create elite dev teams because they highlight inefficiencies and wasted time. Gaming them will increase efficiency and reduce waste, increasing your revenue growth.
Measure Planning Accuracy
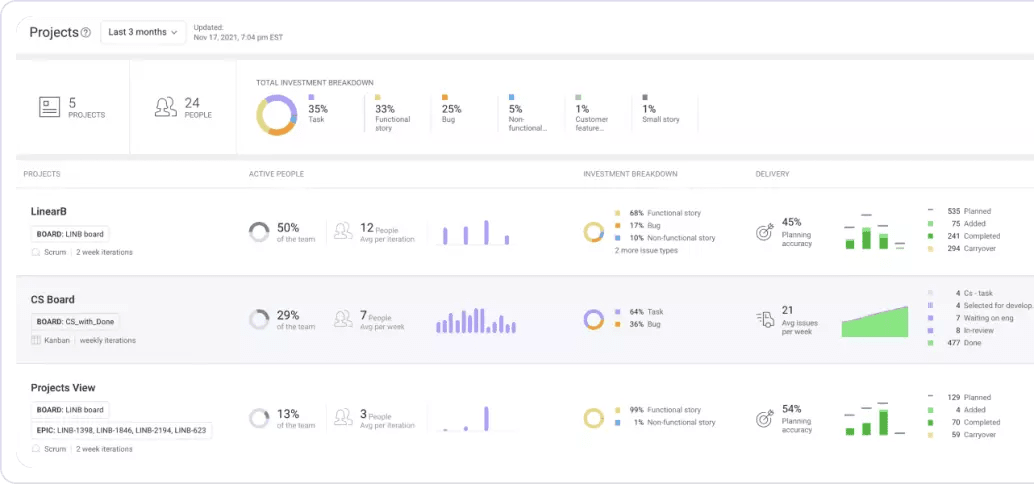
Planning accuracy is a new metric we developed to measure planned story points vs completed story points. And we go a step further to show you the breakdown of planned, completed, added, and carryover work.
Planning accuracy helps you answer the question, “Are we going to deliver features on time for this project?”
Ultimately, regardless of how fast your teams are delivering story points, if they’re not the right story points that matter for driving business, you miss deadlines and have to eat crow.
And that leads me to the investment profile.
Measure Investment Profile
Your Investment Profile helps you see how much effort your teams have placed into each issue type. When you rely on a developer velocity assessment as a measure of productivity, you’re constantly being asked, “Why can’t your teams just be faster?” and “When will feature X be ready?” Change the conversation with Investment Profile reports.
Now the question is “How do we balance competing priorities to drive the best result for our customers and the company?” The latter is much more productive.
The best data to show your CEO instead of developer velocity is to cross-reference planning accuracy with the investment profile. Viewing them together adds additional context about trends in your delivery.
For example, if your investment profile reveals significant work related to bugs or non-functional work, you may be overplanning each sprint and not allocating for the inevitable unplanned work.
And if your planning accuracy reveals a trend of too much added work each iteration, you should have a conversation with your product teams about scope creep.
This is why we created the robust sprint planning tool—the Project Delivery Tracker.
Looking Beyond Developer Velocity
If you came here to learn all about velocity and why you should use it for your business, we’re sorry to disappoint you (but not really). We hope we helped open your eyes and see how measuring and focusing on developer velocity can spell disaster for your teams.
Velocity isn’t an accurate reflection of your engineering orgs’ productivity, and it can—more often than not—lead to bad-quality products and burnt-out developers.
Instead, why don’t you measure more insightful metrics, like those mentioned above? If you use code tools, like LinearB, you’ll get all the metrics you need to have a holistic view of your org’s productivity. Plus you’ll see how your projects are progressing based on business-focused metrics that help you manage the conversation with your CEO and internal stakeholders.
Set up a demo today and give it a try!