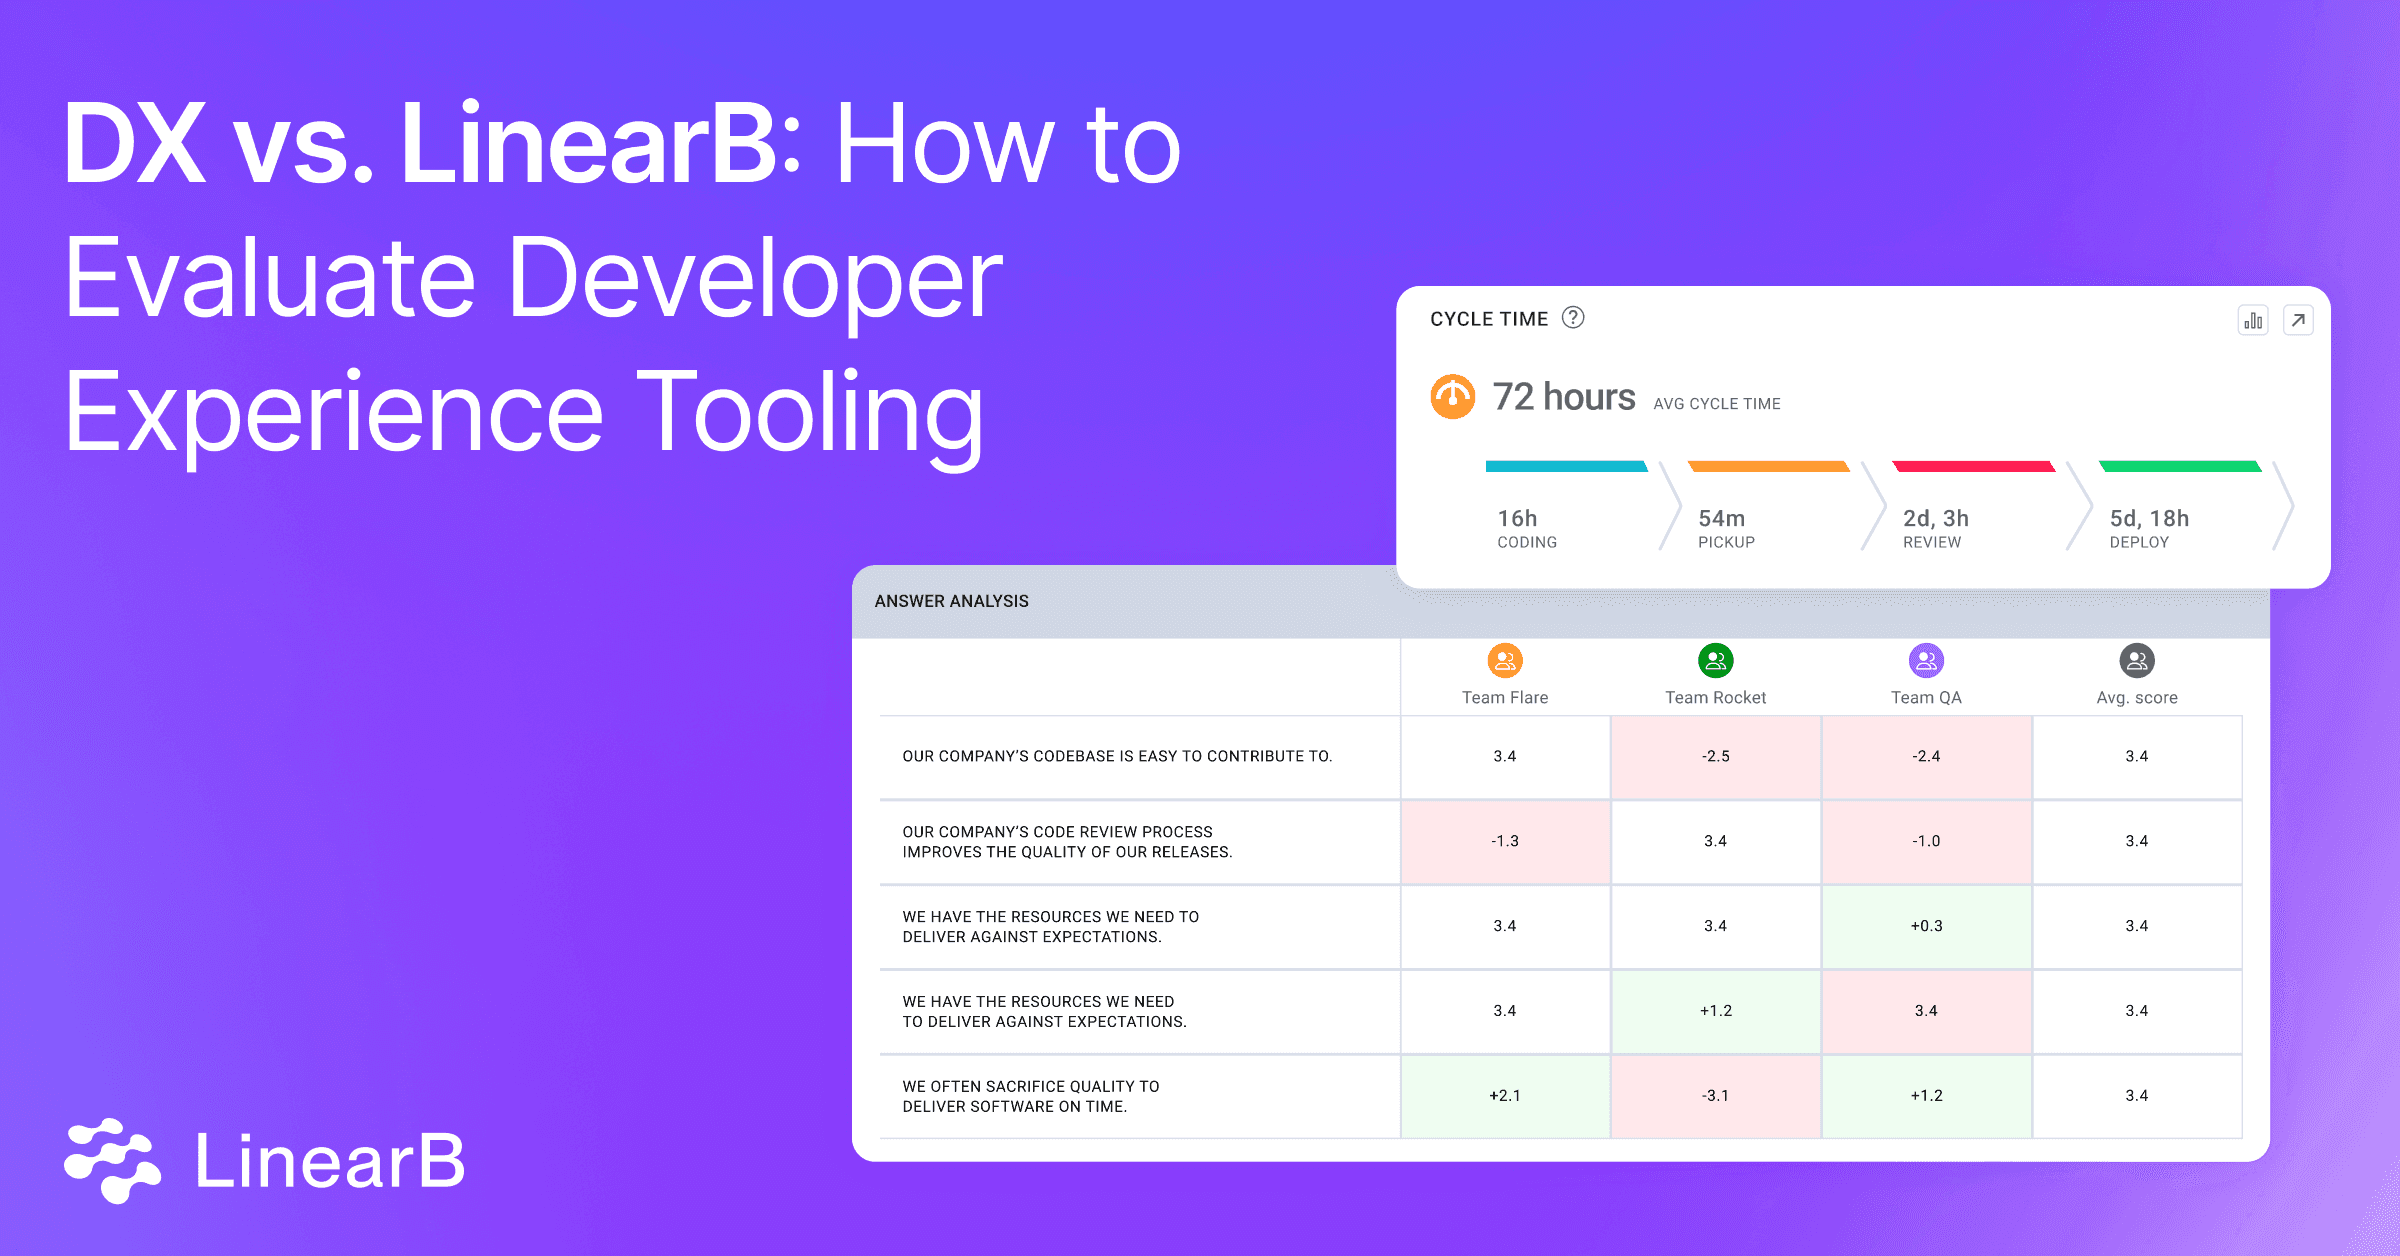
As engineering teams scale, the complexity of managing productivity, developer experience, and delivery predictability grows exponentially. Engineering leaders — managers, directors, and executives alike — are tasked with aligning software development efforts with broader business objectives while maintaining operational excellence. To make informed, data-driven decisions, organizations are turning to Software Engineering Intelligence (SEI) platforms like DX and LinearB.
This comparison will explore how these two platforms — DX vs. LinearB — stack up against each other and offer practical recommendations for engineering leaders evaluating SEI solutions.
DX vs. LinearB: Key Limitations of DX
Achieving efficiency and alignment across the entire software delivery lifecycle requires more than isolated metrics or surveys. It demands a platform that integrates both quantitative and qualitative insights to deliver actionable improvements at every level of the organization.
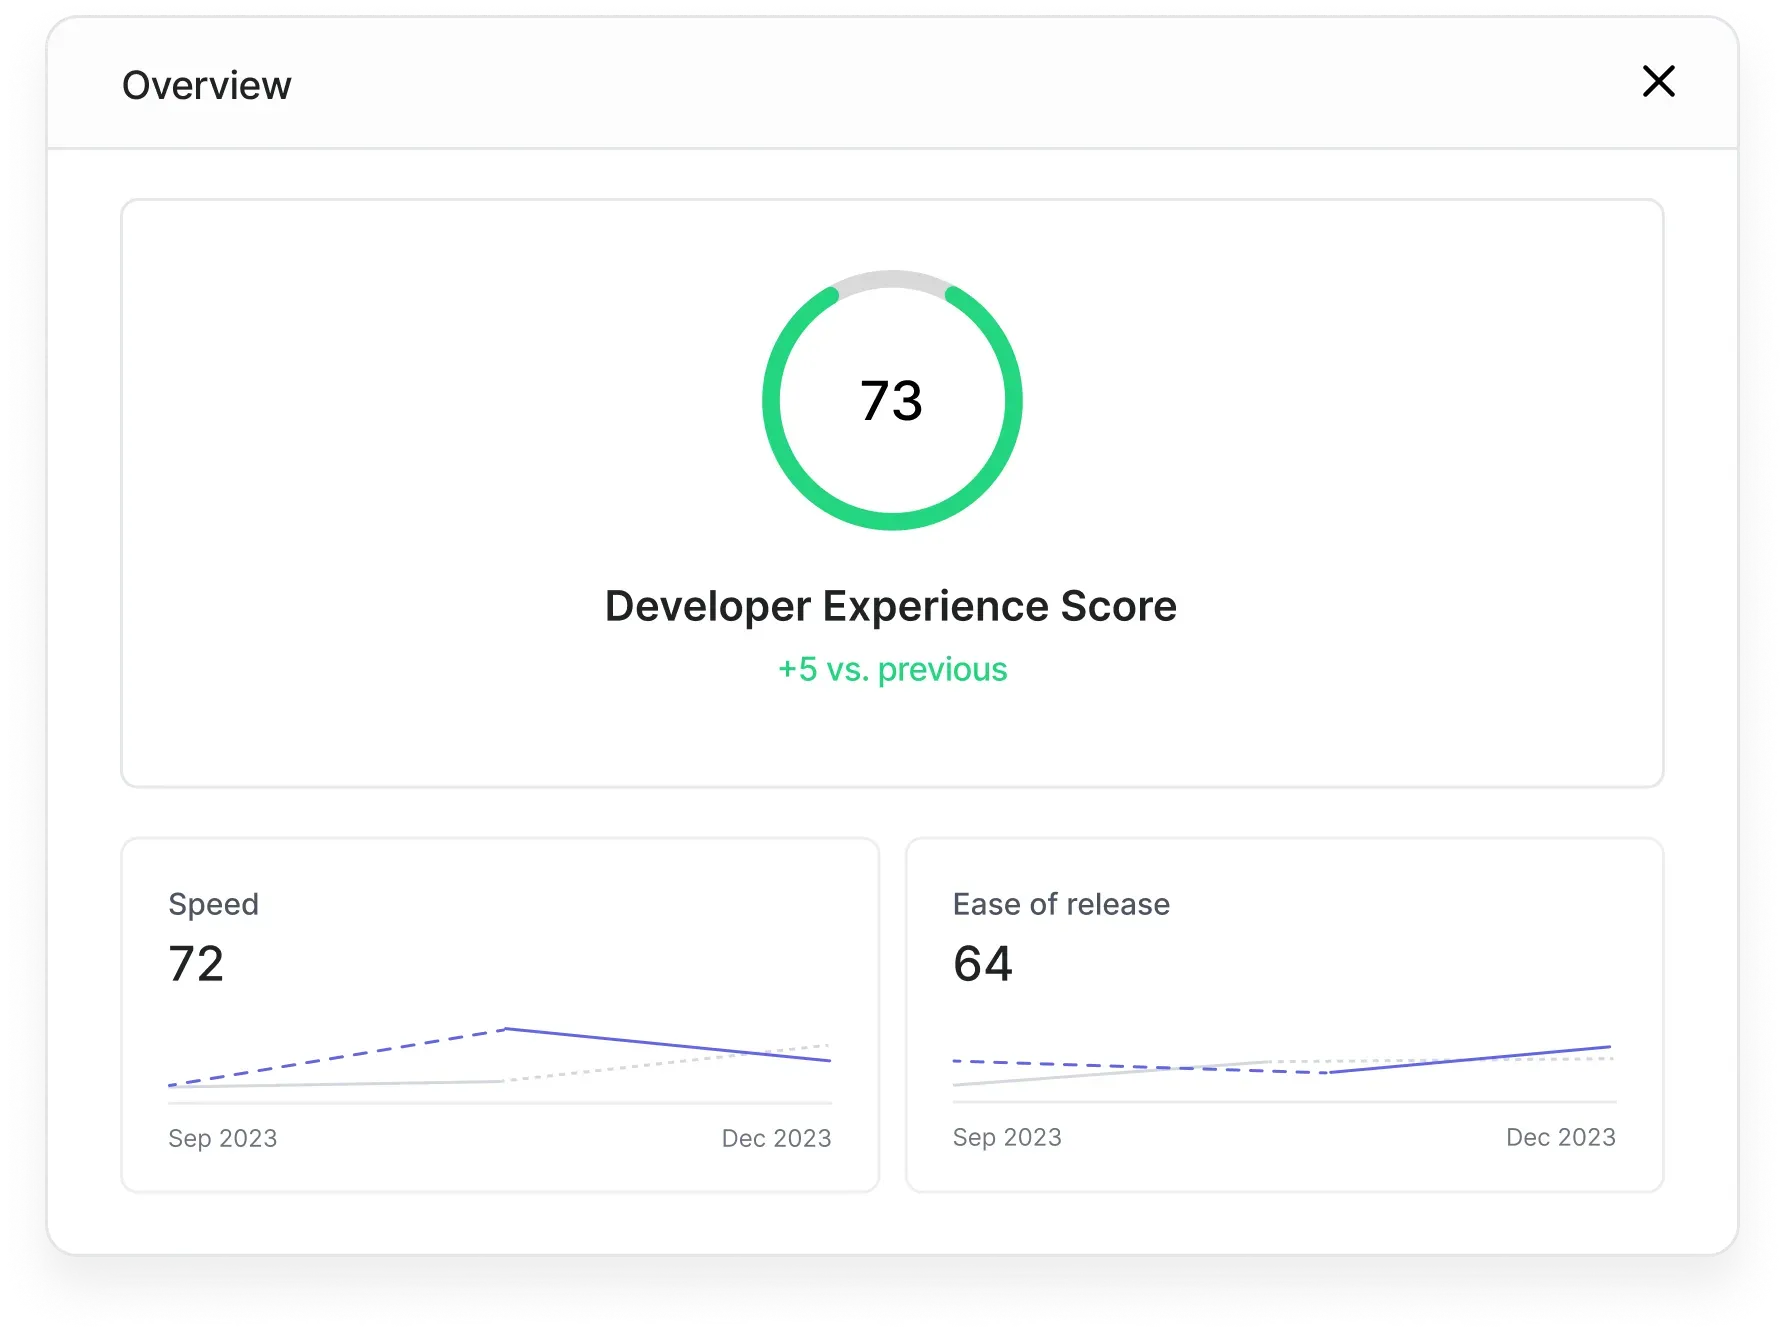
DX, a player that emerged from the DORA/SPACE initiatives, takes a research-heavy, survey-centric approach to developer productivity and experience. While surveys are undoubtedly helpful, they are only part of the solution, and DX’s reliance on this method creates several blind spots for organizations:
- Survey Bias and Data Subjectivity: Self-reported data is inherently subjective and prone to bias. Surveys capture how people feel but often miss the objective reality of how software development processes are functioning.
- Lack of Business Alignment: DX's survey-driven approach doesn't provide the deep operational insights required to align software development activities with business goals. This results in a significant blind spot for leaders trying to connect engineering outcomes to business value.
- Resource Allocation Blind Spots: DX does not offer visibility into how teams are allocating resources or how effectively they are utilizing their time, which is critical for forecasting and predictable delivery.
- No Practical Means to Drive Improvement: Even though DX provides survey results, it doesn’t offer the tools to operationalize improvements. Engineering leaders need more than reports—they need solutions that automate and enhance team productivity in real time.
- Siloed Data: DX’s proprietary metrics focus primarily on survey results and do not integrate well with data across the entire SDLC (software development life cycle). This leaves teams with fragmented insights that are difficult to take action against.
DX vs. LinearB: Key Advantages of LinearB
LinearB, a DX alternative, offers a more holistic approach to SEI, providing engineering leaders with both quantitative metrics and qualitative surveys. This dual approach ensures that teams not only understand how their processes are performing but can also drive continuous improvements across their workflows.
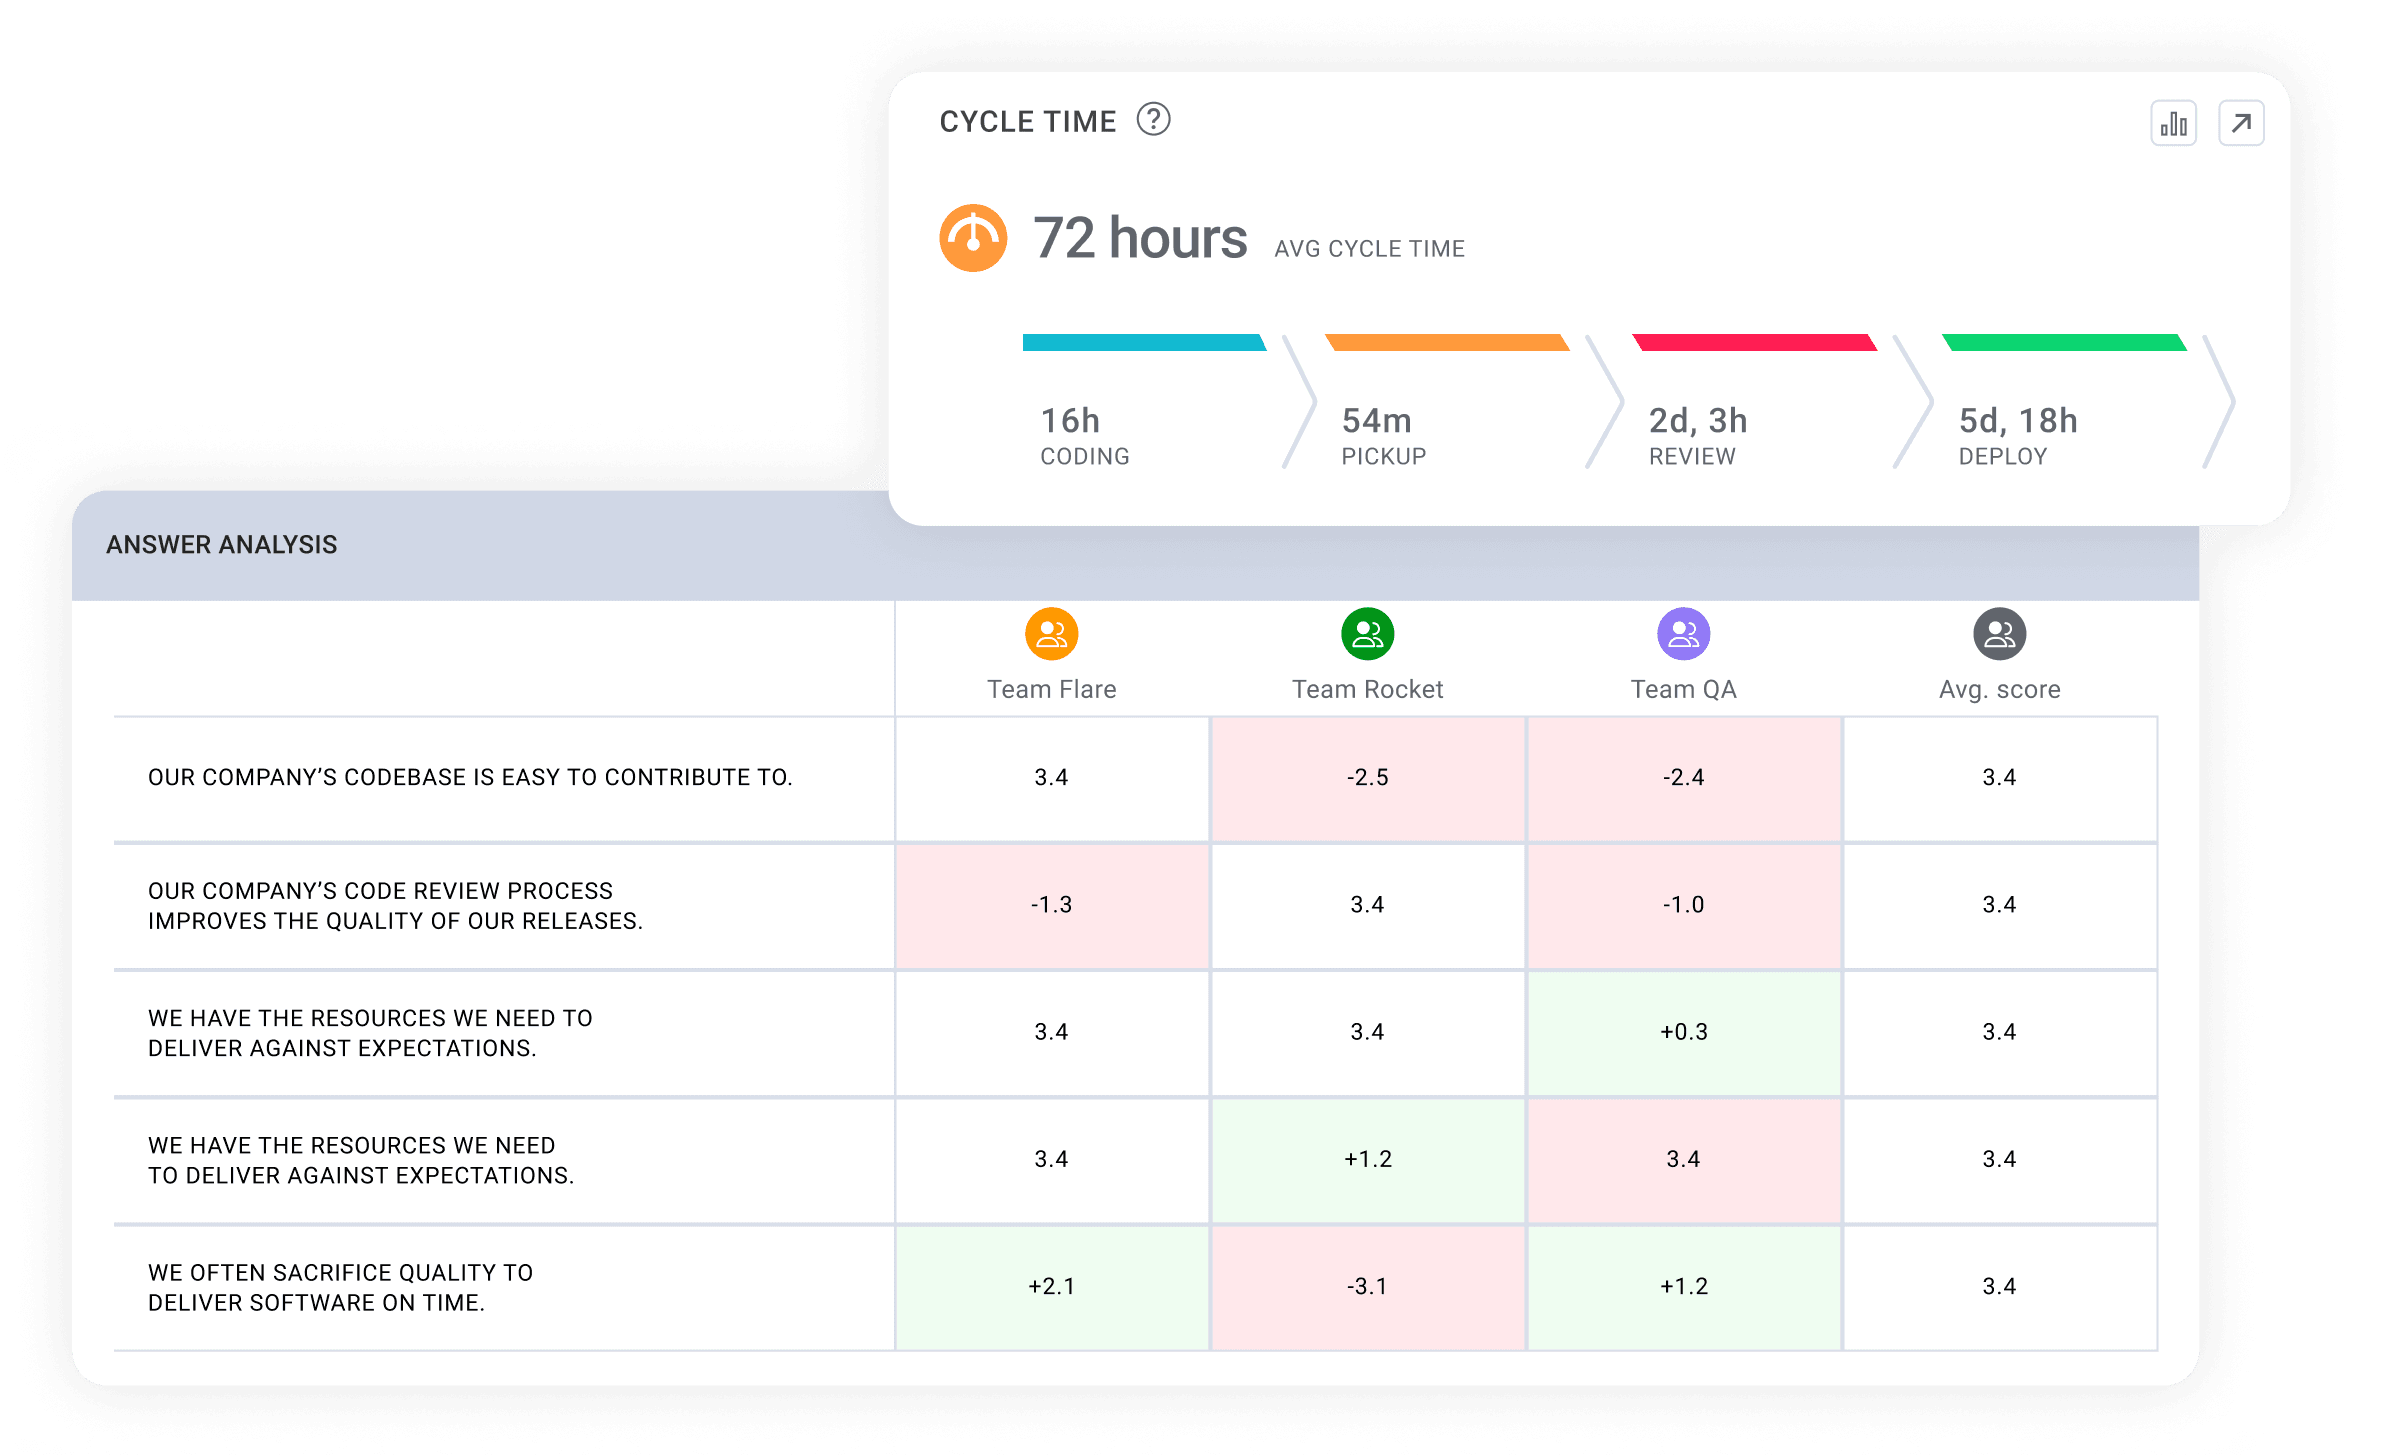
- Comprehensive Metrics + Surveys: LinearB goes beyond surveys, offering a mix of quantitative metrics that track real-time performance across the entire development lifecycle. This enables teams to move beyond "how we feel" to "how we perform" with data-driven clarity.
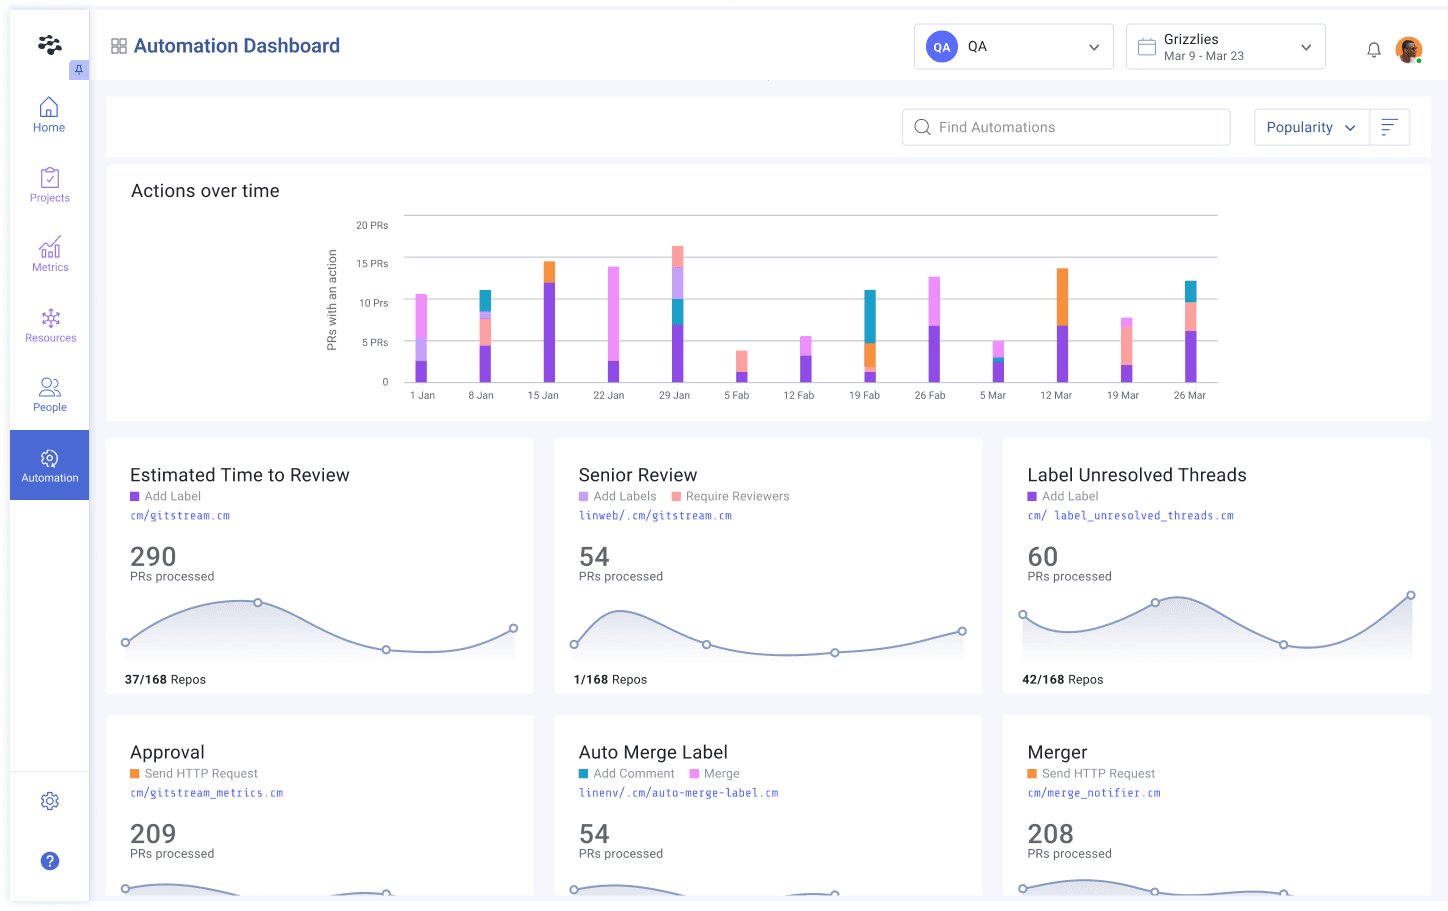
- Automation with gitStream: One of the most powerful features of LinearB is its ability to automate workflows through tools like gitStream, which helps teams streamline code reviews, reduce cycle times, and optimize developer efficiency without manual intervention.
- Developer Coaching and Goal Setting: LinearB’s platform incorporates automated coaching through its WorkerB bot assistant, which helps teams set personalized goals, monitor progress, and improve individual performance. This personalized coaching differentiates LinearB by focusing on improving the people component of the developer experience.
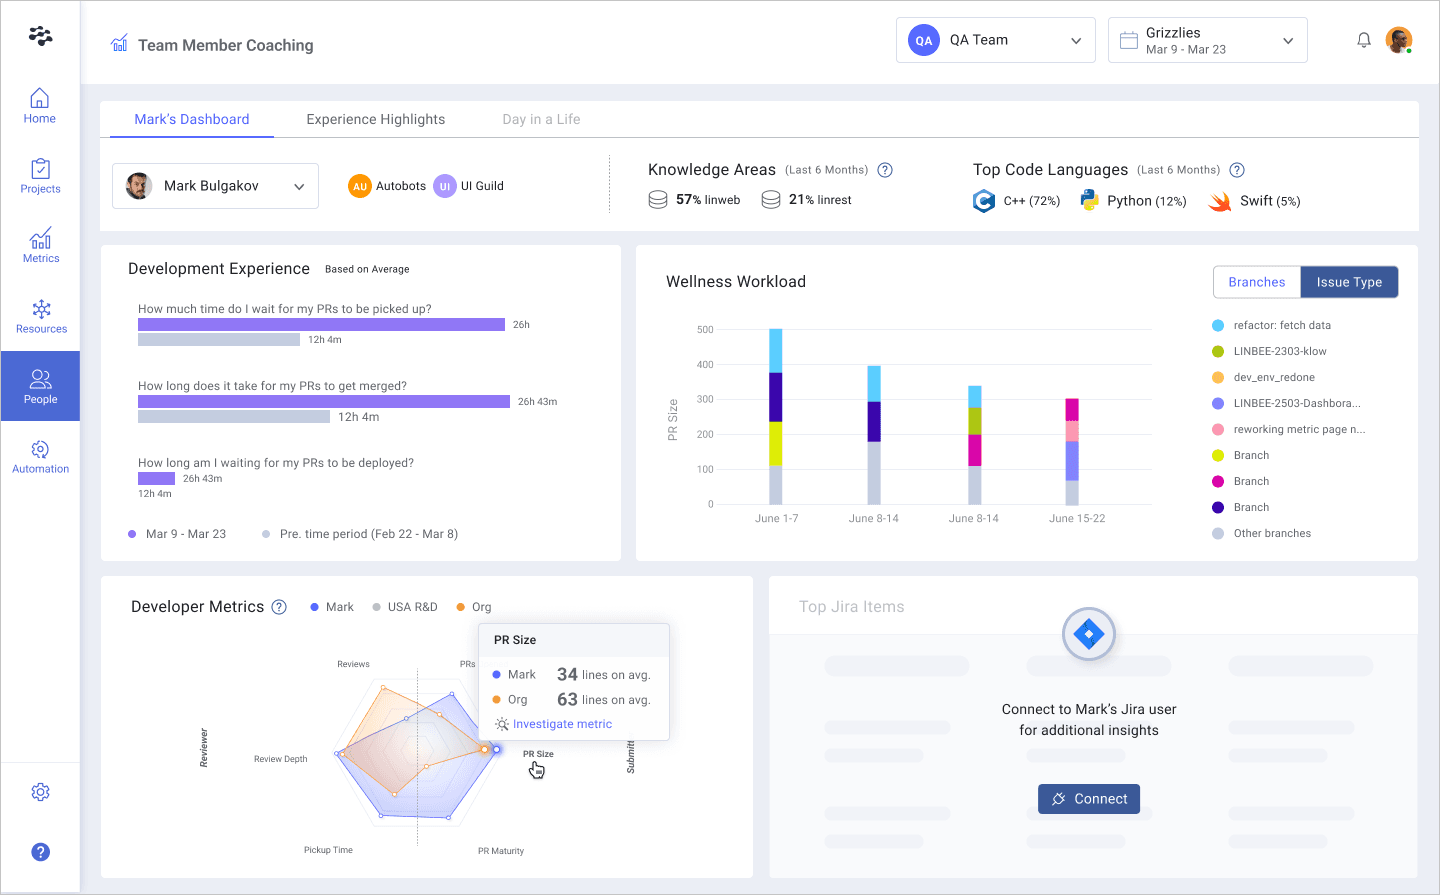
- End-to-End Visibility: Unlike DX, LinearB integrates data from all stages of the SDLC, providing a complete picture of how work is being done and where improvements can be made. This visibility is key for engineering leaders looking to optimize resources and ensure predictable project delivery.
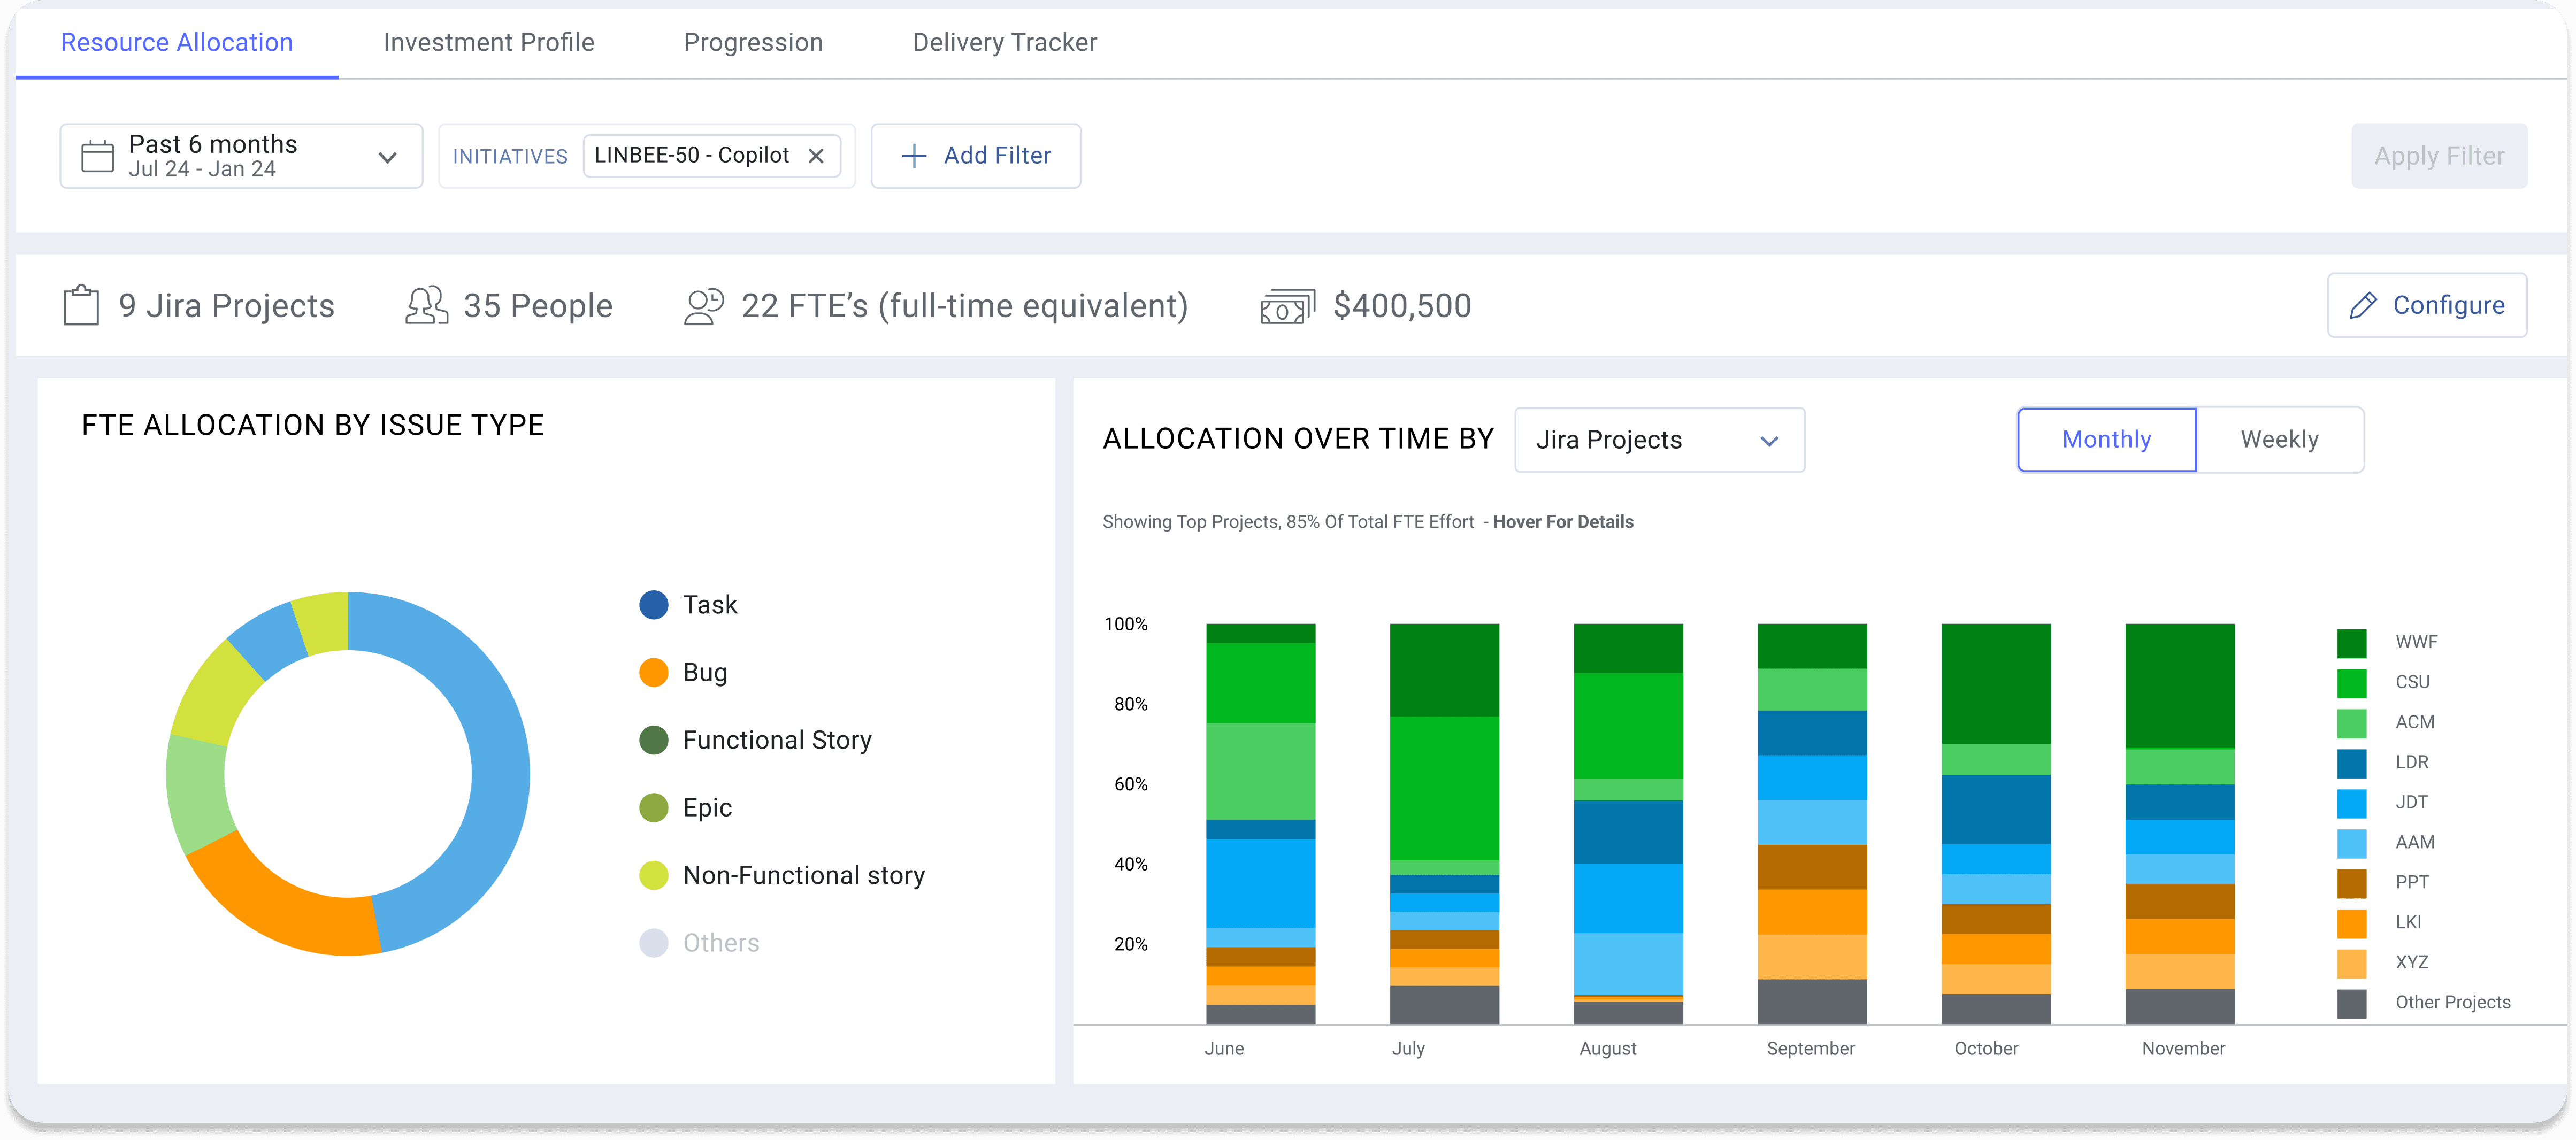
- Business Alignment: LinearB’s platform helps align engineering efforts with business objectives through deep insights into resource allocation, investment profiles, and forecasting. Leaders can track the direct impact of engineering work on business outcomes, ensuring that technical decisions are aligned with organizational goals.
Key Differentiators: Why LinearB Outperforms DX
Both LinearB and DX recognize the importance of metrics and surveys in tackling the complex challenges of developer productivity and experience. However, LinearB’s platform stands out for its comprehensive, integrated approach that covers the full spectrum of engineering operations.
- DX vs. LinearB: Better Quantitative Insights
DX relies heavily on surveys, but LinearB combines both metrics and surveys to provide a fuller picture of developer experience. Metrics such as cycle time, deployment frequency, and lead time for changes provide objective insights into team performance, helping leaders make data-driven decisions. LinearB’s commitment to transparency in metrics ensures that engineering leaders get actionable insights without the guesswork that comes with self-reported data.
For example, LinearB offers tools to track DORA Metrics — key performance indicators for high-performing DevOps teams. With these metrics, teams can measure and improve software delivery performance, a capability not fully addressed by DX.
- DX vs. LinearB: Automation That Drives Real-Time Improvements
DX offers insights but lacks the ability to operationalize them. LinearB bridges this gap with automation capabilities, particularly through its gitStream and WorkerB bot. These tools enable continuous improvement by automating repetitive tasks, optimizing workflows, and providing real-time feedback. The result is faster code reviews, shorter cycle times, and improved developer productivity without the need for manual intervention.
In contrast, DX requires manual analysis and interpretation of survey data, leaving teams to figure out how to improve on their own. LinearB’s automated solutions provide engineering leaders with the practical tools needed to enact immediate improvements.
- DX vs. LinearB: Developer Coaching and Team Goals
While DX offers high-level metrics, it lacks individualized coaching and goal-setting features. LinearB, on the other hand, excels in this area with its integrated developer coaching. The WorkerB bot helps teams set and track progress toward goals, offering insights into individual workload and team dynamics.
This focus on personalized coaching ensures that every team member can continuously improve, contributing to overall organizational success. It also differentiates LinearB’s platform from DX, which provides abstracted survey results without offering actionable recommendations for individuals or teams.
DX vs. LinearB: Recommendations for Teams Evaluating SEI Platforms
When evaluating SEI platforms like LinearB and DX, engineering leaders must consider the full scope of their needs: from metrics and automation to resource allocation and business alignment. Here are key recommendations for choosing the right SEI platform:
- DX vs. LinearB: Prioritize Automation
To improve efficiency at scale, automation is critical. Platforms like LinearB’s gitStream enable engineering teams to automate repetitive tasks, optimize code reviews, and shorten cycle times—giving teams more time to focus on high-impact work.
- DX vs. LinearB: Invest in Developer Coaching
Teams are most productive when they have the tools to continuously improve. LinearB’s integrated coaching features empower individuals and teams to set measurable goals and track progress, leading to continuous performance improvements.
- DX vs. LinearB: Ensure Business Alignment
SEI platforms should not only provide insights into engineering performance but also align those efforts with business outcomes. LinearB’s platform excels at this by offering deep insights into resource allocation, project forecasting, and investment profiles, ensuring that engineering efforts directly contribute to business value.
- DX vs. LinearB: Cost and value analysis for development teams
LinearB offers a free plan that provides essential DORA insights and metrics, allowing teams to optimize their software delivery without upfront costs. This free tier includes features like cycle time and throughput analytics, aimed at improving productivity and efficiency.
DX’s pricing model centers around consulting-heavy, long-term engagements that often require a considerable investment, making it less accessible for teams seeking flexible or self-service options. This approach can drive up costs over time, as DX’s reliance on survey-based insights frequently necessitates additional consulting support for implementation and ongoing analysis.
- DX vs. LinearB: Best tools for Developer Surveys
While surveys provide valuable qualitative insights, they are not enough to drive operational improvements. Choose a platform like LinearB that combines both qualitative and quantitative data to provide a full picture of your team’s performance.
For more insights into modern practices for goal setting in engineering, check out LinearB’s guide on goal setting and reporting
DX vs. LinearB: Making an Informed Decision
When it comes to evaluating features for developer experience, LinearB offers a more comprehensive, actionable SEI platform than DX. By combining both quantitative metrics and qualitative surveys, providing automation tools, and offering personalized developer coaching, LinearB ensures that engineering leaders can optimize both developer productivity and business alignment.
Engineering teams looking to invest in an SEI platform should prioritize solutions that offer both real-time insights and practical tools for improvement. With its ability to bridge the gap between data and action, LinearB is the superior choice for engineering leaders who are serious about driving operational excellence.
To learn more about how LinearB compares to DX, visit our comparison page.

