Calculating cycle time is critical for every engineering leader to determine how your devs and SDLC process works. It’s also a key metric to measure engineering efficiency and productivity, so tracking it is on top of every manager’s priority list.
Below, we will learn how to calculate cycle time and its importance, but first, let’s see how it relates to software development.
Table of Contents
- What is Cycle Time?
- How to Calculate Cycle Time
- What is a Good Cycle Time?
- Improving Your Engineering Team’s Cycle Time
What is Cycle Time?
Cycle time (also known as lead time for changes by DORA) is a concept borrowed from lean manufacturing; its meaning originates from a modern production floor. The production cycle time would depend on several factors in a typical manufacturing environment.
These would include the arrival time of raw materials and the amount of time it takes for these materials to undergo processing, quality control, all the way to packaging. Any delays along the way will impact the subsequent production processes, increasing the net production time.
When this concept is applied to the software development world, it doesn’t lose its meaning or significance. Here, software development cycle time refers to the time it takes from the moment a software project begins to when the final product is delivered. In other words, it’s the period of time between the first commit and the release to production.
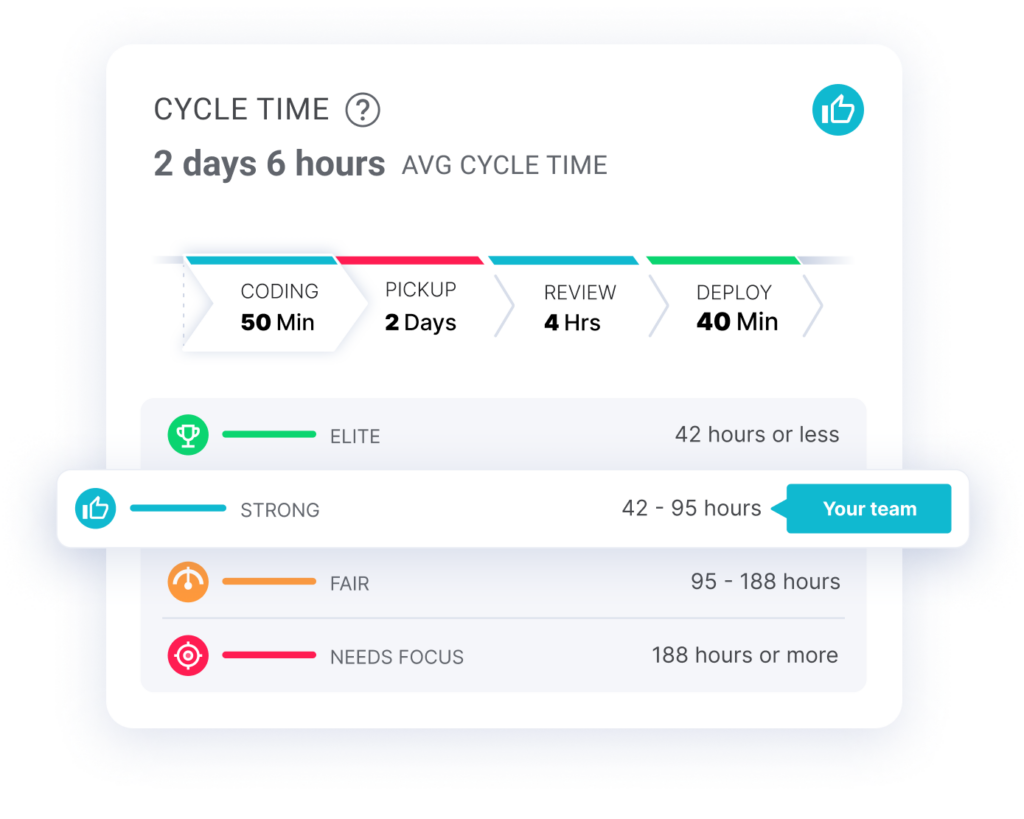
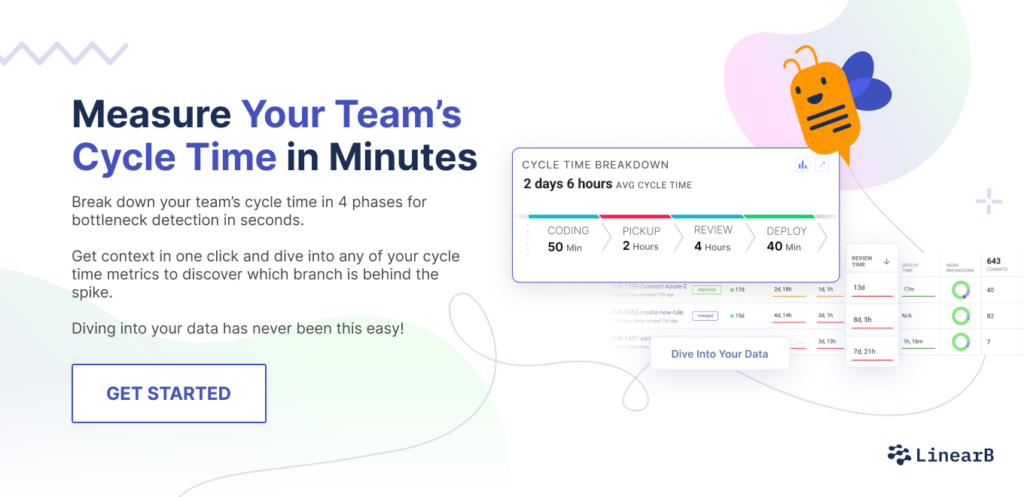
Cycle time can measure the end-to-end development process or be broken into sections relevant to the project in question. For instance, at LinearB, we measure coding time, pull request pick time, review time, and deployment time individually, as well as combine these four as part of the total cycle time formula.
How to Calculate Cycle Time
To calculate cycle time, you track from when your developer(s) begins work on a branch until that branch is released to production. You can track these either through your project management status or Git activity. At LinearB, we automatically start calculating cycle time when your devs make their first commit, and we can track your releases through tags, dedicated branches, or our Release API.
Cycle Time = Release Time – First Commit Time
In other words, if you make your first commit at noon on January 5 and that branch is released at 2pm on January 15, your cycle time is 10 days 2 hours.
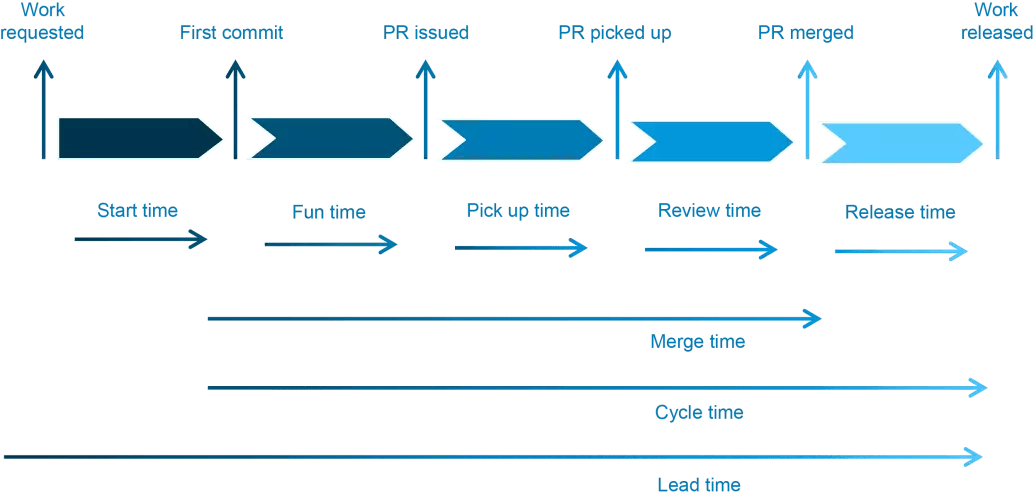
And the key to improving engineering efficiency is deeply understanding your cycle time. Let’s look at each of the four phases of cycle time:
- Coding Time (aka Fun Time): We calculate coding time from first commit to when a pull request or merge request is created.
- Pickup Time: We calculate pickup time from when the PR is created to when the review begins.
- Review Time: We calculate review time from the start of the review to when the code is merged.
- Deploy Time (or Release Time): We calculate deploy time from when the code is merged to when it is released.
You should then look at your cycle time phases in various ways: at the organization level, by team, by iteration, and even as deeply as a specific branch. For example, if the average review time for this iteration is 40 hours, you’d want to know which specific branches are above this average to determine how to help your team remediate these bottlenecks and move these reviews through the pipeline.
What is a Good Cycle Time?
Once you’ve calculated your cycle time and the four cycle time phases, how do you know where you’re doing well and which area needs the most focus? Our data science team at LinearB studied nearly 2,000 engineering teams to develop a set of engineering benchmarks, including cycle time.
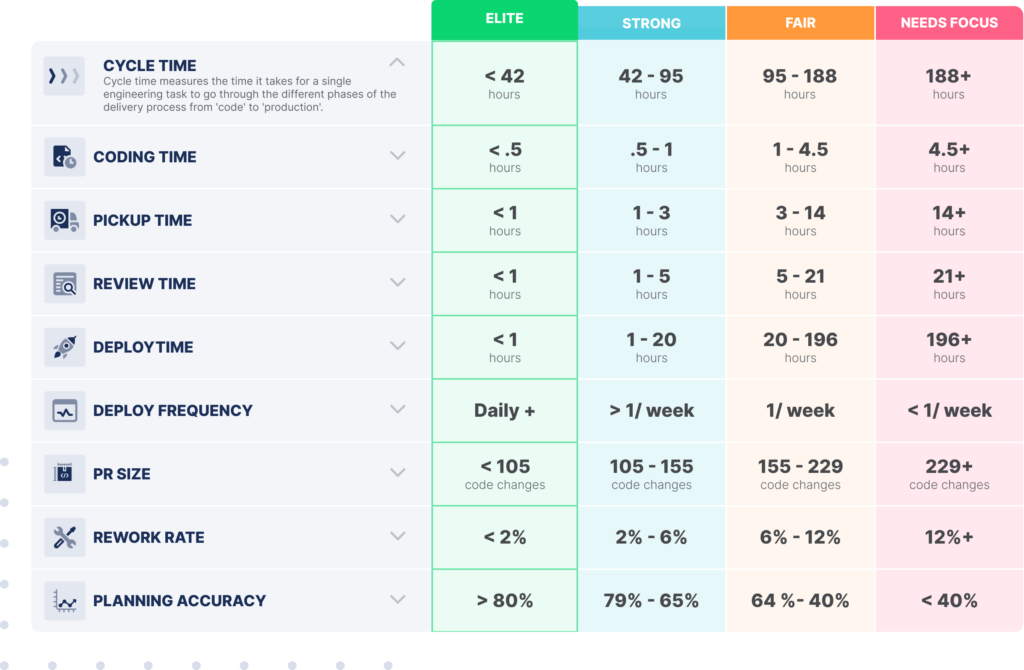
Let’s look back at the first cycle time calculation we shared. If your average cycle time is 10 days and 2 hours, your software development lifecycle needs focus! This means that there are serious bottlenecks throughout the software development journey. And it’s likely that your review time is the most problematic.
Perhaps one member of the team is out sick and forgot to reassign a pull request. Perhaps two of your team members are struggling to come to an agreement on a code review and need mediation. These are actionable items that you can help with once you dive into the data to understand which specific branches are causing the delays.
Improving Your Engineering Team’s Cycle Time
Once you know how to calculate your cycle time, you need to adopt this metric as part of your operational strategy. When implemented correctly, this can be the difference between happy and disappointed customers or engaged employees and frustrated managers.
That said, keeping track of your software development cycle time requires more than just awareness. You need the right tools and processes for improving engineering efficiency. This is where LinearB uses automation to streamline workflow optimization.
We recommend setting quarterly KPIs using our Team Goals product and enabling our WorkerB bot to warn your team members when they need to course-correct certain behaviors that aren’t meeting the established team goals.
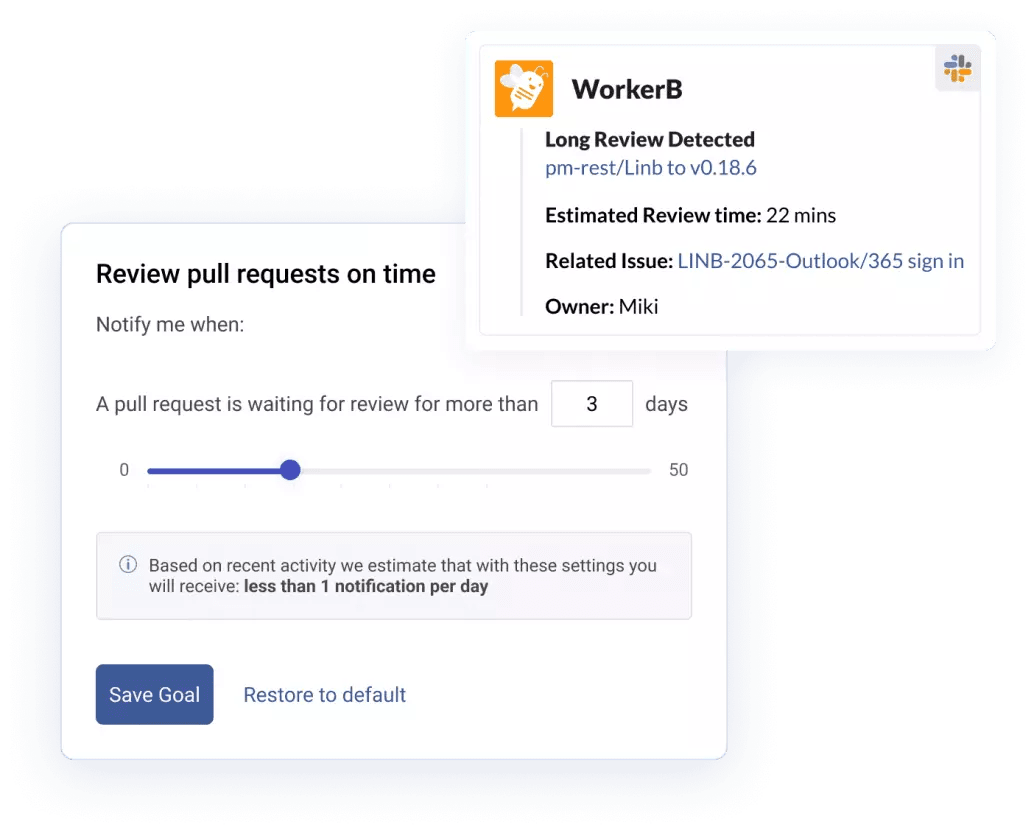
All of our Team Goals are customizable to your needs, and WorkerB notifications can be integrated with both Slack and MS Teams. We’d love the chance to show you how you can improve your engineering efficiency with LinearB. Book a demo or sign up for a free-forever today.
But don’t just take our word for it!