# Improve Your Iterations with Better Jira Reporting | LinearB Blog

> Jira is among the most-used platforms for software development teams today. It is a great organizational tool that teams rely upon to track tasks, issues, stories, and epics in product and sprint backlogs.  But Jira can also enable you to boost your development team’s velocity and plan your iterations more accurately.  In this post, we’re [&hellip;]

_This is a markdown rendering of a live HTML page on linearb.io, generated for AI/LLM consumption — it is not a markdown-only site. To get the full HTML page instead, request this URL with an explicit `Accept: text/html` header (no wildcard, no markdown preference)._

[Blog](https://linearb.io/blog)

/

Improve Your Iterations with Better Jira Reporting

# Improve Your Iterations with Better Jira Reporting

![Photo of Tris Pedro](https://assets.linearb.io/image/upload/c_limit,w_2560/f_auto/q_auto/v1/logo-mark-lg?_a=BAVMn6ID0)

By [Tris Pedro](https://linearb.io/blog/improve-your-iterations-with-better-jira-reporting#tris-pedro)

|

June 28, 2022

![towfiqu_barbhuiya_Q69ve_Nk1i_JQ_unsplash_995931f1d7](https://assets.linearb.io/image/upload/c_limit,w_2560/f_auto/q_auto/v1/towfiqu_barbhuiya_Q69ve_Nk1i_JQ_unsplash_995931f1d7?_a=BAVMn6ID0)

Jira is among the most-used platforms for software development teams today. It is a great organizational tool that teams rely upon to track tasks, issues, stories, and epics in product and sprint backlogs. 

But Jira can also enable you to boost your development team’s velocity and plan your iterations more accurately. 

In this post, we’re going to look at a powerful, yet often overlooked, feature in Jira: reports. We’ll also look at how Jira reports don’t provide you with all the context you need and how LinearB solves this problem.

## Table of Contents

* [What Are “Reports” in Jira?](#What-Are-Reports-in-Jira)
* [The 4 Most Valuable Jira Reports](#The-4-Most-Valuable-Jira-Reports)
* [The Bottom Line](http://The-Bottom-Line)

## **What Are “Reports” in Jira?**

In a nutshell, reports in Jira are visual representations of data that is generated by using Jira. A report includes one or more charts. You can use reports individually, but typically they are used in a [Jira dashboard](https://linearb.io/blog/jira-dashboard/).

By design, Jira software is quite open (they even have their own querying language!) so you have lots of freedom to slice and dice your data. You can create your own Jira custom reports from scratch or leverage any number of [integrations](https://linearb.io/blog/jira-analytics/) available in the [Atlassian Marketplace](https://marketplace.atlassian.com/search?query=reports). 

With so many options, it can be hard to know where to even start, and even harder to know which ones you should be using. Below is a quick rundown of the most widely-used Jira reports, which you can use to quickly pick out the ones that seem most suited to your needs. 

* Resolution time report: Tells you how long it is taking your team to resolve issues
* [Version workload report](https://confluence.atlassian.com/jira064/version-workload-report-720416066.html): Shows you the WIP for each team member in the current iteration
* User workload report: Shows you the WIP for an individual team member across iterations
* [Time tracking report](https://confluence.atlassian.com/jira064/time-tracking-report-720416014.html): Tells you how much time has been spent on individual issues, how much time is left, and whether you are on track to deliver on time
* Average age report: Shows the average age of unresolved issues
* [Time since issues report](https://confluence.atlassian.com/jira064/time-since-issues-report-720416057.html): Shows you how many issues were created/updated/resolved/etc. on each day within a particular date range
* [Epic report](https://support.atlassian.com/jira-software-cloud/docs/view-and-understand-the-epic-report/): Shows you your progress for a specific epic
* [Cumulative flow diagram](https://support.atlassian.com/jira-software-cloud/docs/view-and-understand-the-cumulative-flow-diagram/): Shows you the amount of work completed over time broken down by type

## **The 4 Most Valuable Jira Reports**

Among all the Jira reports, there are 4 that stand out as the most valuable. Before we look at those, it’s important to note that all Jira reports face a big limitation: They can only leverage Jira data. 

This is a problem because it deprives you of context about where your team is spending their time. On the Dev Interrupted podcast, Rukmini Reddy, VP of Engineering at Slack, spoke with LinearB’s Co-founder, Dan Lines, about how context is vital in order to fully understand your team’s capacity and their well-being and to identify the factors holding them back. 

By combining data from Jira with data from Git, LinearB opens up entirely new depths of insights. In Jira, you can see that an issue or project is behind schedule or how your team has performed over time. But Jira doesn’t provide you enough context to answer the “why”: **Why** are we behind schedule? **Why** aren’t we shipping features more quickly? **Why** are so many bugs popping up? For that, you need a tool like LinearB. 

### **1\. Sprint Report**

The [sprint report](https://support.atlassian.com/jira-software-cloud/docs/view-and-understand-the-sprint-report/) is the most widely-used Jira report, because it contains the [sprint burndown chart](https://linearb.io/blog/sprint-burndown-chart/), which has become a key tool in scrum. 

The sprint burndown chart shows you how much work you’ve completed in a sprint and how much work you have left, which gives you a picture of the sprint’s overall status. At a glance, it answers the question, “How is the sprint going?” 

Beneath the chart, you can look at individual issues. You can see when they were completed and how many story points they were worth. 

However, the sprint report doesn’t tell you what kind of issues your team has completed. The sprint report can tell you that you completed, say, 50 story points, but it won’t tell you whether those points consisted of planned or unplanned work, functional stories or bug fixes. Some people use the [“single level group by” report](https://community.atlassian.com/t5/Jira-Software-questions/How-to-use-quot-Single-Level-Group-By-quot-Report/qaq-p/1543019) in Jira, but still this isn’t great because it creates a report per issue type.

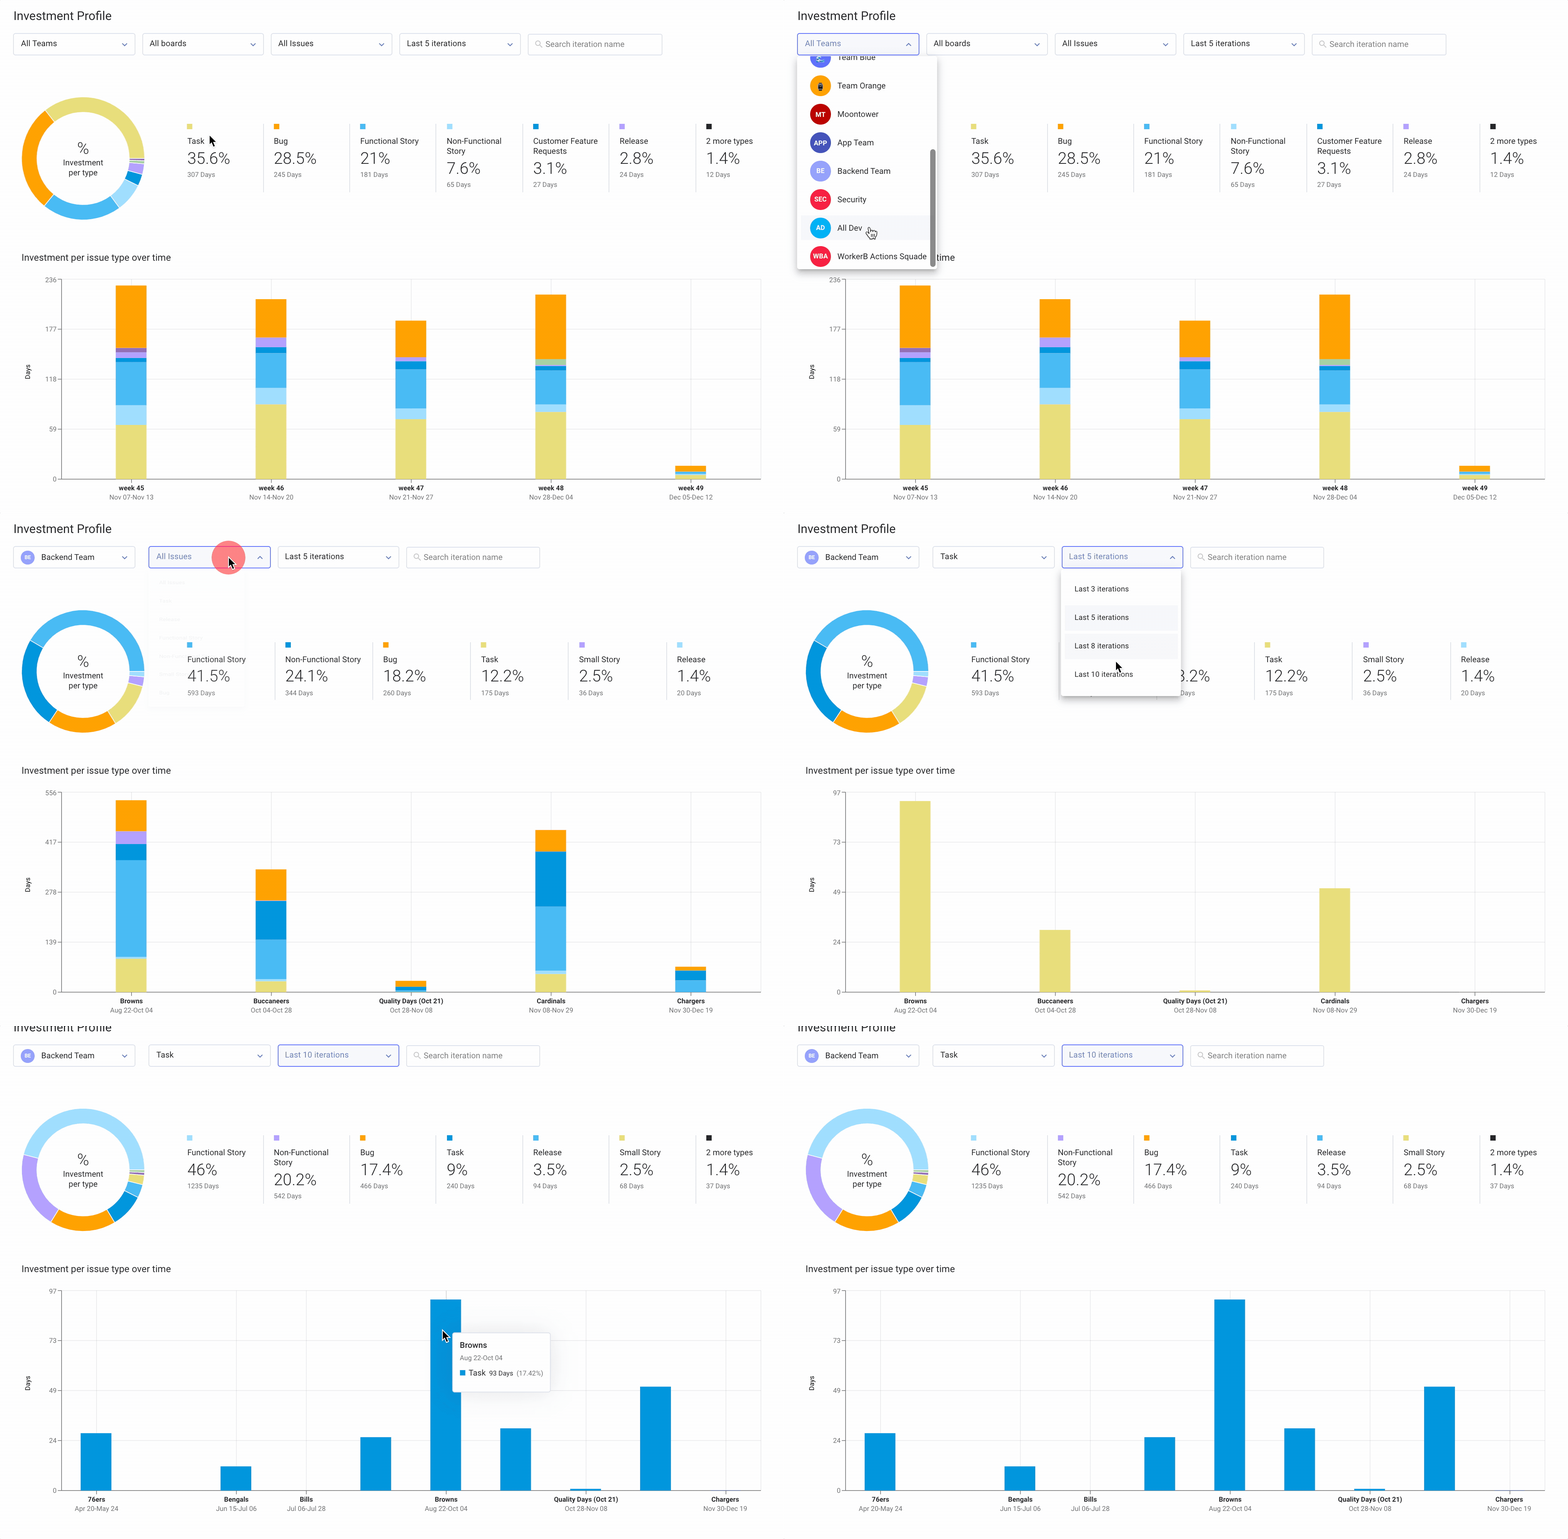
What you need is one chart that combines all the different issue types. This is exactly what the Investment Profile feature is in LinearB. In one pie chart, you can see exactly where your development resources are going. 
## **2\. Created vs. Resolved Issues Report**

Dev teams are under constant pressure to deliver more features. But sometimes too much has been asked of the development team and the company is headed for a disaster. The [created vs. resolved issues report](https://confluence.atlassian.com/jira064/created-vs-resolved-issues-report-720416052.html) prevents that. 

By showing you the number of issues that have been created and the number of issues that your team has resolved, you can know whether your team is keeping up, getting ahead, or falling behind. This visibility allows you to stay ahead of any problems, advocate hiring more developers, manage expectations, and avoid overwork and crises. 

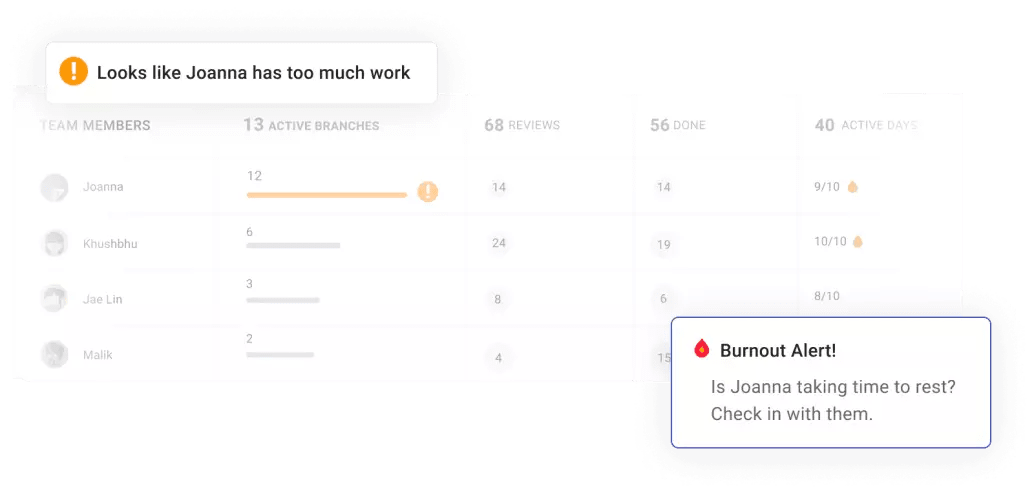
But this report faces a big limitation: It doesn’t tell you how much work each developer is taking on. In fact, if the created vs. resolved issues report looks healthy for the whole team, it’s even easier to overlook the possibility that too much has been put on the plate of an individual.

By connecting data from Git branches and commits to Jira data like issues, LinearB can help you manage the workloads of individual developers. We’ll even proactively alert you if a team member has maybe taken on too much Work in Progress (WIP) and is at risk of burning out. 
![team health](https://assets.linearb.io/uploads/Group-1308_2x-1024x490.png)

## **3\. Velocity Report**

For each sprint, the [velocity chart](https://support.atlassian.com/jira-software-cloud/docs/view-and-understand-the-velocity-chart/) shows you 2 bars: the number of story points the scrum team committed to and the number they completed. This enables you to see how well you are scoping your sprint goals.

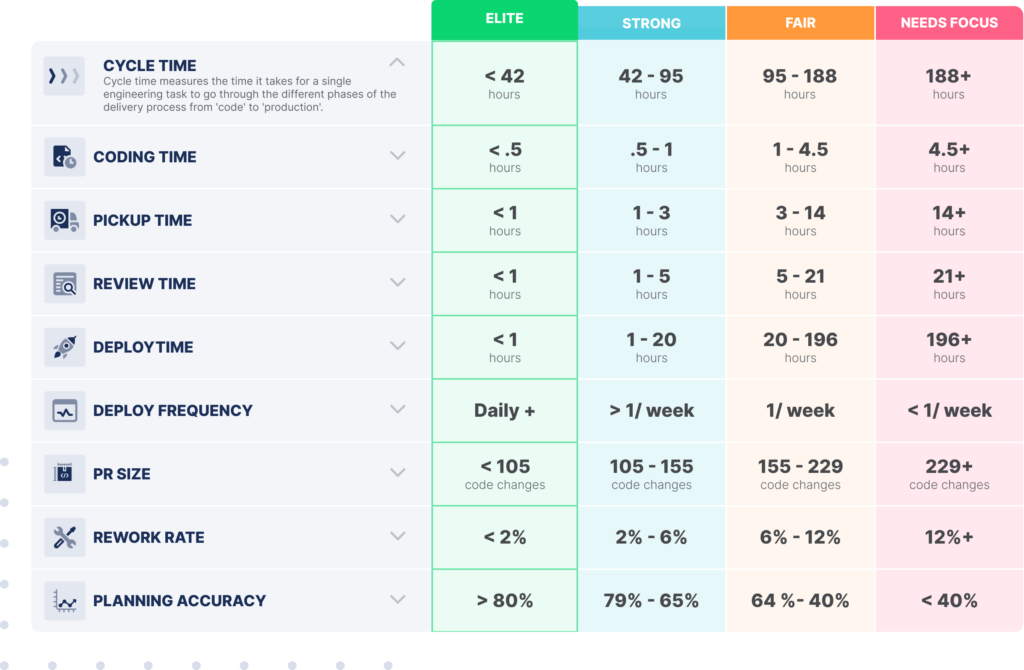
Planning accurately is one of the most important things engineering leaders can do, yet it is one of the hardest. In LinearB’s groundbreaking [Engineering Benchmarks Study](https://linearb.io/engineering-benchmarks/), we determined just how hard it is. We analyzed almost 2,000 dev teams and found that elite teams (the top 10%) only had a planning accuracy of 80% or higher! Strong teams had a planning accuracy of between 65% and 79%. 
![Engineering benchmarks chart](https://assets.linearb.io/uploads/benchmarks-chart-1024x670.png)

Want to learn more about being an elite engineering team? [Check out this blog](https://linearb.io/blog/engineering-metrics-benchmarks-what-makes-elite-teams/) detailing our engineering benchmarks study and methodology.

When you combine benchmarks with metrics, you can confidently identify areas of improvement and set realistic goals. The rule of thumb we recommend at LinearB is to aim for a one tier improvement (e.g. from “fair” to “strong”) over one quarter. 

We even created a whole Team Goals system that enables you to set goals in collaboration with your team. You can then track your progress against those goals and use tools like our WorkerB automation bot to help you achieve them. For example, if your goal is to drive down PR size (a [terrific goal](https://linearb.io/blog/the-pull-request-paradox-merge-faster-by-promoting-your-pr/) to have, by the way!) then you can ask WorkerB to send out a reminder to someone when they create a PR that exceeds the goal the team has set. 

[![Nobody wants to review your huge pull request.](https://assets.linearb.io/uploads/pr-size-get-started-1024x497.png)](https://linearb.io/get-started/)

Improve your code quality and developer workflow with smaller pull requests. [Get started with your free-forever LinearB account today.](https://linearb.io/get-started/)

## **4\. Control Chart**

The [control chart](https://support.atlassian.com/jira-software-cloud/docs/view-and-understand-the-control-chart/) shows you two things: 

1. Your average cycle time over time
2. The variance of your cycle time over time

[Cycle time](https://linearb.io/blog/cycle-time-measuring-and-improving-team-process/) is the engineering super-metric. Any issue, any bottleneck, any improvement will be reflected in your cycle time. It answers perhaps the most important question facing engineering leaders and their teams all the time: How fast are we going? 

Knowing the variance of your cycle time from sprint to sprint enables you to plan more accurately and also know that the processes on your dev team are refined and reliable. Large variance means that there is a lot of [risk](https://linearb.io/blog/risk-management-in-software-engineering/) in the code your team is shipping which is leading to unforeseen work. 

LinearB enables you to understand your cycle time far more deeply than the control chart. First, we break down cycle time into its 4 individual components. And in just one click, you can see the cycle times of the individual Git branches that are driving the bottlenecks you see in individual cycle time stages. 

With context like this, you can find solutions to slow cycle times in seconds. 
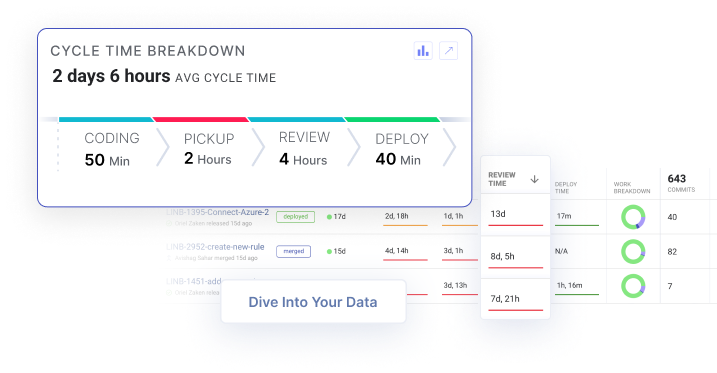
Get context around cycle time bottlenecks in one click. Diving into your data has never been this easy. [Get started with our free-forever account today!](https://linearb.io/landing-cycle-time/)

## **The Bottom Line**

Jira is a popular tool for good reason. It’s easy to use and it has the key pieces that enable teams to organize and coordinate their work. In this post, we learned that Jira has charts and reports that can help you go beyond just organizing epics, stories, and issues and start optimizing your processes. But we also learned that even these advanced features have serious limitations. 

With the depth of insights you get with LinearB, you can have full context on your dev team. When you pair our metrics with our tools like the engineering benchmarks, Team Goals, and our WorkerB automation bot, you have a powerful, integrated tool to drive sustained improvement at every level of your team and at every stage of your development process. 

To learn about all the ways LinearB can empower you to deliver on your promises and your team to ship more features faster, [set up a demo today](https://linearb.io/get-started/). 

Want to improve your engineering processes at every level? [Get started with a LinearB free-forever account today!](https://linearb.io/get-started/)

## Improve developer productivity with LinearB

Find us on

[](https://www.linkedin.com/company/linearb)
[](https://devinterrupted.substack.com/)

## Your next read

[![Cover image for AI ROI comes from measuring engineering outcomes on day one](https://assets.linearb.io/image/upload/c_limit,w_2560/f_auto/q_auto/v1/Blog_AI_ROI_comes_from_measuring_engineering_software_security_2400x1256_2c5eae0862?_a=BAVMn6ID0)](https://linearb.io/blog/kraken-nik-sudan-measure-ai-roi-engineering-outcomes)

Eng. Metrics

[AI ROI comes from measuring engineering outcomes on day one](https://linearb.io/blog/kraken-nik-sudan-measure-ai-roi-engineering-outcomes)

Kraken Engineering Operations Lead Nik Sudan details how to establish day-one data infrastructure to accurately measure AI ROI. Discover why raw token adoption...

[![Cover image for AI is rebuilding software delivery from SDLC to ADLC](https://assets.linearb.io/image/upload/c_limit,w_2560/f_auto/q_auto/v1/Blog_AI_rebuilding_software_delivery_2400x1256_3fd5887e75?_a=BAVMn6ID0)](https://linearb.io/blog/sdlc-to-adlc-agentic-software-delivery-transformation)

Eng. Metrics

[AI is rebuilding software delivery from SDLC to ADLC](https://linearb.io/blog/sdlc-to-adlc-agentic-software-delivery-transformation)

Discover how engineering organizations are transitioning from the traditional SDLC to an Agentic Development Lifecycle (ADLC). Learn why rising token costs...

[![Cover image for 8 million pull requests reveal where engineering productivity breaks down](https://assets.linearb.io/image/upload/c_limit,w_2560/f_auto/q_auto/v1/Blog_8_million_pull_requests_2400x1256_03724bfbb2?_a=BAVMn6ID0)](https://linearb.io/blog/8-million-prs-engineering-productivity)

Eng. Metrics

[8 million pull requests reveal where engineering productivity breaks down](https://linearb.io/blog/8-million-prs-engineering-productivity)

8.1M pull requests reveal the gap between AI adoption and engineering impact, and why code review is the bottleneck blocking real productivity gains.

## Structured data

_Machine-readable metadata (JSON-LD) embedded in the page for search/AI context — not content rendered on the page itself._

```json
{
  "@context": "https://schema.org",
  "@type": "Organization",
  "name": "LinearB",
  "url": "https://linearb.io",
  "logo": "https://assets.linearb.io/image/upload/v1715628027/logo-mark-lg.svg",
  "description": "LinearB is the engineering productivity platform that helps engineering leaders prove AI is improving throughput without sacrificing delivery confidence, flow efficiency, or developer experience.",
  "sameAs": [
    "https://www.linkedin.com/company/linearb"
  ],
  "award": [
    {
      "@type": "Award",
      "name": "LinearB is a Leader in the 2026 Gartner® Magic Quadrant™ for Developer Productivity Insight Platforms",
      "dateAwarded": "2026",
      "awardedBy": {
        "@type": "Organization",
        "name": "Gartner®"
      }
    },
    {
      "@type": "Award",
      "name": "Great Place to Work Certification",
      "dateAwarded": "2025-2027",
      "awardedBy": {
        "@type": "Organization",
        "name": "Great Place to Work"
      }
    },
    {
      "@type": "Award",
      "name": "America's Best Startup Employers 2025",
      "dateAwarded": "2025",
      "awardedBy": {
        "@type": "Organization",
        "name": "Forbes Magazine"
      }
    }
  ],
  "hasCertification": [
    {
      "@type": "Certification",
      "name": "SOC 1 Type 2"
    },
    {
      "@type": "Certification",
      "name": "SOC 2 Type 2"
    },
    {
      "@type": "Certification",
      "name": "GDPR Compliance certification"
    },
    {
      "@type": "Certification",
      "name": "ISO 27001"
    }
  ]
}
```

```json
{
  "@context": "https://schema.org",
  "@type": "Article",
  "headline": "Improve Your Iterations with Better Jira Reporting",
  "url": "https://linearb.io/blog/improve-your-iterations-with-better-jira-reporting",
  "author": {
    "@type": "Person",
    "name": "Tris Pedro"
  },
  "datePublished": "2022-06-28T08:00:00.000Z",
  "dateModified": "2022-06-28T08:00:00.000Z",
  "image": "https://assets.linearb.io/image/upload/v1720000000/towfiqu_barbhuiya_Q69ve_Nk1i_JQ_unsplash_995931f1d7.jpg",
  "publisher": {
    "@type": "Organization",
    "name": "LinearB",
    "logo": "https://assets.linearb.io/image/upload/v1777485755/linearb-logo-2026.png"
  },
  "description": "Jira is among the most-used platforms for software development teams today. It is a great organizational tool that teams rely upon to track tasks, issues, stories, and epics in product and sprint backlogs.  But Jira can also enable you to boost your development team’s velocity and plan your iterations more accurately.  In this post, we’re […]\n"
}
```

## More on linearb.io

### Top navigation

- [Book a Demo](https://linearb.io/book-a-demo)
- [AI Code Reviews — Catch security risks, bugs, and spec mismatches](https://linearb.io/platform/ai-code-reviews)
- [AI & Productivity Insights — See how AI tools affect cycle time and delivery speed](https://linearb.io/platform/ai-developer-productivity-insights)
- [Measure AI Impact — Track AI adoption and tie it to delivery outcomes](https://linearb.io/use-case/measure-ai-impact)
- [MCP Server — Chat with your data to spot patterns and boost output](https://linearb.io/platform/mcp-server)
- [Resource Allocation — Cost initiatives and shape your investment strategy](https://linearb.io/platform/resource-allocation)
- [Cost Capitalization — Capitalize engineering costs with audit-ready reports](https://linearb.io/platform/cost-capitalization)
- [Dev Team Management — Set targets and tie throughput to business outcomes](https://linearb.io/platform/goals-and-reporting)
- [DevOps Workflow Automation — Policy-based PR routing, approvals, and tests](https://linearb.io/platform/ai-workflow-governance)
- [AI Powered Support — Unify AI and human code delivery in one clear view](https://linearb.io/use-case/ai-powered-support)
- [Optimization — Surface friction with feedback and MCP insights](https://linearb.io/platform/developer-experience)
- [Reporting — Spot what's working and what needs attention](https://linearb.io/use-case/measuring-developer-experience)
- [Surveys — Turn developer feedback into actionable signals](https://linearb.io/platform/developer-surveys)
- [Platform overview](https://linearb.io/platform/overview)
- [Register now](https://linearb.io/event/engineering-productivity-gap)
- [Customers](https://linearb.io/customers)
- [Pricing](https://linearb.io/pricing)
- [Why choose LinearB — Explore your data. Measure performance. Act to improve it.](https://linearb.io/why-linearb)
- [APEX framework — The operating model for AI-era engineering teams](https://linearb.io/resources/apex-framework)
- [Anti-FAQ — The questions other vendors won't answer](https://linearb.io/why-linearb/anti-faq)
- [Security — Enterprise-grade compliance and zero code access](https://linearb.io/security)
- [Build vs. buy — The hidden cost of building it yourself](https://linearb.io/resources/build-vs-buy)
- [Dev Interrupted Podcast — Conversations with engineering leaders](https://linearb.io/dev-interrupted/podcasts)
- [Reports & Guides — Deep dives on productivity and delivery](https://linearb.io/resources)
- [Webinars — Expert sessions on productivity and AI](https://linearb.io/resources?category=workshops)
- [Metrics Benchmarks — See how your engineering org stacks up](https://linearb.io/resources/software-engineering-benchmarks-report)
- [Blog — Product updates and practical insights](https://linearb.io/blog)
- [Help Center — Documentation, setup, and support](https://linearb.helpdocs.io)
- [API Docs](https://docs.linearb.io/api-overview)
- [Status](https://www.linearbstatus.com/)
- [Integrations](https://linearb.io/integrations)
- [LinearB is a Leader in the 2026 Gartner® Magic Quadrant™ for Developer Productivity Insight Platforms](https://linearb.io/resources/gartner-magic-quadrant-dpi-platforms-2026)
- [Sign in](https://app.linearb.io/login)
- [Enterprise](https://linearb.io/solutions/enterprise)
- [Contact](https://linearb.io/contact-us)
- [About us](https://linearb.io/about-us)
- [Careers](https://linearb.io/careers)
- [Service agreement](https://linearb.io/services-agreement)
- [Privacy policy](https://linearb.io/privacy-policy)
- [DPA](https://linearb.io/data-processing-agreement)
- [Security FAQ](https://linearb.io/security-faq)
- [Substack](https://devinterrupted.substack.com/)

### Footer

_Additional links from the site footer, not repeated from the top navigation above._

- [GitHub](https://github.com/linear-b)
- [LinkedIn](https://www.linkedin.com/company/linearb)
- [Twitter](https://twitter.com/LinearB_Inc)