When agile development was first introduced, developers were using Excel spreadsheets and sticky notes to plan. More than one product owner ended up looking this:

Thankfully, sprint planning tools have evolved. In this post, we’ll learn how tools like Jira and LinearB’s Project Delivery Tracker (PDT) are helping development teams plan their sprints better and build better products.
Table of Contents
- The Challenge of Planning Accurately
- Sprint Planning Fundamentals
- The Tools of Modern Sprint Planning
- Empower Your Team, Empower Your Business
The Challenge of Planning Accurately
How long do you think that will take you? We’ve all been asked this, and it can be a hard question to answer. It’s even harder to answer in the context of a fast-moving software development team.
LinearB wanted to know just how difficult it was for teams to accurately plan, so we went out and studied data from almost 2,000 teams to establish some benchmarks. We found that the industry average for planning accuracy is below 50%. That means that engineering heads and team leads are wrong more than they’re right.
So, it’s not just you – planning accurately is really hard for everyone!
But thankfully, there are tools that enable you to plan better. Before we get to those, though, let’s first take a moment to establish a base of understanding of core sprint planning concepts.
Sprint Planning Fundamentals
What is Sprint Planning?
Sprint Planning is one of the 5 ceremonies in the Scrum framework. During the sprint planning meeting, you pick which items from your product backlog you will complete during the next sprint.
Many teams struggle to maintain a high degree of sprint planning accuracy because picking the right amount of work is notoriously difficult. If you take on too little work, you’re not achieving as much as you could and you’re preventing members of your team from having challenges that force them to grow. Rukmini Reddy, VP of Engineering at Slack, recently discussed on the Dev Interrupted the importance of constructive challenge and her own experience with growing through discomfort.
But if you take on too much during a sprint, this could led to delays that will cause problems in the rest of the organization, and it could leave your team feeling like they’re constantly letting the company down.
That’s why teams are increasingly leveraging things like work estimation frameworks and metrics to help teams pick the right amount of work for a sprint.
Scrum Estimation
A Scrum estimation captures how much work the team thinks a product backlog item will take.
This is an essential item on the meeting agenda for any sprint planning session. There are different methods teams use to assign specific Scrum estimates to individual user stories. In my experience, T-shirt sizing and story points are the most common techniques:
- T-shirt sizing: Developers agree on a “T-shirt” size label (XS, S, M, L, or XL) that corresponds to the “size” of the item (i.e. how much work it will take)
- Story points: Each member of the Scrum team chooses a number in the Fibonacci sequence (1, 2, 3, 5 … 21) to indicate a story point value.
Story points are more common. They have the advantage of indicating the relative size of the Scrum estimates – that is, if one item will be twice as difficult as another, it will have exactly twice the number of story points. This specificity makes it easier to plan. Another advantage is that story points make it easy to calculate sprint velocity, which is what we’ll look at next.
Sprint Velocity
Sprint velocity measures how much your team achieves in a sprint. With story points, you can just add them all up at the end of the sprint and there you go – you have your sprint velocity! This helps you to compare the amount of work planned to the amount of work achieved.
I should take a moment and make something clear: Sprint velocity should not be used to compare performance across teams. This was something LinearB’s Co-founder and COO, Dan Lines, learned early in his career as an engineering leader. Story points are subjective and are specific to each team. This means that comparing them across teams will not only result in inaccurate comparisons but could lead to resentment, unproductive competition, and teams gaming the story point system, ruining its value.
Burndown Charts
Once Scrum estimates have been assigned for user stories, the sprint backlog created, sprint goals established, the sprint can begin.
During the sprint, teams track their progress by tracking burndown, which is usually captured in a burndown chart.
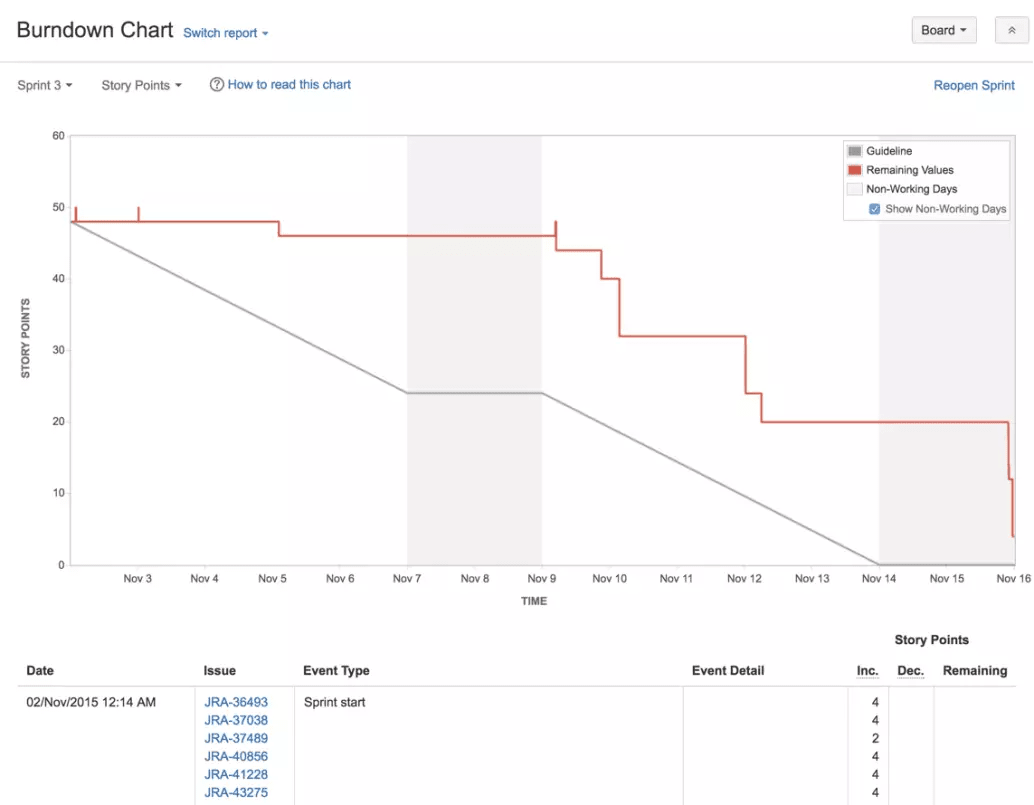
Burndown charts display both the estimated work and the actual work completed at a given point during a sprint.

This simplicity makes burndown charts a convenient and efficient way to track progress, but this simplicity also means that they have limitations:
- Everything is measured relative to your initial Scrum estimates. This means that the burndown chart is better for gauging planning accuracy than work achieved.
- It only tells you how many story points you’ve completed. Although burndown charts often also include a line for the number of issues completed, this still isn’t granular enough data.
- It doesn’t show you when specific issues were completed.
- It doesn’t show you how much work went into individual issues.
- It doesn’t show you who worked on an issue.
The Tools of Modern Sprint Planning
Jira
If you’re a software developer or product manager, it’s almost impossible to not at least have heard of Jira. Jira is the go-to software product and project management platform. Most relevant to this blog post, it has a solid set of tools to help you maintain a product backlog and plan and manage sprints, including Scrum estimations and burndown charts.
Jira is a powerful tool, but this doesn’t mean it is the perfect tool. Its biggest limitation is that it doesn’t give you granular enough data on your development processes. For example, Jira doesn’t allow you to aggregate data across multiple boards and projects. You can’t categorize issues by type, see where exactly you spent your time during a sprint, or see where individual team members invested their work. These sorts of insights are so valuable in sprint reviews and sprint planning, but you can’t get them with Jira alone.
That’s why more and more teams are turning to LinearB.
LinearB’s Project Delivery Tracker (PDT)
The LinearB platform has a number of tools to help you plan better, and you can learn about of all them here.
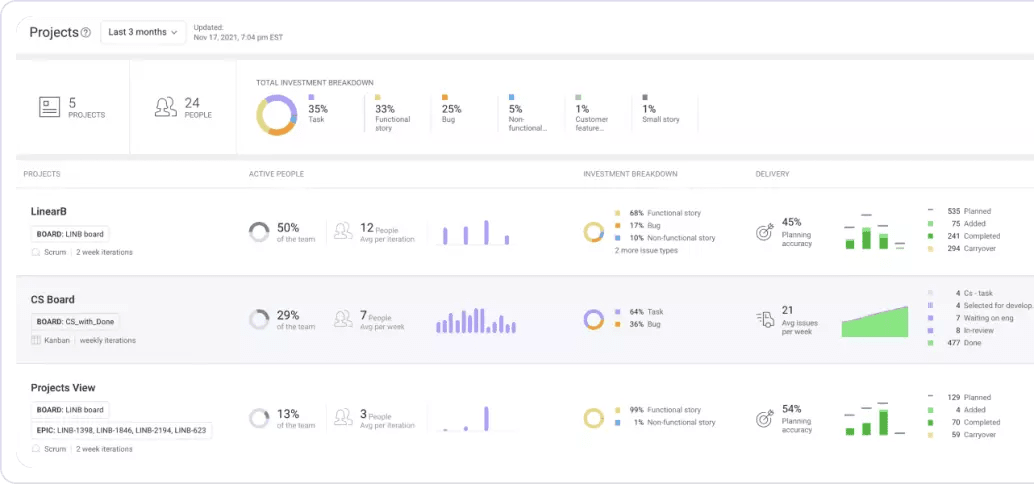
I’m going to highlight my personal favorite, the Project Delivery Tracker.
In the PDT, you can see a number of key metrics for each project like:
- How much of the team contributed
- How much of the project consisted of things like functional stories, bug fixes, and non-functional stories
- How much of a project was completed compared to what was planned
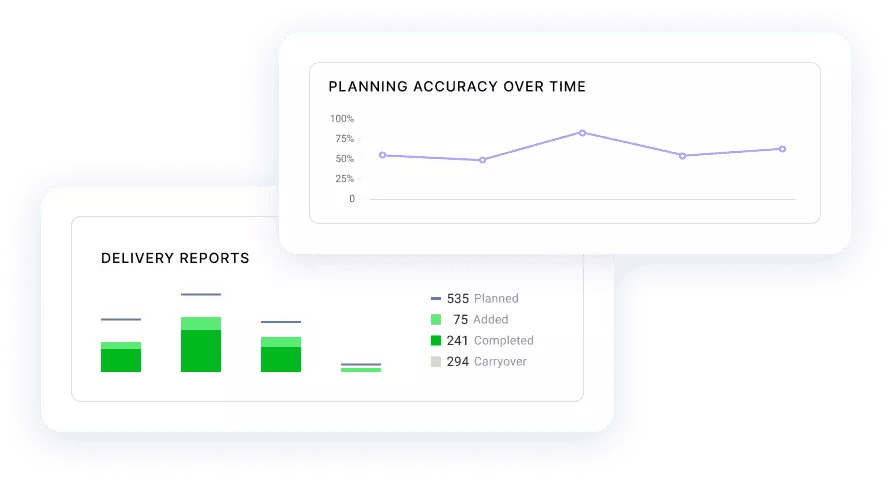
One way to think of it is the following: A burndown chart only shows you the “what” but the Project Delivery Tracker shows you “what” and the “why.” With the PDT, you can not only see how much work in the sprint backlog wasn’t completed during previous sprints, but you can understand why. You can get a better sense of your team’s capacity so that you can more accurately plan upcoming sprints.
The Project Delivery Tracker enables you to connect development work to business goals, which fosters alignment across the company and enables you to create maximum value for the business.
The PDT gives you answers to two questions that engineering leaders get all the time:
- When is Project XYZ going to be ready?
- How can we accelerate Project XYZ?
So I have to switch tools?
Nope. That’s the beauty of LinearB – it integrates with Git and Jira, as well as with other tools like GitHub and GitLab. Oh, and it takes minutes to set up.
LinearB isn’t replacing your existing tools. Instead, it complements them. By leveraging key metrics, like planning accuracy, you can get the insights you need to drive meaningful improvement in your team.
Empower Your Team, Empower Your Business
Improving your sprint planning process will enable you to better align your development work with business value. Everyone wins when that happens: By planning more accurately, your team can have the gratification of meeting their goals. You as a team lead can feel that you are leading effectively. The business as a whole will benefit even more from your team’s hard work.
With LinearB you can easily start improving your sprint planning process in addition to the rest of your development processes. To learn how, get in touch to set up a demo.