

Scrum metrics evaluate if development teams are delivering business value, working effectively, and following scrum best practices. For this reason, scrum metrics are helpful for both established and new teams.
Go beyond just tracking whether a sprint goal has been achieved or not. Tracking scrum metrics should cultivate awareness in the team’s performance and drive action to change and improve over time.
Let’s take a closer look at what scrum metrics are to understand their importance.
What Are Scrum Metrics?
Scrum metrics are part of a family of agile methodology KPIs. Almost all agile metrics can be applied to scrum teams, but scrum-specific metrics center around software delivery predictability and delivering value to customers with every iteration.
Or as we like to say at LinearB, scrum metrics measure if you’re delivering on your promises and shipping more features faster.
Scrum metrics have three major goals:
- To measure the team’s predictability
- To measure their efficiency
- To measure developer happiness
Scrum team members should use these metrics to benchmark themselves, set target goals, and develop plans for improvement.
3 Scrum Metrics Examples
With the above goals in mind, here are 3 examples of scrum metrics to consider:
1. Scrum Velocity
Scrum velocity is the average number of story points that a group has completed during the past few sprints. It is often used in sprint planning to forecast how much output a team can provide in future sprints.
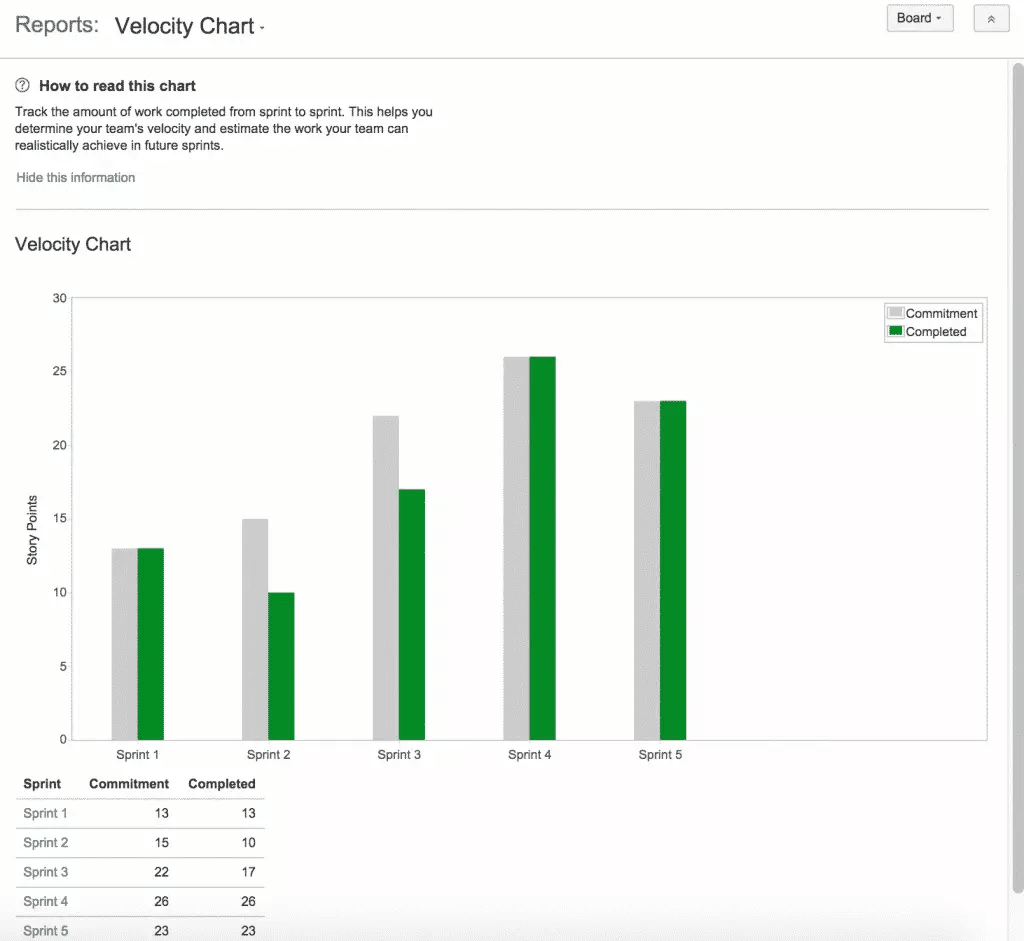
In a scrum velocity report, the team has to consider several iterations. This is because the accuracy of their forecast will depend on the number of iterations that they determine. Many scrum masters believe that the more iterations they use, the more precise their prediction is going to be.
Additionally, velocity also determines how a team works through its sprint backlog. A declining velocity often means that there is an area that needs to be improved upon.
Unfortunately, scrum velocity is a risky metric for development teams to consider. This is especially true because team velocity looks at the past, which is not an accurate predictor of the future. If you’re actually looking to improve your team’s predictability and deliver on your promises, you should look at a metric unique to LinearB called planning accuracy.
We know that planning accuracy is hard. Learn more about our six-step recipe for improvement.
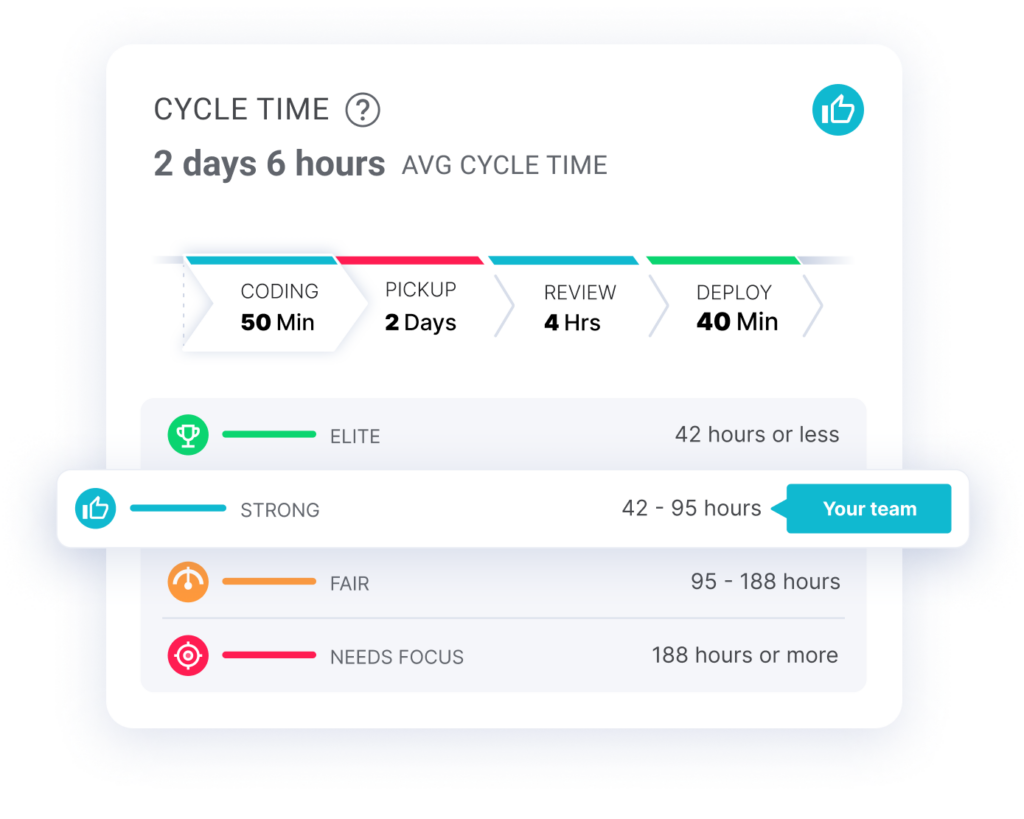
2. Cycle Time
Cycle time is a key metric for evaluating engineering efficiency. Cycle time is the time it takes a team to complete a task from the first commit until the code goes into production.
This metric is made of 4 key components;
- Coding Time
- Pickup Time
- Review Time
- Deploy Time
Cycle time evaluates how quickly a team can deliver features to its users. Teams looking to improve their engineering productivity should focus on decreasing their cycle time without compromising the quality of their outputs (i.e. without increasing change failure rate).
Our Engineering Benchmarks feature shows leaders which phase of cycle time is causing the biggest setbacks to their software development process. Then teams can set custom goals based on the areas that need improvement to overcome the challenges.
These custom Team Goals connect directly to our WorkerB bot to tackle the bottlenecks and time lags that exist within your workflow. WorkerB ensures developer workflow optimization by automating many non-coding tasks of software developers. This feature is intended to let coders do what they do best: coding.
3. WIP
WIP (work in progress) is the number of tasks started but not yet finished. Scrum teams often measure WIP and implement WIP Limits to improve developer workflow.
Many scrum teams use a Cumulative Flow Diagram from their project management tool to visualize WIP.
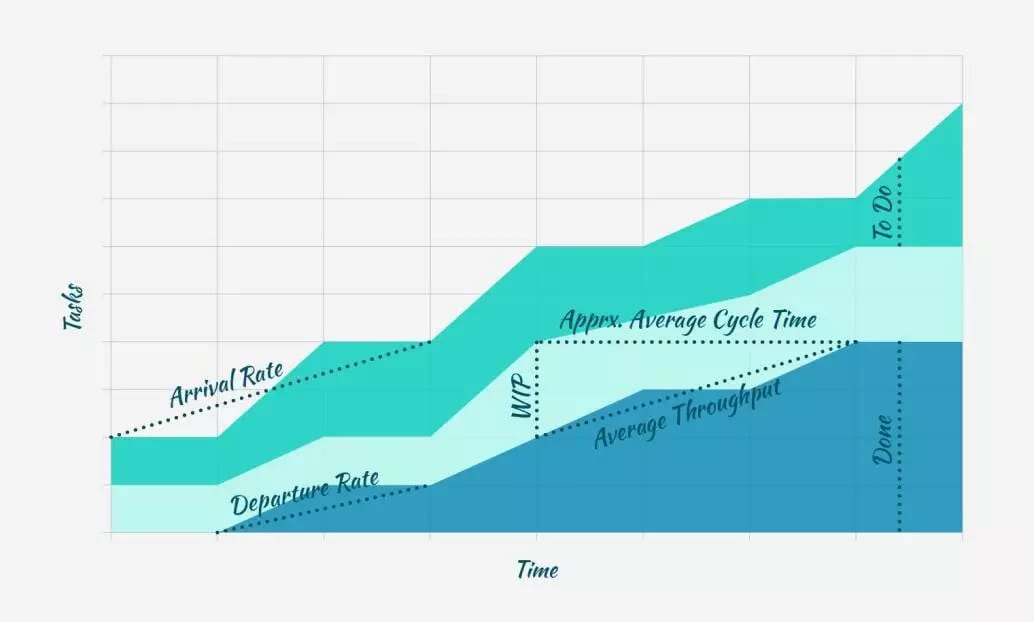 Source: How to Read the Cumulative Flow Diagram [Infographic]
The horizontal x-axis in a Cumulative Flow Diagram indicates time, and the vertical y-axis indicates issues. Each colored area of the chart equates to a workflow status. In the simple version above, the bottom color shows what’s done, the middle area shows WIP, and the top area shows work left to do.
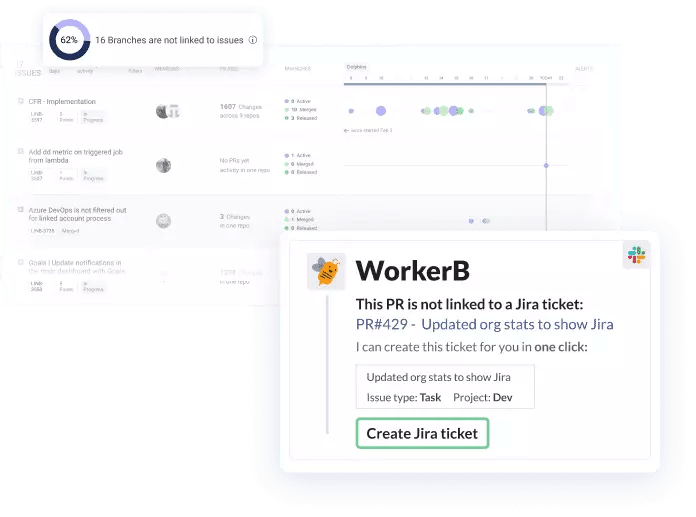
The biggest thing missing from a Cumulative Flow Diagram though is actual Git activity. Very rarely is planned work the only work done during a sprint. Unplanned work, such as technical debt or scope creep, is often encountered in the midst of working on a planned issue and must be addressed immediately to complete the task at hand.
In a recent study, we discovered that it’s quite common for developers to start working on these branches without creating or updating corresponding tickets. But our Pulse dashboard correlates data from your issue tracker and Git provider to show you what’s done, WIP, to do, and even unlinked branches (i.e. shadow work).
Improving Your Scrum Metrics
Scrum metrics play a critical role in ensuring the success of a sprint. Scrum teams need to review them often, ideally during each sprint retrospective, to understand what’s improving and what isn’t.
Ultimately metrics alone don’t improve dev teams. They give you direction on what needs to be improved, but then you have to set goals and implement best practices in order for your scrum metrics to start improving.
At LinearB, we provide all the metrics you need to measure predictability, efficiency, and scrum team health in one tool. But we also connect those metrics to industry benchmarks and customized Team Goals. Your custom Team Goals can then be connected to our developer bot, WorkerB, which provides real-time feedback to your devs in Slack or MS Teams to keep them aligned to the established best practices.
Improving scrum metrics at every level of your engineering organization starts with LinearB.


