

Typically scrum team performance is measured by calculating the deliverables and effectiveness of the scrum team. Common metrics include velocity and sprint burndown.
But these metrics are really just trying to demonstrate the team’s planning accuracy and whether or not they’ll deliver what they promised. Unfortunately, they’re rarely accurate because they’re based on estimated story points.
In fact, our research shows the industry average for planning accuracy is below 50%. That means that you’re estimating your scrum team’s performance capabilities, but you’re wrong more than you’re right. How embarrassing!
Let’s dive into why you should measure planning accuracy with LinearB and also the leading indicators of planning accuracy to investigate what’s driving it down.
Table of Contents
- Why Planning Accuracy Matters
- 4 Metrics to Benchmark Scrum Performance
- Set Scrum Team Performance Goals
- Optimize Scrum Team Workflow
- Improve Scrum Performance
Why Planning Accuracy Matters
Planning accuracy is the best metric to consider when measuring team performance in scrum because it allows team members to see if they have delivered on their promises or not. Having better planning accuracy leads to improved delivery and more value for the business.
The problem here is that a lot of companies aren’t reaching a sufficient level of it to be effective in achieving their sprint goal.
In fact, many development teams are failing more often than not because of low planning accuracy. The main culprit? Traditional tools for Git and issue tracking aren’t good enough.
Most of these systems fail to provide valuable insight into scrum projects, they don’t have automation capabilities, and they display issues in an unorganized manner. This is where LinearB comes in.
With LinearB, your can correlate data from project management and Git to supply information crucial to understanding what affects if they can deliver on their promises.
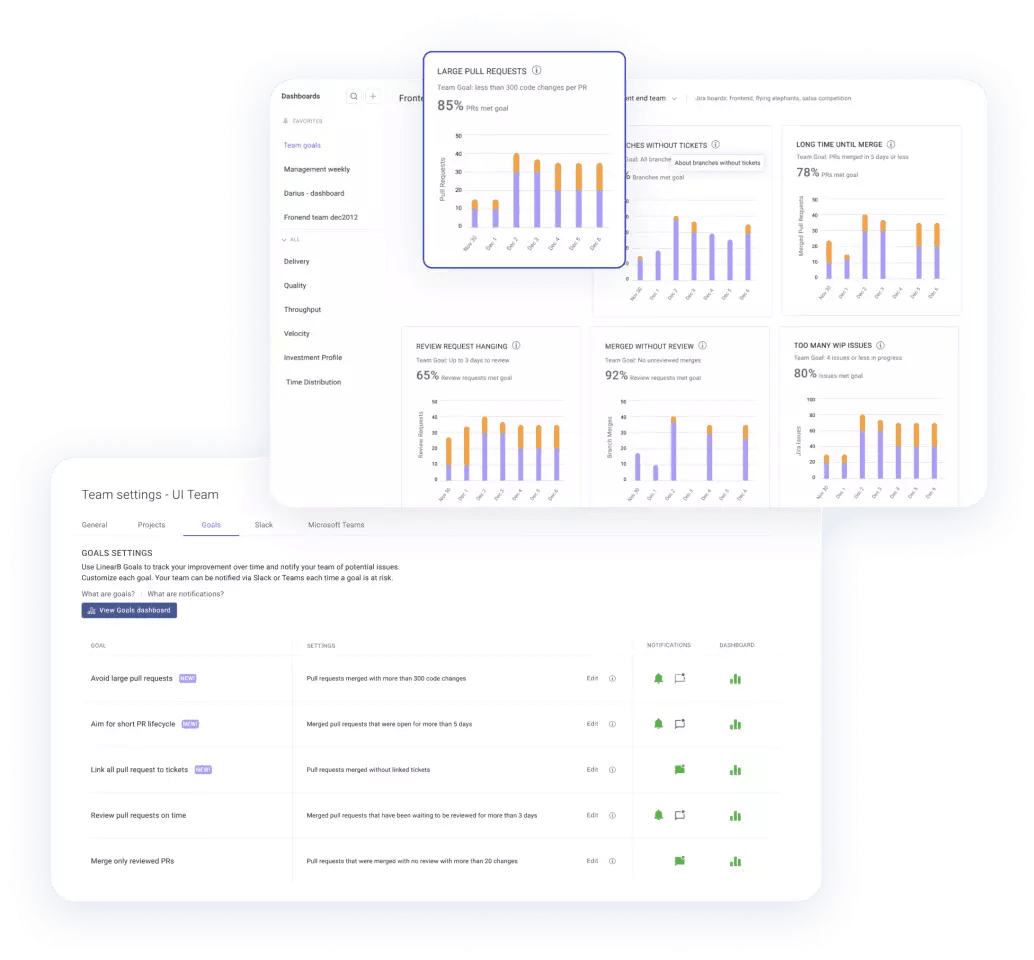
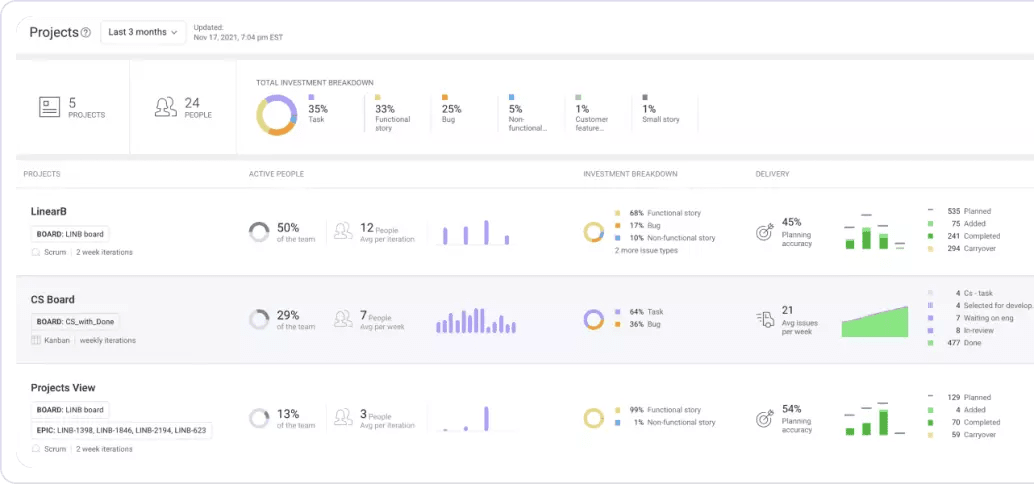 Your CEO will love this! You can see your team’s investment profile, project allocation, and planning accuracy by boards, epics, labels or custom fields. Learn more about Project Delivery Tracker.
4 Metrics to Benchmark Scrum Performance
Before you can jump into improving scrum performance, you need to know where to start. You need to first benchmark your team against industry standards. We currently have nine benchmark metrics available from our study if you want to learn more.
But here are four metrics that are leading indicators to improve planning accuracy:
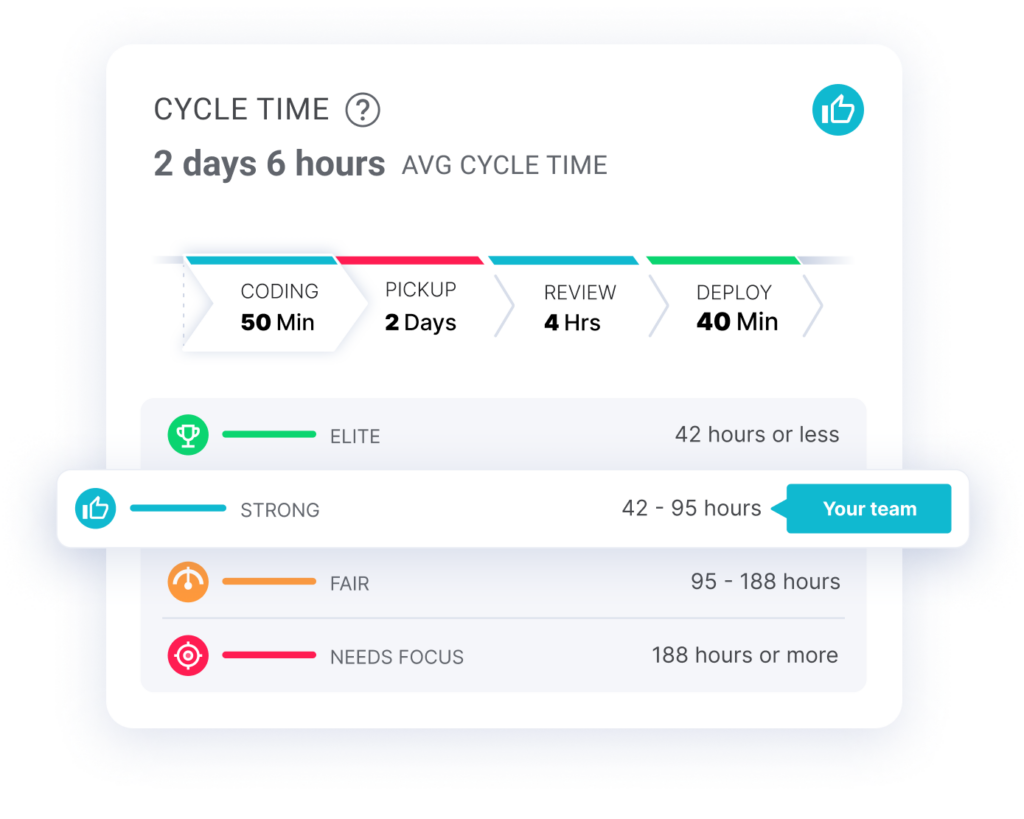
Cycle Time
Long cycle times reduce team efficiency and the ability to ship features predictably, so it’s one of the first metrics you should benchmark. Our research shows that the average cycle time for the dev teams studied was 6 days + 5 hours, but elite scrum teams have a cycle time of less than 48 hours.
Long cycle times reveal bottlenecks within your team’s PR review process. If you find that your cycle time is fair or needs focus, drill down into the four phases of cycle time to determine what needs the most attention.
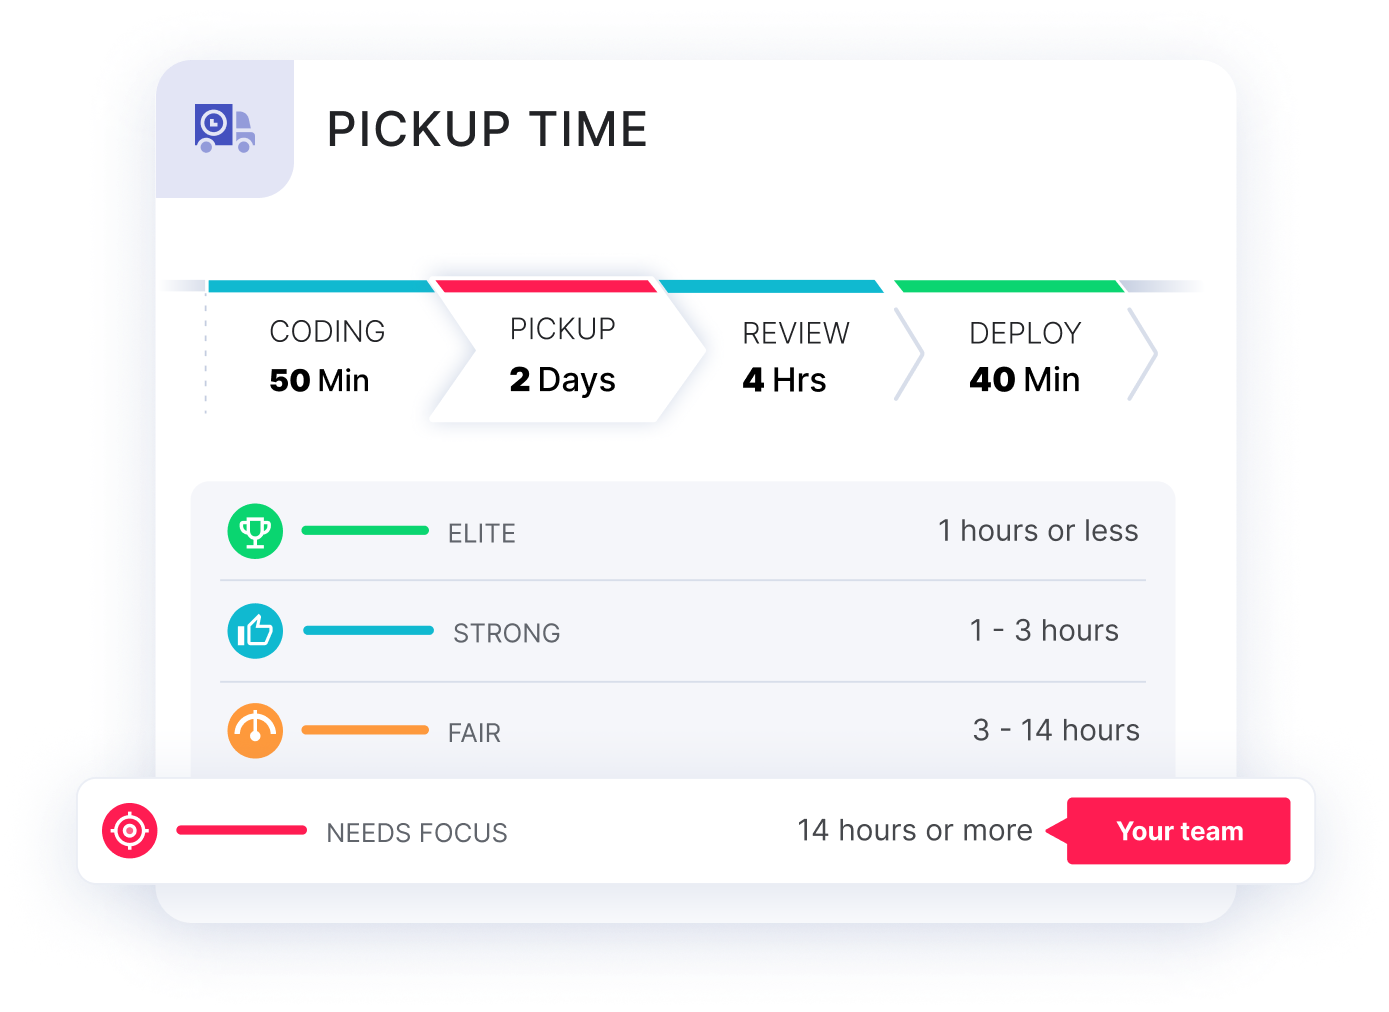
Pickup Time
Long pickup time is a common workflow bottleneck. It occurs for two reasons:
- The team isn’t aware a PR is ready for review
- There aren’t enough developers available to review
In both instances, a longer transition time from coder to reviewer results in higher cognitive load (re-focus time) and reduced efficiency.
Our research shows that 50% of pull requests are idle for 50.4% of their lifespan, meaning that the average PR sits idle for two days! However, elite teams average pickup times less than 7 hours.
PR Size
PR Size is so important to track and crucial improve your engineering efficiency, planning accuracy, delivery on your promises, and shipping features faster. All of which leads to higher customer satisfaction. It’s the magic bullet.
Large PR size means that your developer has lots of code changes to review. And it also usually signals that there will be several kinds of changes.
The code becomes hard to understand when the requirements aren’t broken down into digestible chunks. It also makes it more challenging to assess overall.
Our research discovered that PRs larger than 500 changes were less likely to be picked up for review but found clear evidence that, when we reduced PRs to less than 200 changes, these small PRs with lower estimated review time get picked up much faster.
Check out our presentation on how pull requests kill your productivity.
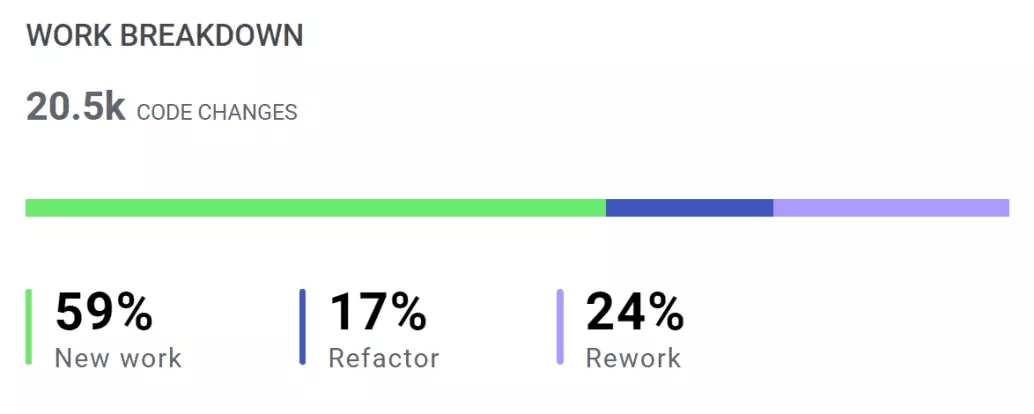
Rework Rate
Rework (also known as code churn) means your team is having to revisit and make changes to code that is less than 21 days old. Typically, rework occurs because the developer struggled to write the code or only got a superficial comment during the code review process.
Rework isn’t necessarily a problem. No matter how skilled your developers are, it’s impossible your team will have zero code rewrites, so a low rate of rework is healthy and expected.
Our research shows that elite teams keep their rework rate below 8%, but when rework surpasses 20%, that’s a sign you should worry about it.
Besides being an indicator of possible existing problems, a high rework rate can be a predictor of high-risk code. It’s more likely defects will be introduced into a piece of code if it gets edited a lot than one that nobody touches.
Set Scrum Team Performance Goals
Using the insights gained from benchmarking your team and investigating bottlenecks, you should have a good idea of where your performance issues stem from. Now your scrum team can set goals, such as keeping PR Size under a certain limit, as one example.
Having this discussion during a sprint retrospective meeting is a good place to start. A popular method to structure the discussion is Start, Stop, Continue. And once the scrum team has decided what they want to start/stop/continue doing, you can then set goals.
We recommend that teams remember a few best practices while setting goals:
- Only work on 1-2 scrum metrics at a time
- Aim for a single-tier improvement over a quarter
- Start with PR size, as it will have the most significant benefits
 Track progress by sprint, week or month so you can celebrate team improvement regularly. Let your team have cake! Book a demo of LinearB today.
Optimize Scrum Team Workflow
Unfortunately, metrics and goals alone won’t improve dev teams. To truly improve performance and planning accuracy, scrum teams have to change how they operate.
With our WorkerB bot, developers are notified in Slack or MS Teams when they’re off course from their team goals.
 Avoid superficial LGTM reviews. Use Team Goals + WorkerB to reinforce good habits around review depth. Get started today!
Improve Scrum Performance
How do you improve performance in scrum? The quick answer is LinearB.
The LinearB approach to improving scrum team performance starts with metrics, but you can’t stop at data-driven insights. You have to automate and optimize the developer workflow. For even more tips on raising your development team’s productivity using LinearB, check out this post.
LinearB can improve the way you measure scrum team performance and then guide you step-by-step into improving that performance and planning accuracy.
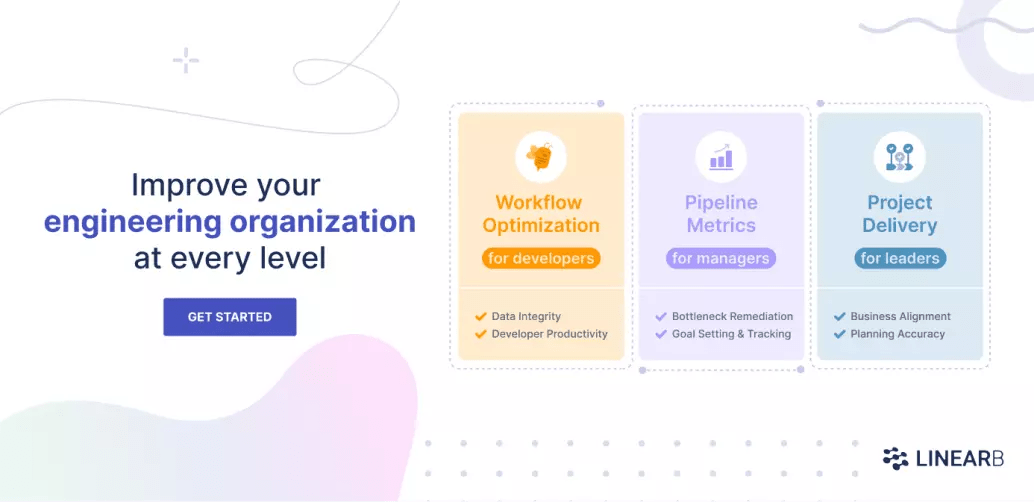 Want to improve your engineering processes at every level? Get started with a LinearB free-forever account today!


