

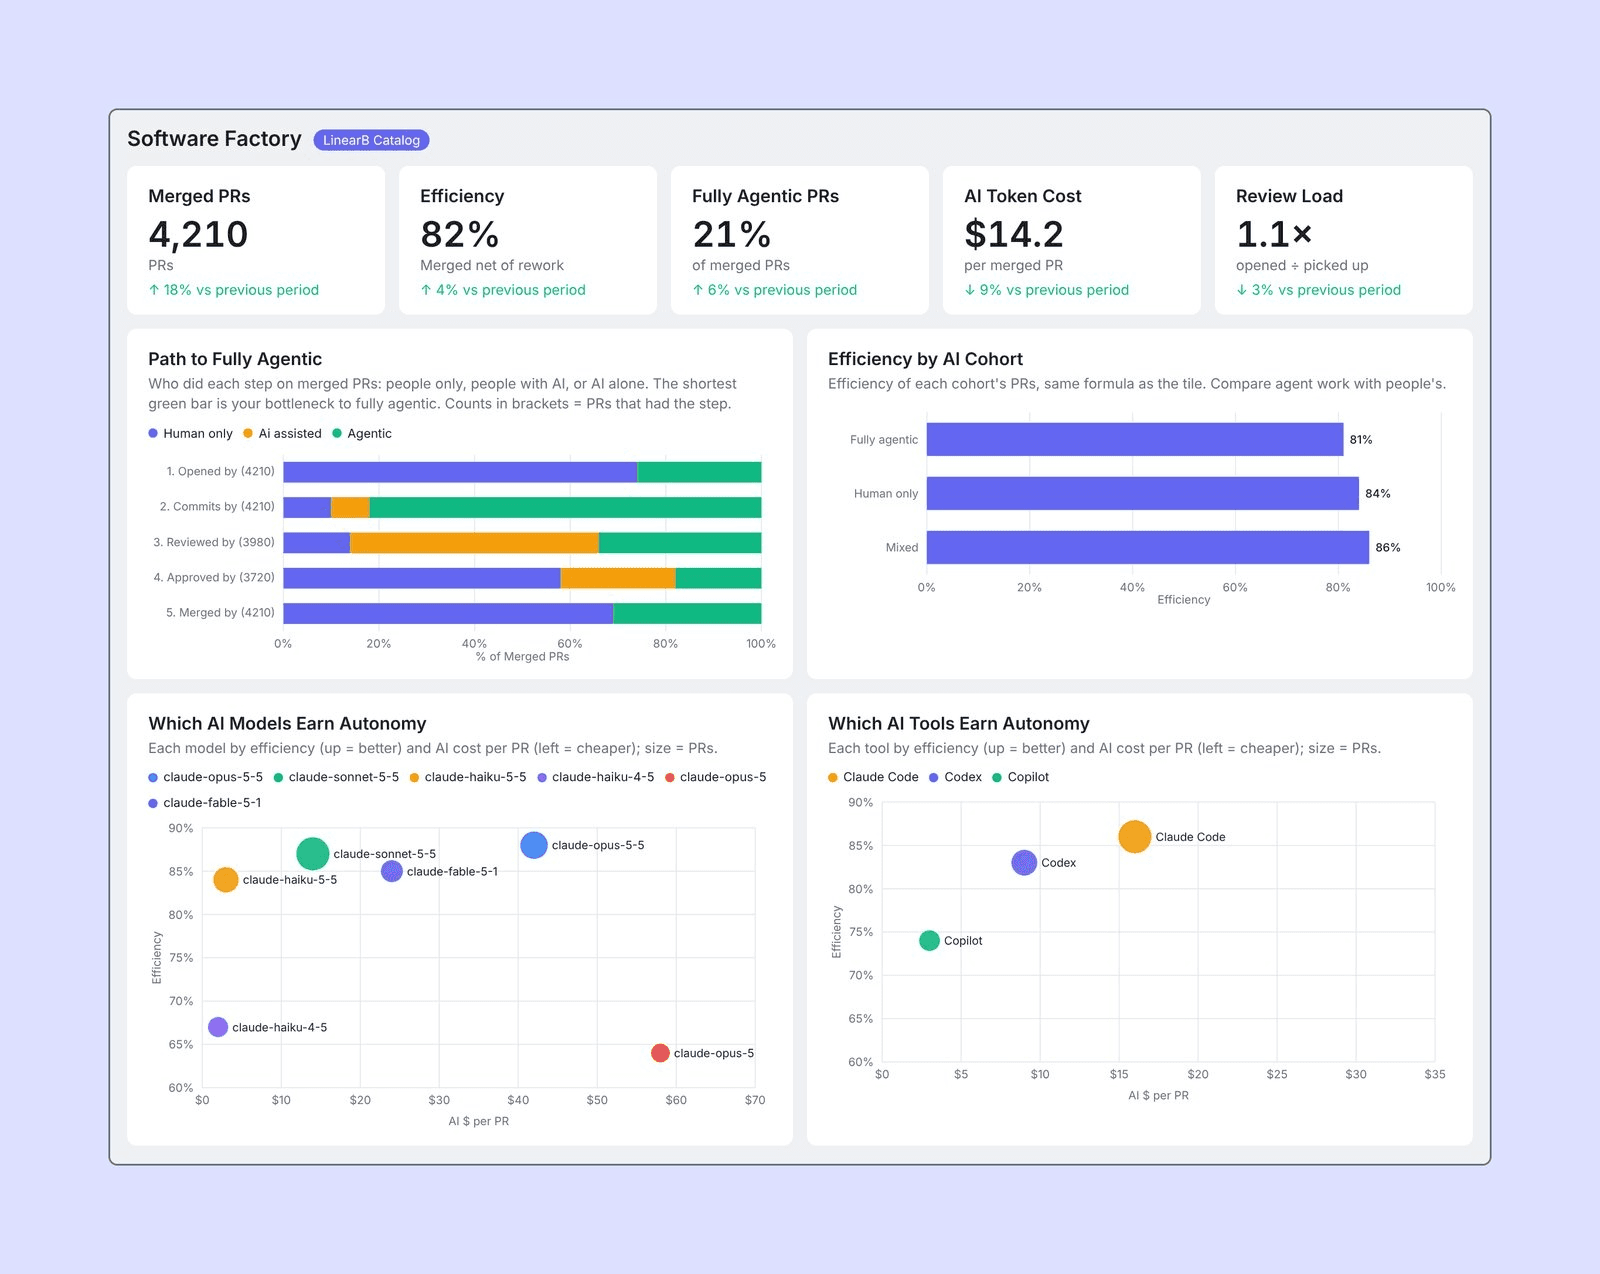
AI now opens PRs, writes most of the commits, and leaves the first review on a growing share of them. Look closely at any one PR, though, and there's usually still a person somewhere in the chain, and when there isn't, it's hard to tell whether the work is any good. Before you hand agents more of the pipeline, you need to know where your engineers' time still goes, whether agent work holds up, and which models deserve the extra scope. The software factory dashboard in LinearB was designed to answer each of those questions, found under the LinearB catalog in the new Agentic Studio.
Keep your engineers' time for the work that needs them
A single count of fully agentic PRs tells you how many PRs went end to end without a person, and leaves you guessing about the rest. Most teams hand work to agents one step at a time, often starting with AI review and later letting some PRs merge on AI review alone, so the overall count moves slowly even while individual steps change fast.
LinearB's path to fully agentic chart breaks every merged PR into the steps it passed through, from opened to merged, and shows who did each one: people only, people with AI, or AI alone. The shortest green bar marks the step with the most room to automate.
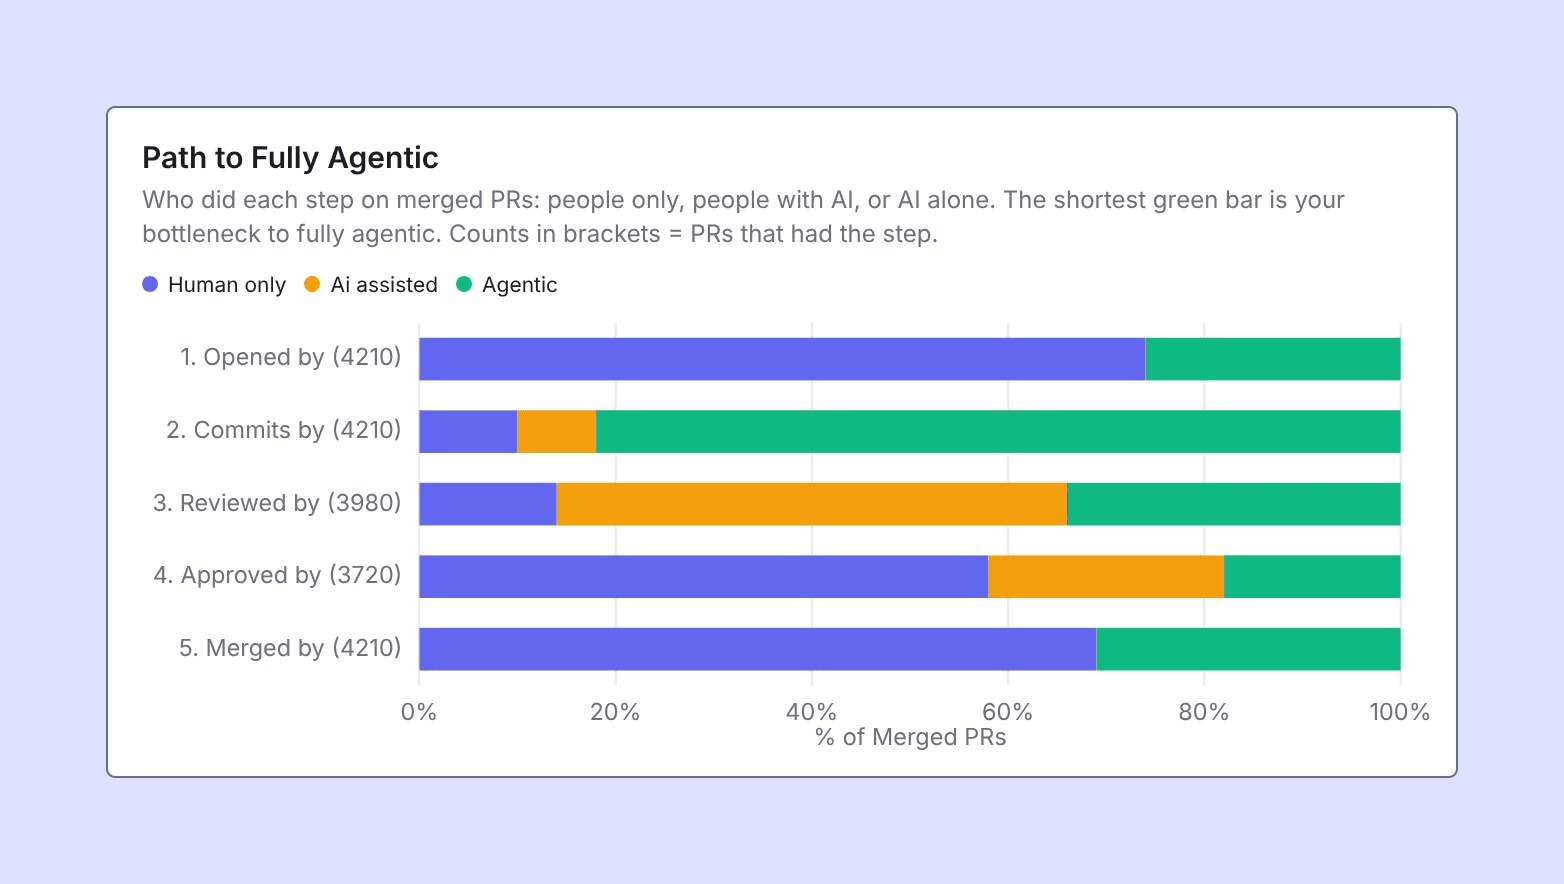
In this example, agents write most of the commits and AI handles a large share of reviews, but people still sign off on most approvals. That gives the team a specific next decision about which kinds of PR can merge on AI approval and which still need a person.
That chart weights every step the same, so LinearB pairs it with time in stage by cohort on the same dashboard, which shows how long PRs spend in each stage.
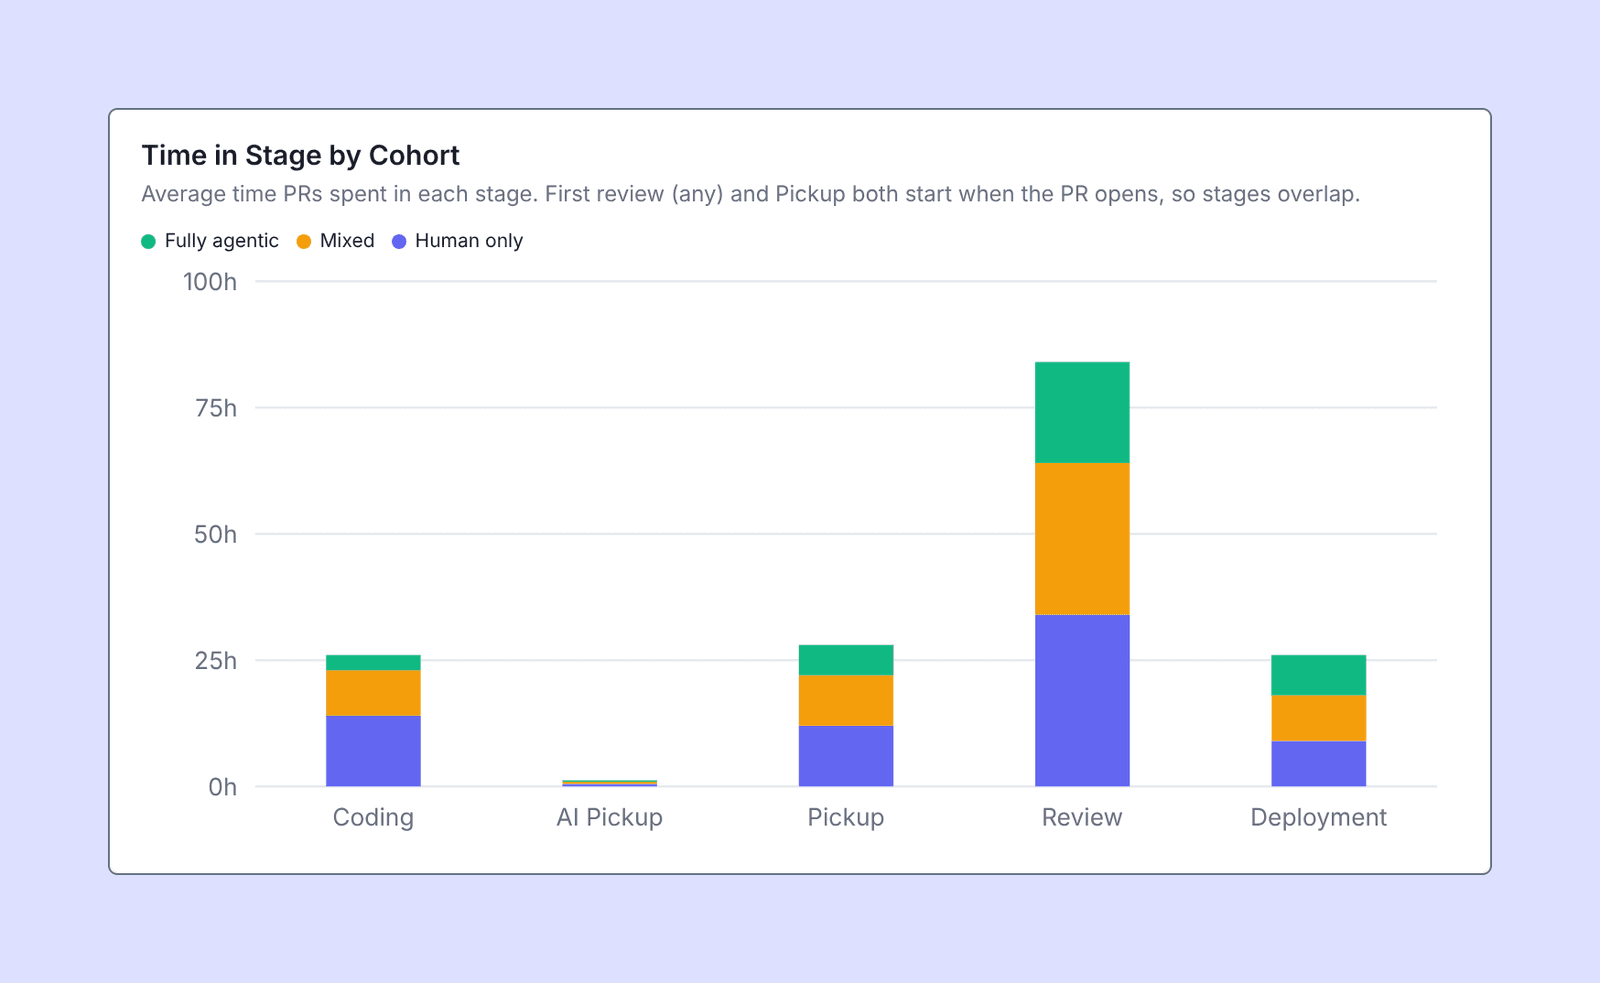
Here, PRs spend the most time in review, the stage from first review to merge where approval happens. That makes approvals the gap with the biggest payoff to close.
Agent work should hold up as well as your team's before it scales
More agentic PRs only help if the code they ship stays shipped. LinearB measures efficiency as the share of opened PRs that merge, discounted by code rewritten within 21 days, so a PR that merges and gets rewritten the following week counts for less than one that holds.
The efficiency by AI cohort chart in LinearB splits that score three ways: fully agentic PRs, mixed PRs that people and AI both worked on, and human-only PRs.
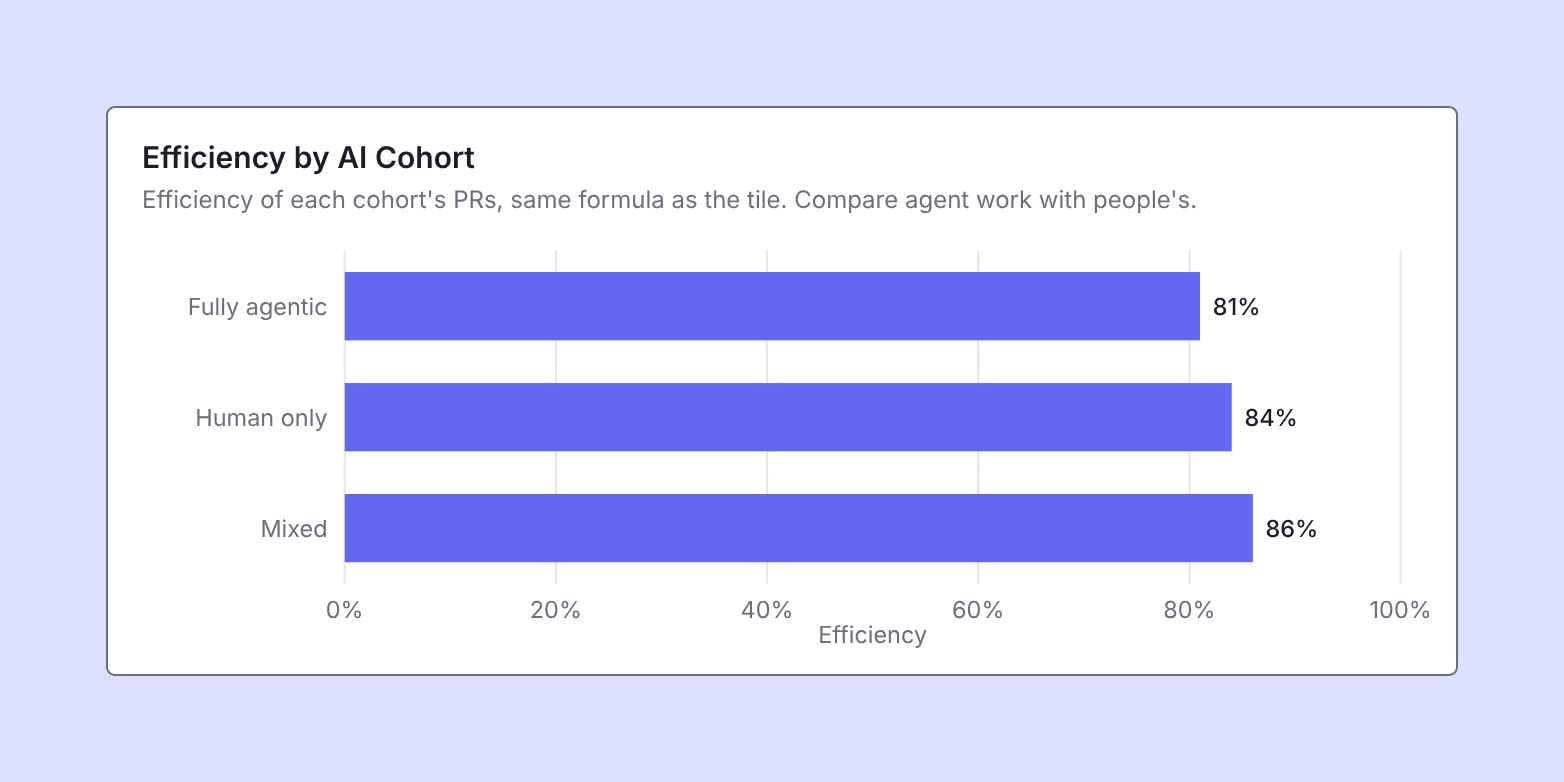
When fully agentic PRs land within a few points of human-only work, as they do in the first example, agents are producing code your team keeps, and you have a case for widening their scope.
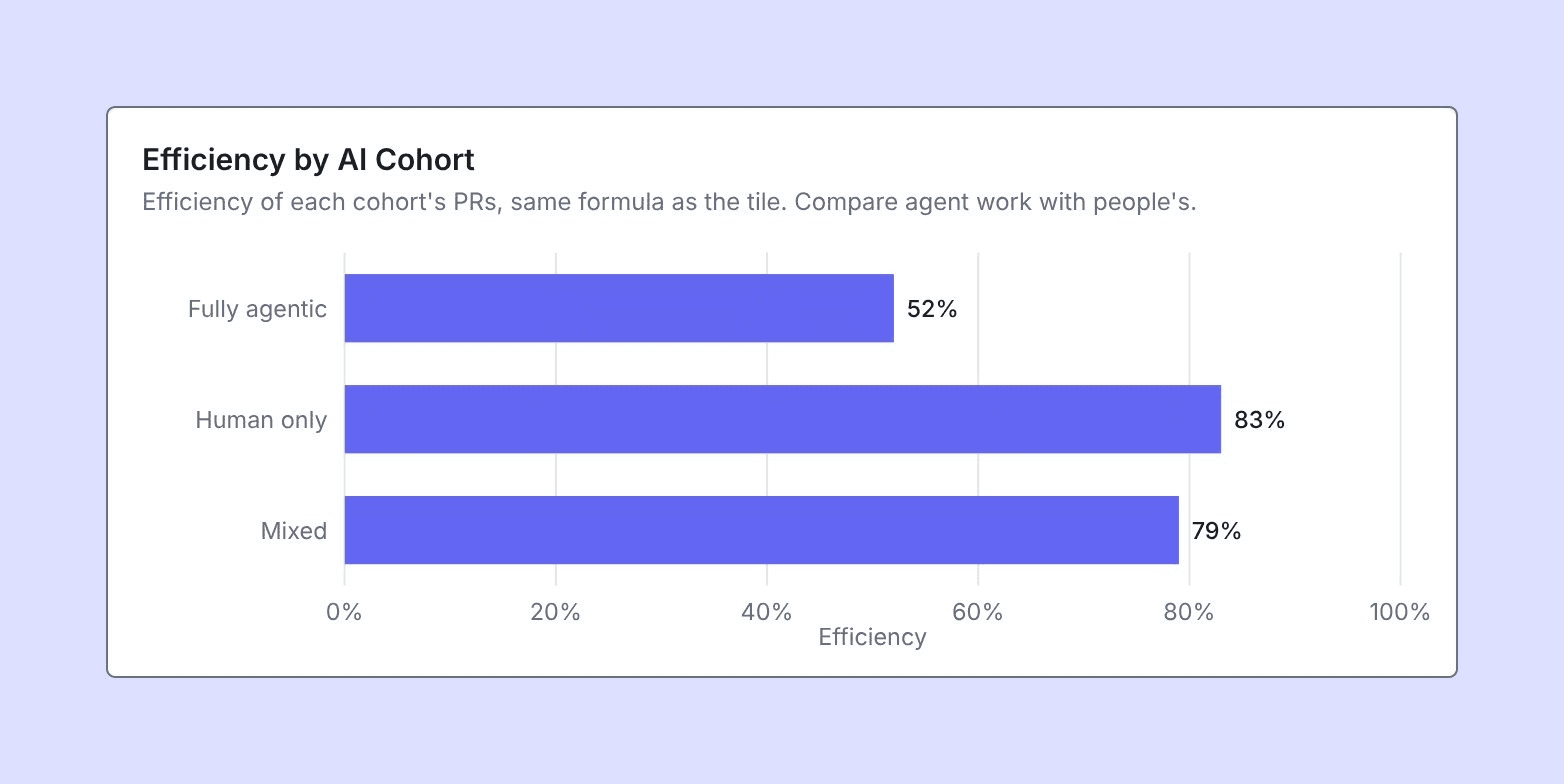
A wide gap, like the one in the second example, means more agent work would mostly add rework. LinearB's guidance in that case is to narrow the tasks agents take on, or improve the context they work with, before you expand.
Which AI models have earned more autonomy?
Public model comparisons usually plot price against synthetic benchmark scores, which say little about how a model performs on your own codebase. LinearB plots every model your teams use by the efficiency of the PRs it touched and its token cost per merged PR, with dot size showing how many PRs it worked on, so you can decide where your AI budget goes.
Where a model lands tells you what to do with it:
- Top-left, efficient and cheap: give it more scope.
- Top-right, efficient and expensive: try a cheaper model on the same work.
- Bottom-left, cheap and less efficient: improve the context it works with.
- Bottom-right, expensive and less efficient: restrict it.
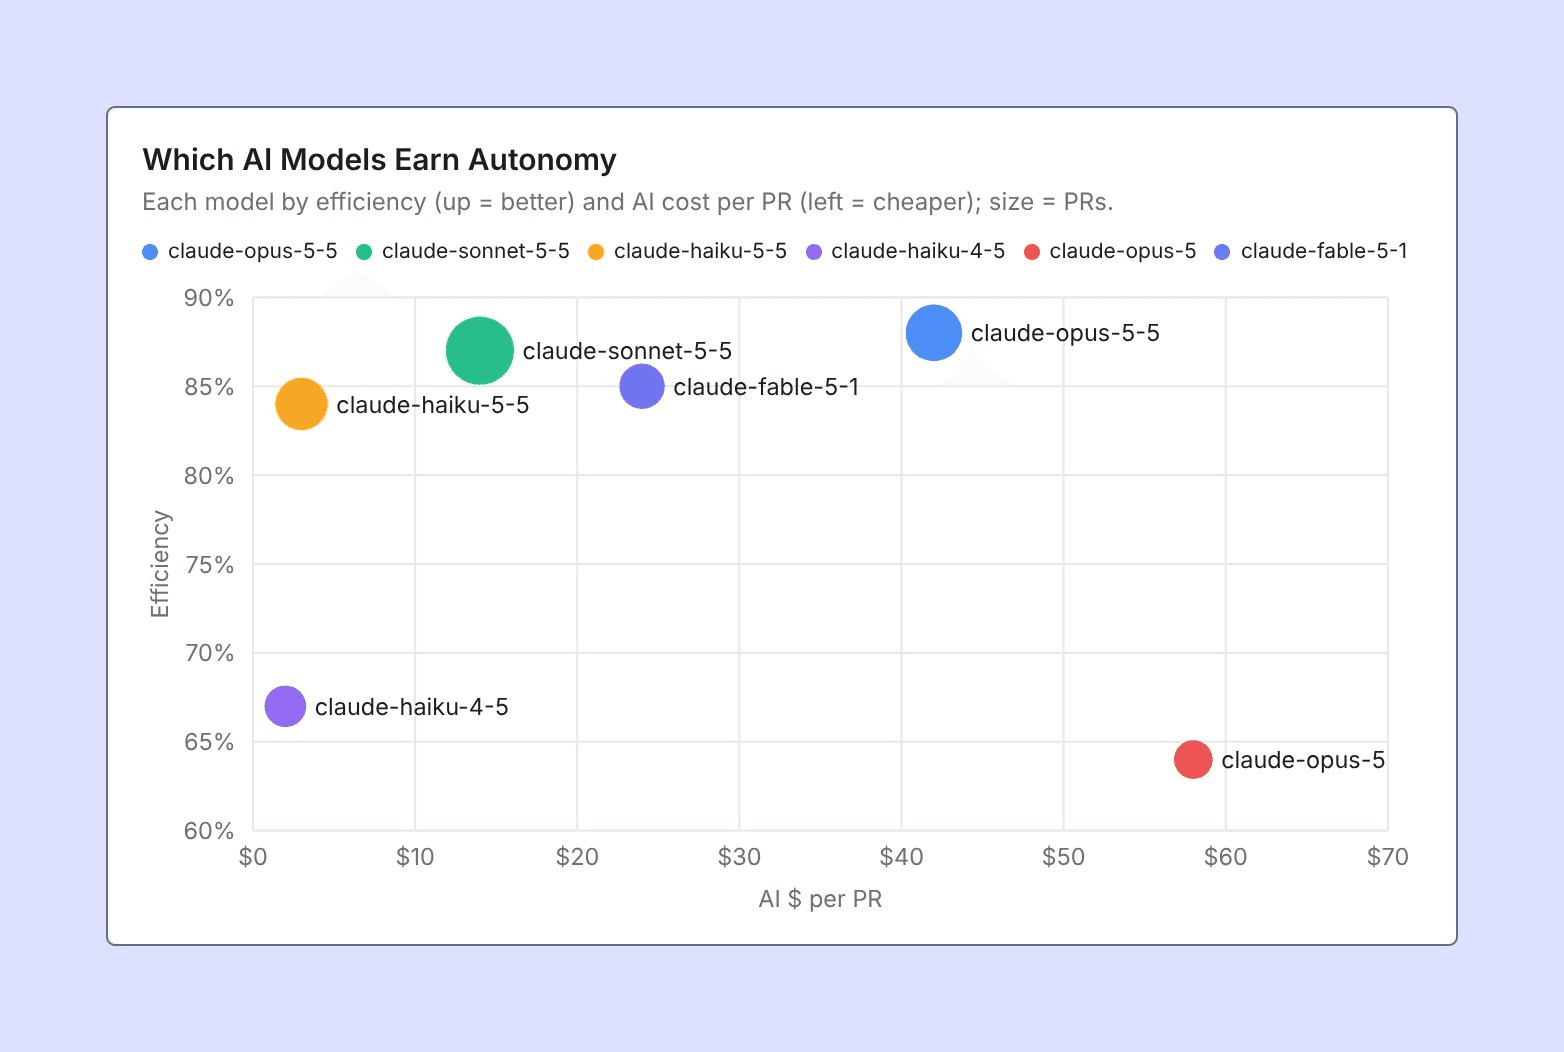
Here, claude-sonnet-5-5 delivers nearly the same efficiency as claude-opus-5-5 at a third of the cost per PR, which makes it the stronger candidate for more scope. The older claude-opus-5 sits bottom-right and is the first to restrict. LinearB hides models with fewer than 10 PRs, so a handful of one-off runs don't pull the chart out of shape, and the same view is available per tool.
LinearB prices tokens at each model's list rate, so the figure reflects consumption rather than your invoice. It's the same basis public model comparisons use, and it shows which models use the most of whatever budget or plan cap you work within.
Get complete visibility into your software factory
Together, these charts tell you whether your software factory is ready for more autonomy. The software factory dashboard in LinearB puts the answers side by side, alongside time in stage by cohort, review load, token cost by tool and by week, merged PRs against rework rate, and incidents per week, so you can confirm stability holds as delivery speeds up. The same widgets are also available to AI agents through the LinearB MCP server.
Get started
Agents earn autonomy one step at a time, and the software factory dashboard shows you which step is next. If you use LinearB, read the docs and open Software Factory from the LinearB Catalog in Studio. If you don't, book a demo to see your own software factory.


