

We get requests every day from engineering leaders who want a clear, updated view of the SPACE Metrics Framework—what it is, how it compares to DORA metrics, and why it matters more than ever in 2025.
With ongoing shifts in developer experience (DevEx), Gen AI adoption, and platform engineering, now’s the time to take a closer look.
What is the SPACE Framework for Measuring Productivity?
The SPACE Framework is a developer productivity measurement framework that captures five key dimensions of the software development lifecycle. SPACE is an acronym that stands for:
Satisfaction and well-being
Performance
Activity
Communication and collaboration
Efficiency and flow.
Unlike narrow performance metrics, SPACE gives engineering leaders a broader view of what’s happening inside their teams. It helps teams set better goals, uncover workflow blockers, and boost productivity, without losing sight of the human side of software development. As Gen AI tools and platform engineering reshape how developers work, SPACE gives teams a balanced, people-first way to measure both technical and cultural signals of productivity.
SPACE Metrics Framework vs. DORA Metrics Framework
While the SPACE Framework looks at the full developer experience, the DORA Metrics Framework zeroes in on DevOps performance. For many teams, DORA is the right place to start their metrics journey. SPACE comes in once you’ve built that foundation and are ready to mature your visibility practices.
Start with the four core DORA metrics—Lead Time to Change, Deployment Frequency, Mean Time to Restore, and Change Failure Rate—to track software delivery speed and stability. Once you’ve got that baseline, SPACE helps you expand your lens and understand the broader dynamics shaping team effectiveness and productivity.
SPACE vs. DORA: A Side-by-Side Comparison
Dimension | SPACE | DORA |
| Focus | Team productivity & well-being | DevOps performance |
| Coverage | Holistic: people, process, tools | Delivery pipeline only |
| Examples | eNPS, Cycle Time, Feedback loops | Lead Time, MTTR, CFR |
| Best For | Team effectiveness | Pipeline optimization |
20 SPACE Metrics Defined
The SPACE Metrics Framework consists of these twenty individual metrics:
- Developer Satisfaction Surveys: Surveys that gauge how developers feel about their:
-Work environment
-Tools
-Team dynamics
-Job satisfaction.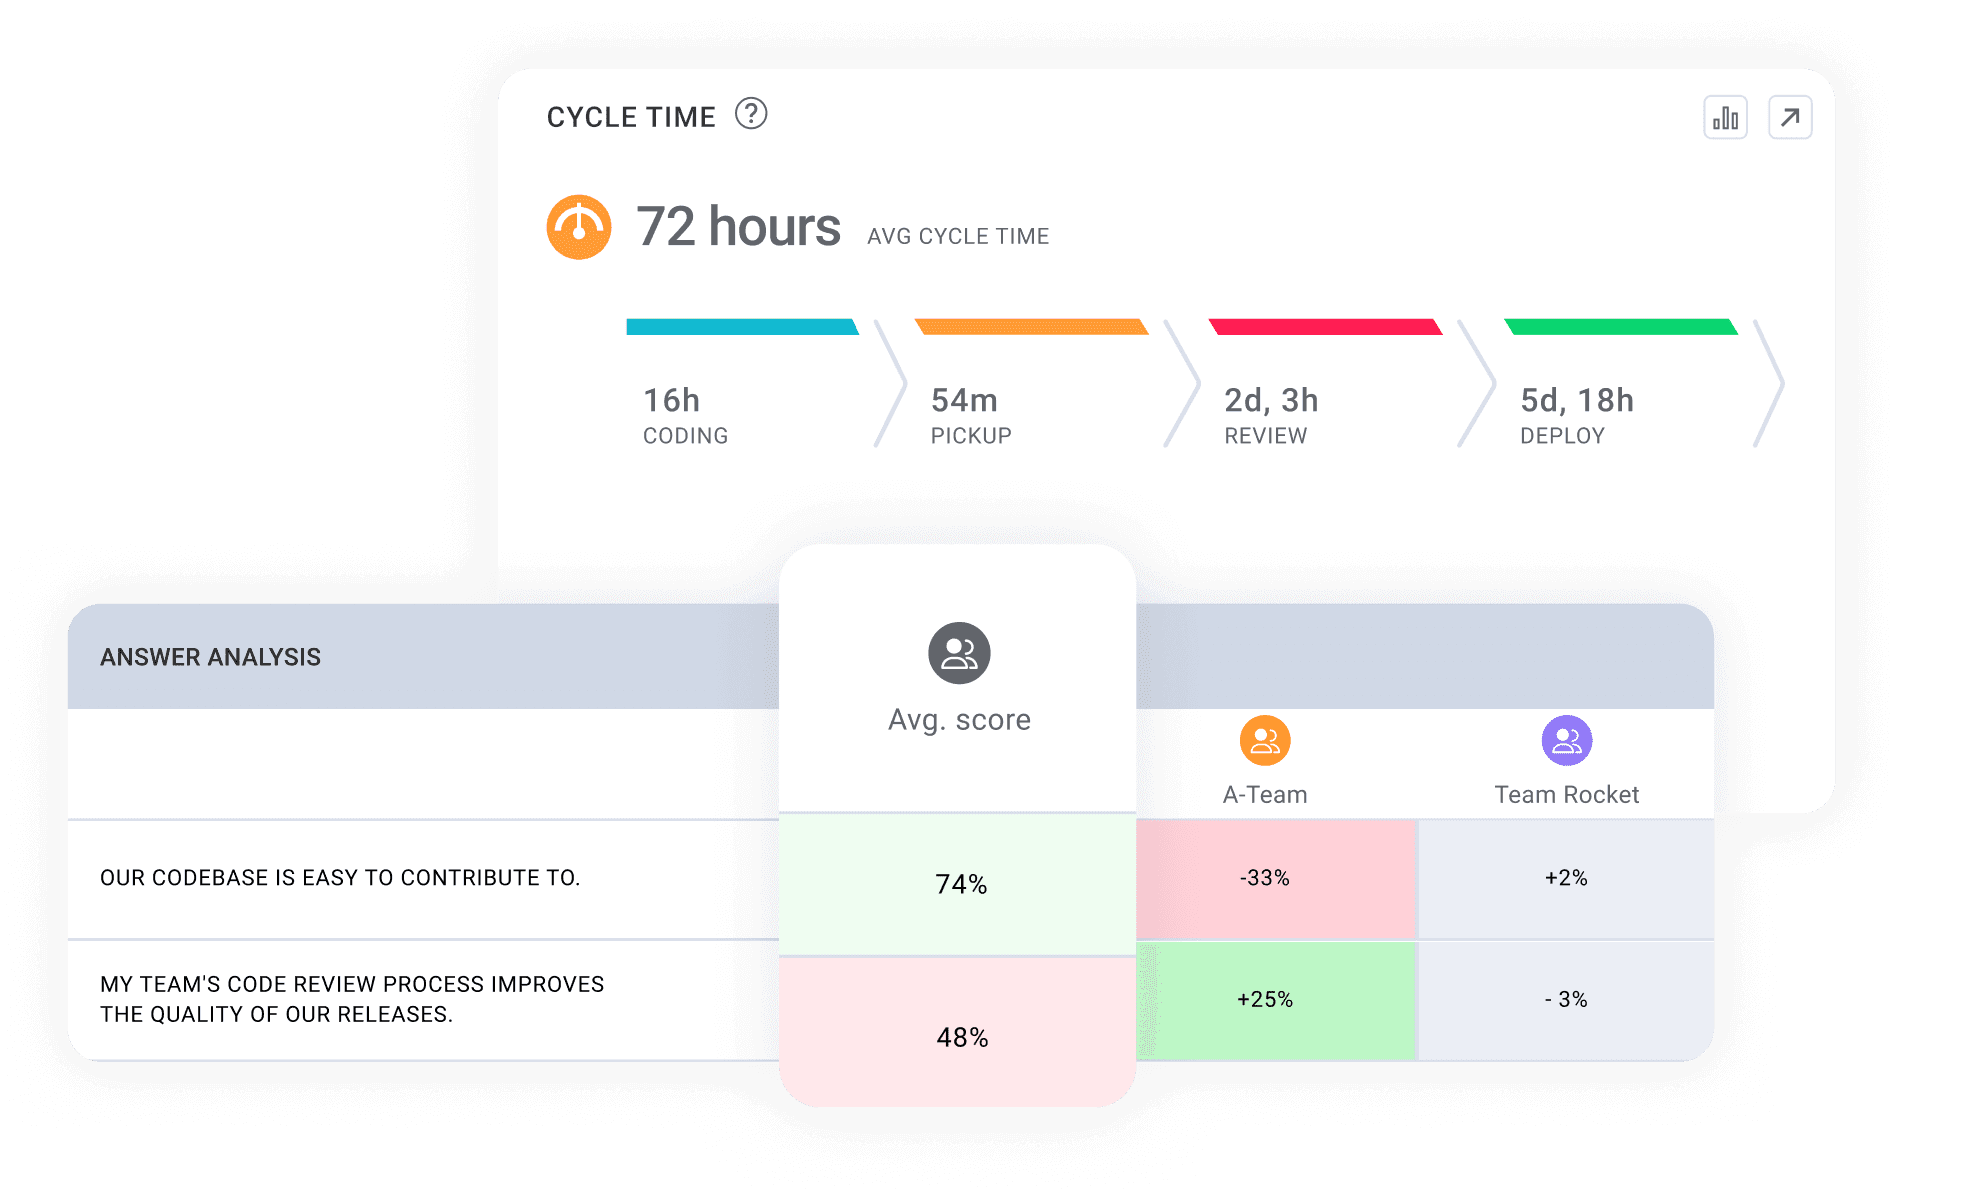
- Employee Net Promoter Score (eNPS): How likely are employees to recommend their workplace to others.
- Work-Life Balance Indicators: How well employees manage their professional and personal lives, including stress levels and time off.
- Career Growth Opportunities: How well an organization supports career advancement (eg. training, mentoring, and promotion opportunities).
- Code Quality Metrics: Includes various indicators such as the number of bugs found in production, complexity of code, and adherence to coding standards. These are often assessed through code reviews and static analysis tools.
- Feature Delivery Rate: The speed features are completed and delivered to production, usually tracked in terms of the number of features delivered within a specific time frame (e.g., per sprint).
- Velocity: The amount of work completed in a sprint (story points or tasks completed).
- Defect Density: The number of defects identified in a given amount of code, typically measured as defects per thousand lines of code (KLOC).
- Commit Frequency: How often developers commit code changes. Frequent commits indicate continuous progress on a project, while infrequent commits may suggest blockers, complexity, or a lack of clear requirements.
- Pull Request Activity: Tracking pull request creation, review, and merging activities provides insight into collaboration and review efficiency. Metrics such as review time, approval rates, and time to merge can pinpoint process bottlenecks or indicate healthy collaboration.
- Time Spent in Development vs. Other Activities: This breakdown shows how developers allocate their time between coding and other responsibilities such as meetings, documentation, debugging, or learning. Higher proportions of coding time typically correlate with productivity, though context is important (e.g., strategic meetings may also drive success).
- Pair Programming or Mob Programming Sessions: This metric measures how frequently collaborative coding sessions are used. Pair or mob programming can boost team knowledge sharing, reduce code errors, and improve team alignment. Regular usage often signals a culture of knowledge sharing.
- Cross-Team Collaboration Frequency: How often teams collaborate on projects or share information.
- Communication Tool Usage Metrics: How often communication tools are used for messaging, meetings, and other interactions. High usage of async communication channels with effective outcomes indicates strong engagement, but excessive synchronous meetings may highlight inefficiency.
- Feedback Loops: The speed and quality of feedback provided during code reviews and throughout development processes are measured by how quickly responses are given and how meaningful they are. Fast feedback loops enhance learning and ensure issues are identified and resolved more quickly.
- Documentation Completeness and Update Frequency: How well documentation is maintained (how current it is and how often it gets updated).
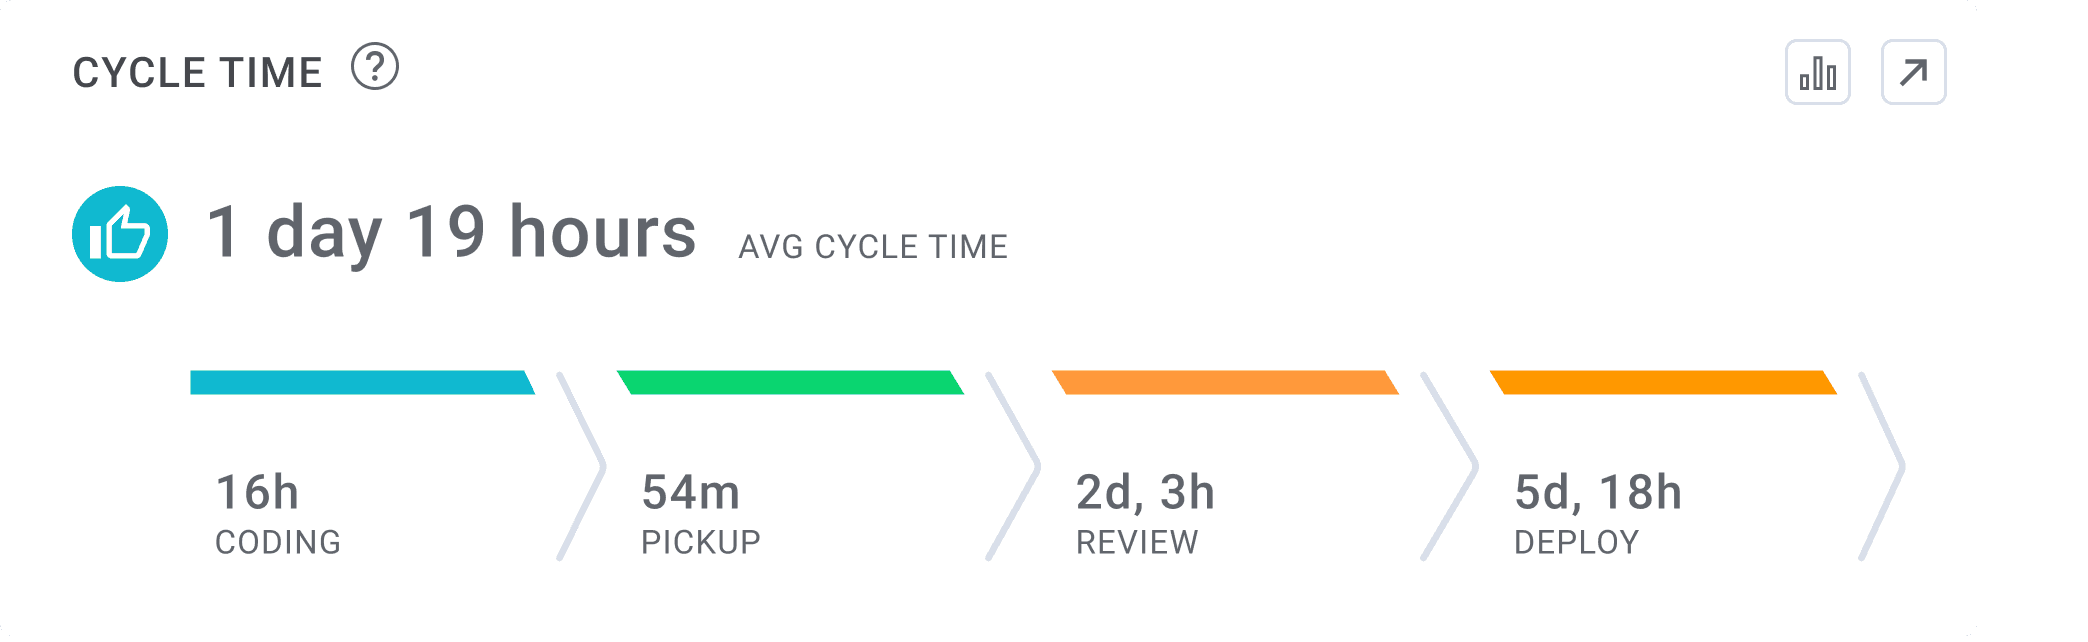
- Cycle Time: The total time taken from when work starts on a feature until it is deployed in production.
- Lead Time: The time elapsed from when a new feature is requested until it is delivered to production.
- Resource Utilization: How effectively team members' time is allocated to productive work versus non-productive tasks.
- Deployment Frequency: The frequency of deploying code changes to production.
Using SPACE Metrics to Measure Developer Productivity
The SPACE Metrics Framework for measuring developer productivity consists of these twenty individual metrics categorized into five key dimensions:
Satisfaction and Well-being
Metrics in this category reveal how developers feel about their work environment, team dynamics, and role. Higher satisfaction often leads to better retention, creativity, and morale. Look at developer satisfaction surveys, eNPS, burnout signals, and PTO usage. Don’t overlook 1:1s and retrospectives—they offer qualitative context that surveys can’t always capture.
What to Measure:
- Developer satisfaction with tools, workflows, and team dynamics
- Employee Net Promoter Score (eNPS)
- Burnout signals and stress levels
- PTO utilization and work-life balance indicators
- Career growth opportunities and professional development
How to Measure:
- Quarterly anonymous developer satisfaction surveys
- Regular 1:1 meetings with structured well-being check-ins
- Sprint retrospectives with dedicated well-being discussion points
- PTO tracking systems to identify unhealthy patterns
- Annual career development planning sessions
Performance
This is all about output quality. Metrics like code quality, delivery rate, and defect density help strike the right balance between speed and reliability. Tools like code review platforms and bug trackers provide strong signals of how well your team is delivering value.
What to Measure:
- Code quality metrics (complexity, test coverage, static analysis results)
- Feature delivery rate
- Velocity trends over time
- Defect density
- Customer/stakeholder satisfaction with deliverables
How to Measure:
- Automated code analysis tools integrated into CI/CD pipelines
- Bug tracking systems connected to code repositories
- Feature tracking in project management tools
- Customer feedback mechanisms and stakeholder surveys
- Code review platforms with quality measurement capabilities
Activity
Activity metrics track what developers are doing day to day—commits, PRs, and sprint velocity. These aren’t just about volume; they help flag blockers, disengagement, or context-switching. Combine these with time-allocation data to get a fuller picture
What to Measure:
- Commit frequency patterns
- Pull request volume and size
- Time allocation across development vs. other activities
- Sprint participation and story point completion
- Code review participation
How to Measure:
- Version control system analytics (Git metrics)
- CI/CD pipeline data
- Project management tool reports and burndown charts
- Time tracking tools with categorization capabilities
- Calendar analysis for meeting load and context-switching
Communication and Collaboration
Fast, effective communication keeps projects moving. Track how quickly pull requests are reviewed, how frequently teams collaborate, and what your communication patterns look like across tools. Don’t forget to evaluate internal docs and feedback culture too.
What to Measure:
- Pull request review time and quality
- Cross-team collaboration frequency
- Communication tool usage patterns
- Documentation completeness and update frequency
- Feedback loop effectiveness and response time
How to Measure:
- Pull request analytics from code hosting platforms
- Communication tool analytics (Slack/Teams/email usage patterns)
- Documentation platform metrics (creation, updates, usage)
- Cross-functional meeting participation tracking
- Peer feedback systems and review quality assessments
Efficiency and Flow
This category reflects how smoothly work moves from idea to production. Metrics like Cycle Time, lead time, and deployment frequency highlight delivery bottlenecks. When paired with qualitative insights, they paint a full picture of engineering effectiveness.
What to Measure:
- Cycle time from code start to production
- Lead time from idea to implementation
- Resource utilization and allocation efficiency
- Deployment frequency
- Flow efficiency (value-add time vs. wait time)
How to Measure:
- Development pipeline analytics from CI/CD systems
- Project management tool cycle time metrics
- Value stream mapping exercises and tools
- Deployment tracking integrated with version control
- Work item tracking systems with time-in-state analytics
How to Get Started with SPACE Metrics Framework
To begin your engineering metrics program with the SPACE Metrics Framework, we recommend that engineering leaders begin by benchmarking their team’s existing performance against their chosen SPACE metrics. The benchmarking process provides three key outcomes:
- Historical Context
Historical context helps you define your team’s past and current performance. This level of context setting provides a deeper understanding of the trends happening within your organization in order to ensure a full understanding behind each metric being measured.
- Industry Comparison
Once your internal SPACE metrics are benchmarked, you can next compare them to industry benchmarks using the Software Development Benchmarks Report. By using industry-wide data to compare against your own internal benchmarks, engineering leaders gain a deeper understanding of their performance in terms of efficiency and effectiveness.
- Effective Goal Setting
Once your SPACE metrics have been benchmarked at both the internal and external levels, you have the necessary foundation to begin your goal setting process. Using your benchmarks, engineering leaders can determine which metrics have the greatest opportunity for improvement.
![2025 Software Engineering Benchmarks [Dec Update]](https://assets.linearb.io/image/upload/v1733950346/2025_Software_Engineering_Benchmarks_Dec_Update_dbb686bd59.png)
Want to learn more about Software Engineering Metrics Benchmarks? Download the full report here and get started today.
Case Study: How Super Leveraged SPACE Metrics and LinearB
The engineering team at Super implemented a modified SPACE framework to improve their development practices and team culture. Using custom team scorecards that tracked key metrics like Planning Accuracy and Capacity Accuracy, they identified a common challenge: "tail loading" work at the end of sprints and quarters, which was reducing efficiency and impacting quality.
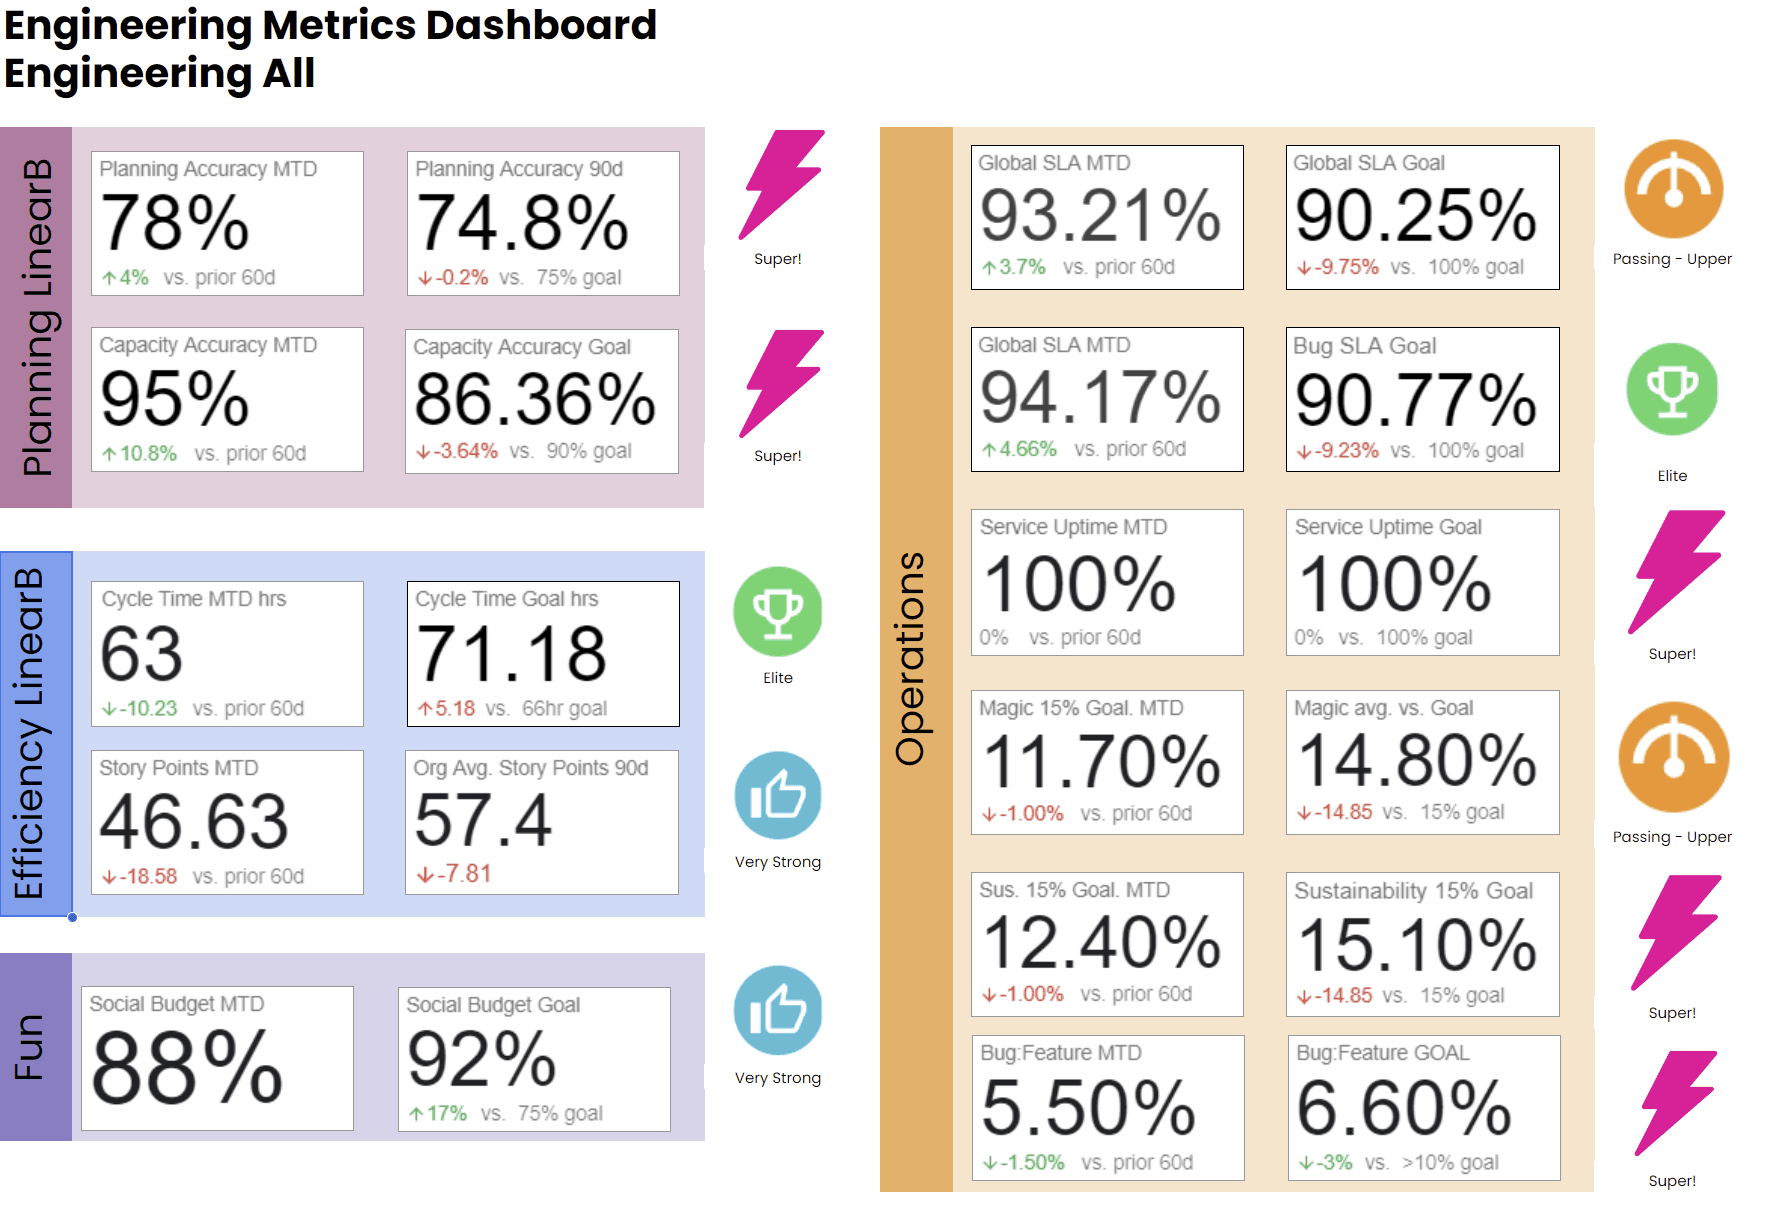
To address this, Super's Office of the Vice President of Engineering (OVPE) implemented data-driven coaching sessions focused on fostering organizational discipline and consistency. They created an organizational OKR dedicated to product quality and worked to build uniformity in the volume of work, characteristics of the work, and delivery timeframes. By analyzing patterns in their data, they could dive deeper into specific metrics like Cycle Time and PR size to identify and address workflow blockers.
The results were significant: Super achieved a 200% improvement in Cycle Time and Planning Accuracy. As teams approached their Planning and Capacity Accuracy goals (75-100%), they gained confidence in their ability to deliver on time, which improved team morale and reinforced their data-driven culture, all without increasing headcount. This case demonstrates how focusing on operational consistency and engineering excellence can enhance both technical performance and team health.
Read the full case study with Super here
When to Adopt the SPACE Framework
SPACE is a smart next step once you’ve implemented DORA and are looking for more insight into your team's culture and day-to-day experience.
It’s especially useful for platform engineering teams, organizations investing in internal developer platforms, or companies seeing warning signs like low morale, disengagement, or team silos. If your teams are moving fast but feeling burned out—or moving slow and feeling fine—SPACE helps reveal what to address.
Connecting DORA, SPACE, and Other Metrics for Full Visibility
DORA and SPACE work better together than they do apart.
DORA tells you how efficiently your team moves code from commit to deploy. SPACE shows you how sustainably and collaboratively that code gets written. Add in business metrics like roadmap confidence or investment ratios, and you get a complete picture of how people, process, and product intersect.
The Best Tools for the SPACE Metrics Framework
The most important consideration when evaluating tools for the SPACE Metrics Framework is whether you want a comprehensive engineering productivity platform or specialized point solutions for measuring metrics within each of the five key dimensions.
We recommend a comprehensive platform like LinearB. These platforms also often include features for delivery insights, team goal tracking, Gen AI enablement, and resource reporting.
The SPACE Framework helps engineering leaders measure more than just output, it captures the full developer experience. With its five dimensions and 20 metrics, SPACE offers a deeper way to assess performance, engagement, and process health.
When used alongside DORA metrics and business-aligned reporting, it becomes the foundation of a modern, people-first approach to engineering leadership.
FAQ: Common Questions About SPACE Metrics
What are SPACE metrics?
A comprehensive framework for measuring developer productivity across five dimensions: Satisfaction and well-being, Performance, Activity, Communication and collaboration, and Efficiency and flow. The framework was developed by researchers at Microsoft, GitHub, and the University of Victoria to provide a more holistic view of engineering effectiveness beyond simple output metrics.
Curious about the research behind SPACE? We recommend Microsoft’s whitepaper: “The SPACE of Developer Productivity: There’s More to It Than You Think.”
How do SPACE metrics compare to DORA?
SPACE takes a broader view of productivity that includes human factors and team dynamics, while DORA focuses specifically on DevOps delivery performance. DORA's four key metrics (Lead Time, Deployment Frequency, MTTR, and Change Failure Rate) primarily measure pipeline efficiency, while SPACE's 20 metrics span the entire developer experience, including well-being and collaboration. Organizations typically start with DORA to establish delivery pipeline metrics, then expand to SPACE for a more comprehensive view of engineering health. The frameworks are complementary rather than competitive.
What does SPACE stand for in agile?
In the context of agile development, SPACE stands for Satisfaction and well-being, Performance, Activity, Communication and collaboration, and Efficiency and flow. Each dimension contains multiple metrics that track different aspects of the software development lifecycle and team dynamics. Teams typically select 1-3 metrics from each dimension to create a balanced measurement system.
What are examples of SPACE activity metrics?
Activity metrics track developer actions and include commit frequency, PR volume, and story point completion. More sophisticated activity metrics examine time allocation patterns (development vs. meetings), code review participation rates, and context-switching frequency. These metrics should be normalized across teams of different sizes and analyzed in the context of work complexity. Activity metrics are most valuable when tracked alongside efficiency metrics to ensure teams aren't simply "busy" but are delivering value efficiently.
How do you measure developer well-being?
Developer well-being is measured through both quantitative and qualitative methods. Quantitative approaches include developer satisfaction surveys, employee Net Promoter Score (eNPS), PTO utilization patterns, and calendar analysis to identify meeting overload. Qualitative approaches include structured 1:1s with well-being check-ins, team retrospectives with dedicated well-being segments, and career growth discussions. Effective measurement combines regular pulse surveys (weekly or bi-weekly) with deeper quarterly assessments, balancing anonymized feedback with personalized check-ins to identify both individual and team-level patterns.
Is SPACE a replacement for DORA?
No, SPACE complements rather than replaces DORA metrics. DORA provides focused visibility into your delivery pipeline, while SPACE expands measurement across the entire development experience. Engineering organizations with mature metrics programs typically implement DORA first to establish baseline delivery metrics, then add SPACE dimensions to monitor team health, collaboration patterns, and developer experience. Used together, they provide a balanced scorecard that prevents optimization of delivery speed at the expense of team sustainability or code quality. Best practice is to integrate both frameworks into a unified engineering intelligence dashboard.


