A metric ton of metrics supposedly help you track everything your engineering org is doing—but not all are created equal. That’s what DevOps Research and Assessment (DORA) metrics are for. These metrics allow you to visualize how your engineering org is performing and give you the data you need to improve. While the exact metrics your company needs may vary, we’ve compiled a list of thirteen DORA metrics tools to help you choose the best solution for your engineering team. Let’s dive in!
What Are The 4 DORA Metrics?
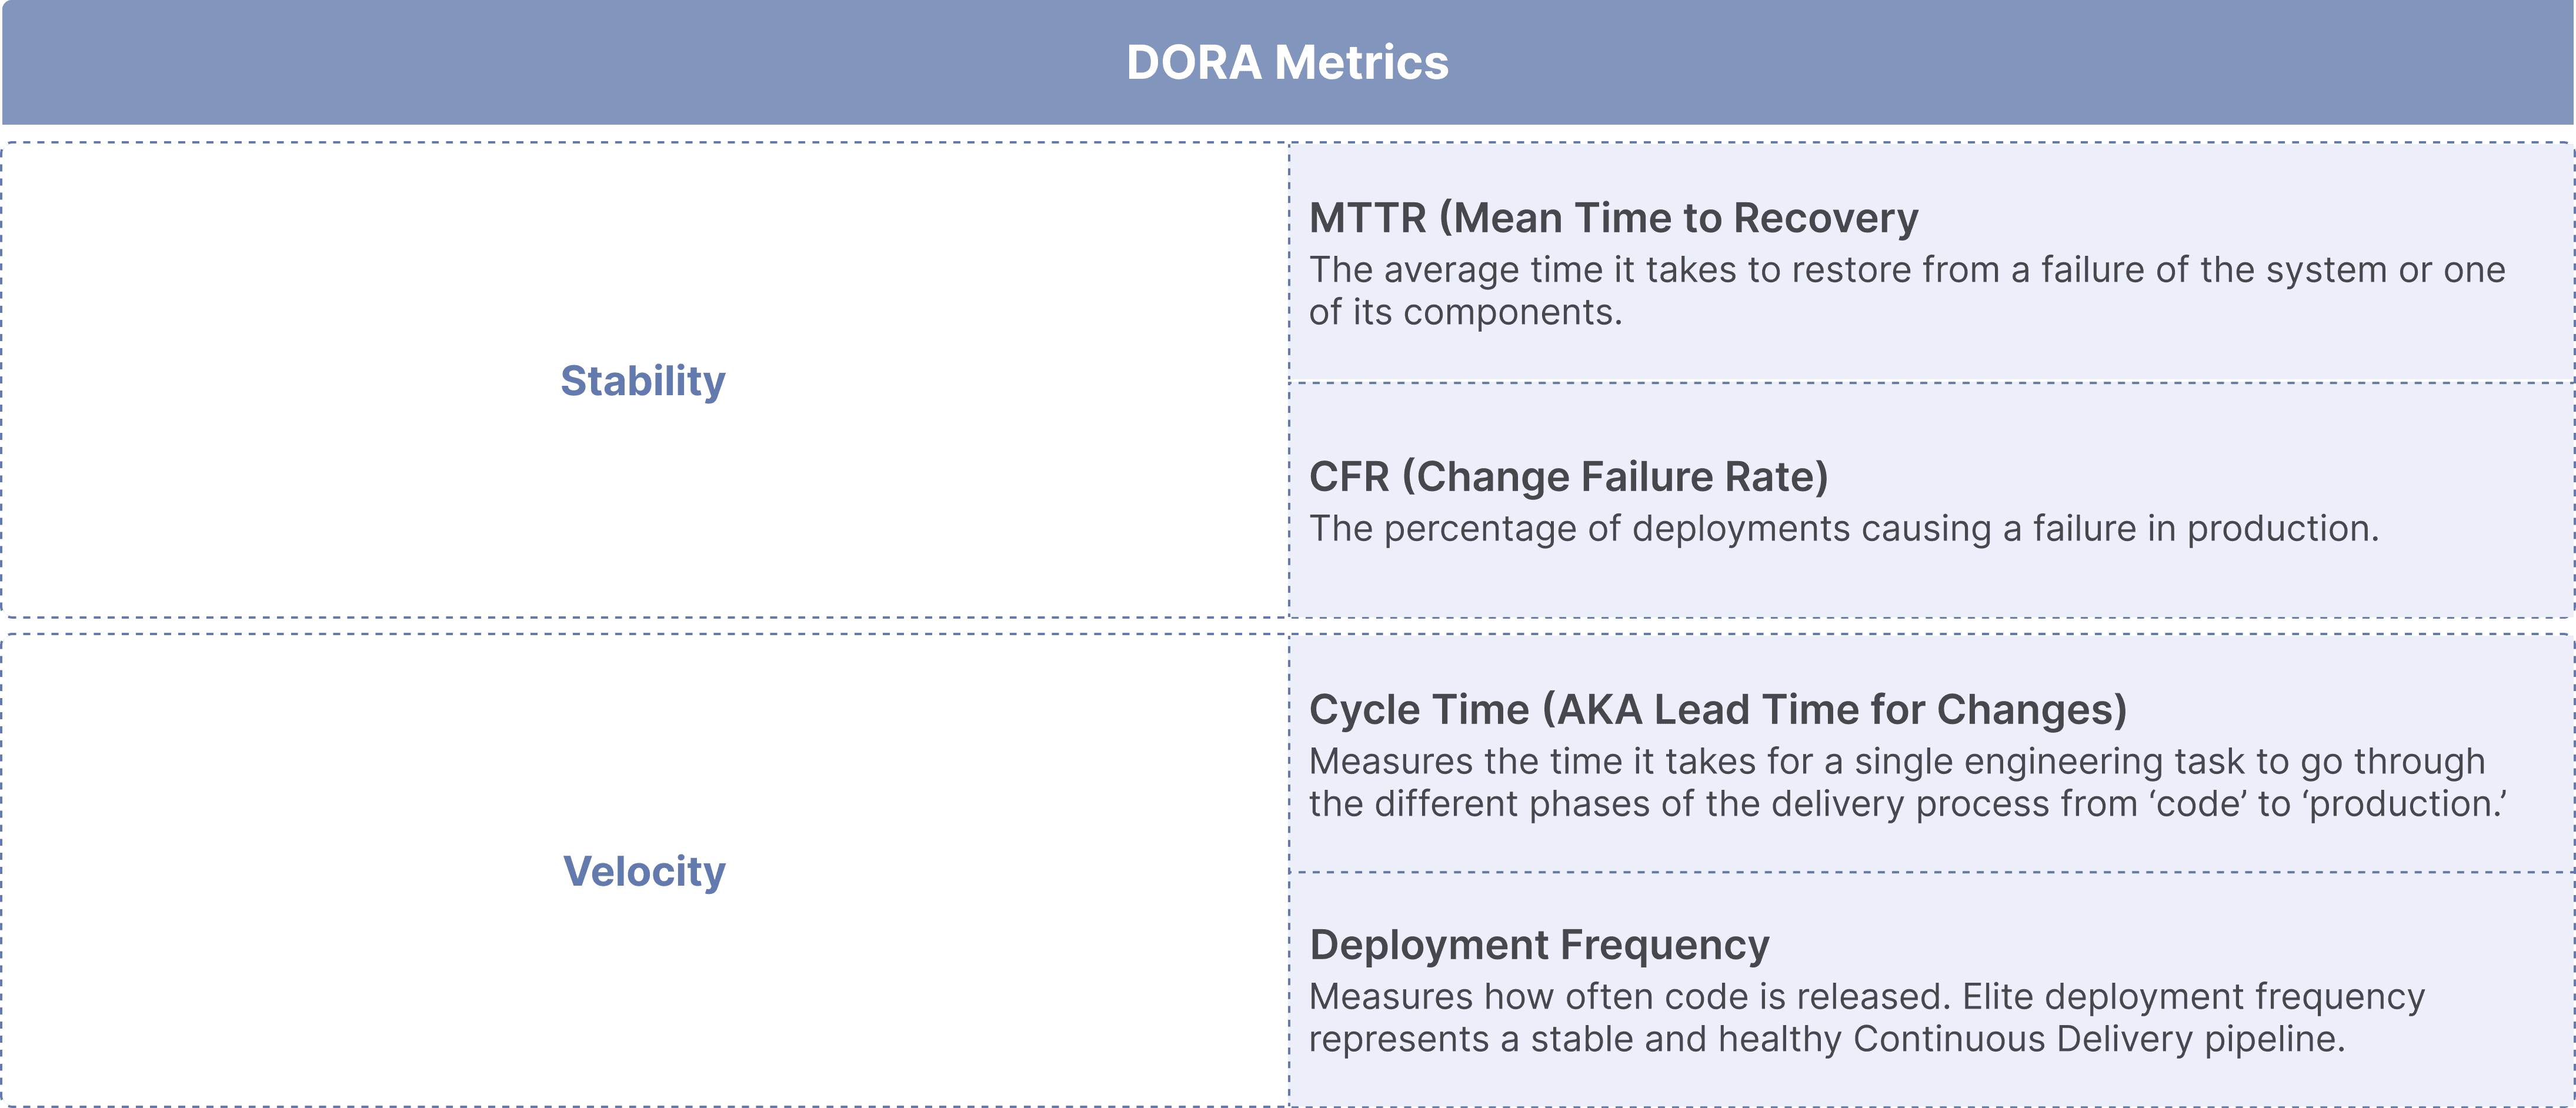
The DORA team spent over seven years studying engineering organizations to learn how to measure productivity in software development. Through their research, they identified four key metrics to indicate your development process’ performance:
- Deployment Frequency refers to how often an organization successfully releases code.
- Lead Time for Changes (aka Cycle Time) measures the time it takes for a single engineering task to go through the different phases of the delivery process from ‘code’ to ‘production.’
- Mean Time to Recovery (aka Mean Time to Restore) measures the time it takes to restore service after an interruption.
- Change Failure Rate represents the percentage of deployments that result in production failures.
Using DORA metrics, you can better understand how to reliably and efficiently deliver features and value to your clients.
Want to see DORA metrics in action? Check out how Github, Honeycomb, and Netflix used DORA to improve their engineering org on our podcast Dev Interrupted.
Challenges in Tracking DORA Metrics
DORA metrics are a great way to quantify your engineering org’s performance, but they aren’t perfect. If used incorrectly, you’ll struggle to see bottlenecks and miss the mark when trying to improve developer productivity.
Four Common Challenges with DORA Metrics:
- Scattered Systems and Data: You have access to the data you need, but it comes from all sorts of different reporting tools.
- Inefficient Data Gathering: You have the data you need, but it’s not in an easy-to-read format.
- Manual Data Processing: You’ll need to analyze and process your data, which takes time. But you also have to factor in your Git and Jira data, which can be a hassle to do manually.
- Lack of Context for Single Metrics: You have the metrics you wanted, but following just one metric doesn’t tell you the full story. A high change failure rate may suggest insufficient quality control, but it doesn’t reveal the integrity of the product overall.
To get the most out of DORA metrics, they shouldn’t be used merely for passively tracking issues. Instead, they should inspire your engineering leaders to actively optimize their workflows—and one way to do that is with DORA metrics software.
Top 13 DORA Metrics Tools
If you’re looking to truly benefit from DORA metrics, you’ll need to use the right tools. Ideally, they should give you the metrics you need while also helping you overcome the challenges above. Without further ado, here are eleven picks for DORA metrics tools:
1. LinearB
LinearB works with your Git, project management, incident, and release management tools to generate a DORA metrics dashboard quickly and easily for teams and the entire organization. Beyond DORA metrics, LinearB can monitor additional KPIs that contribute to your company’s success. But we don’t just stop there. Here’s what our platform allows you to do:
- Keep tabs on crucial leading indicators like pull request (PR) size, PR review depth, PR review time, and the amount of time from deployment to production.
- Improve key metrics and positively influence deployment frequency and lead time for changes.
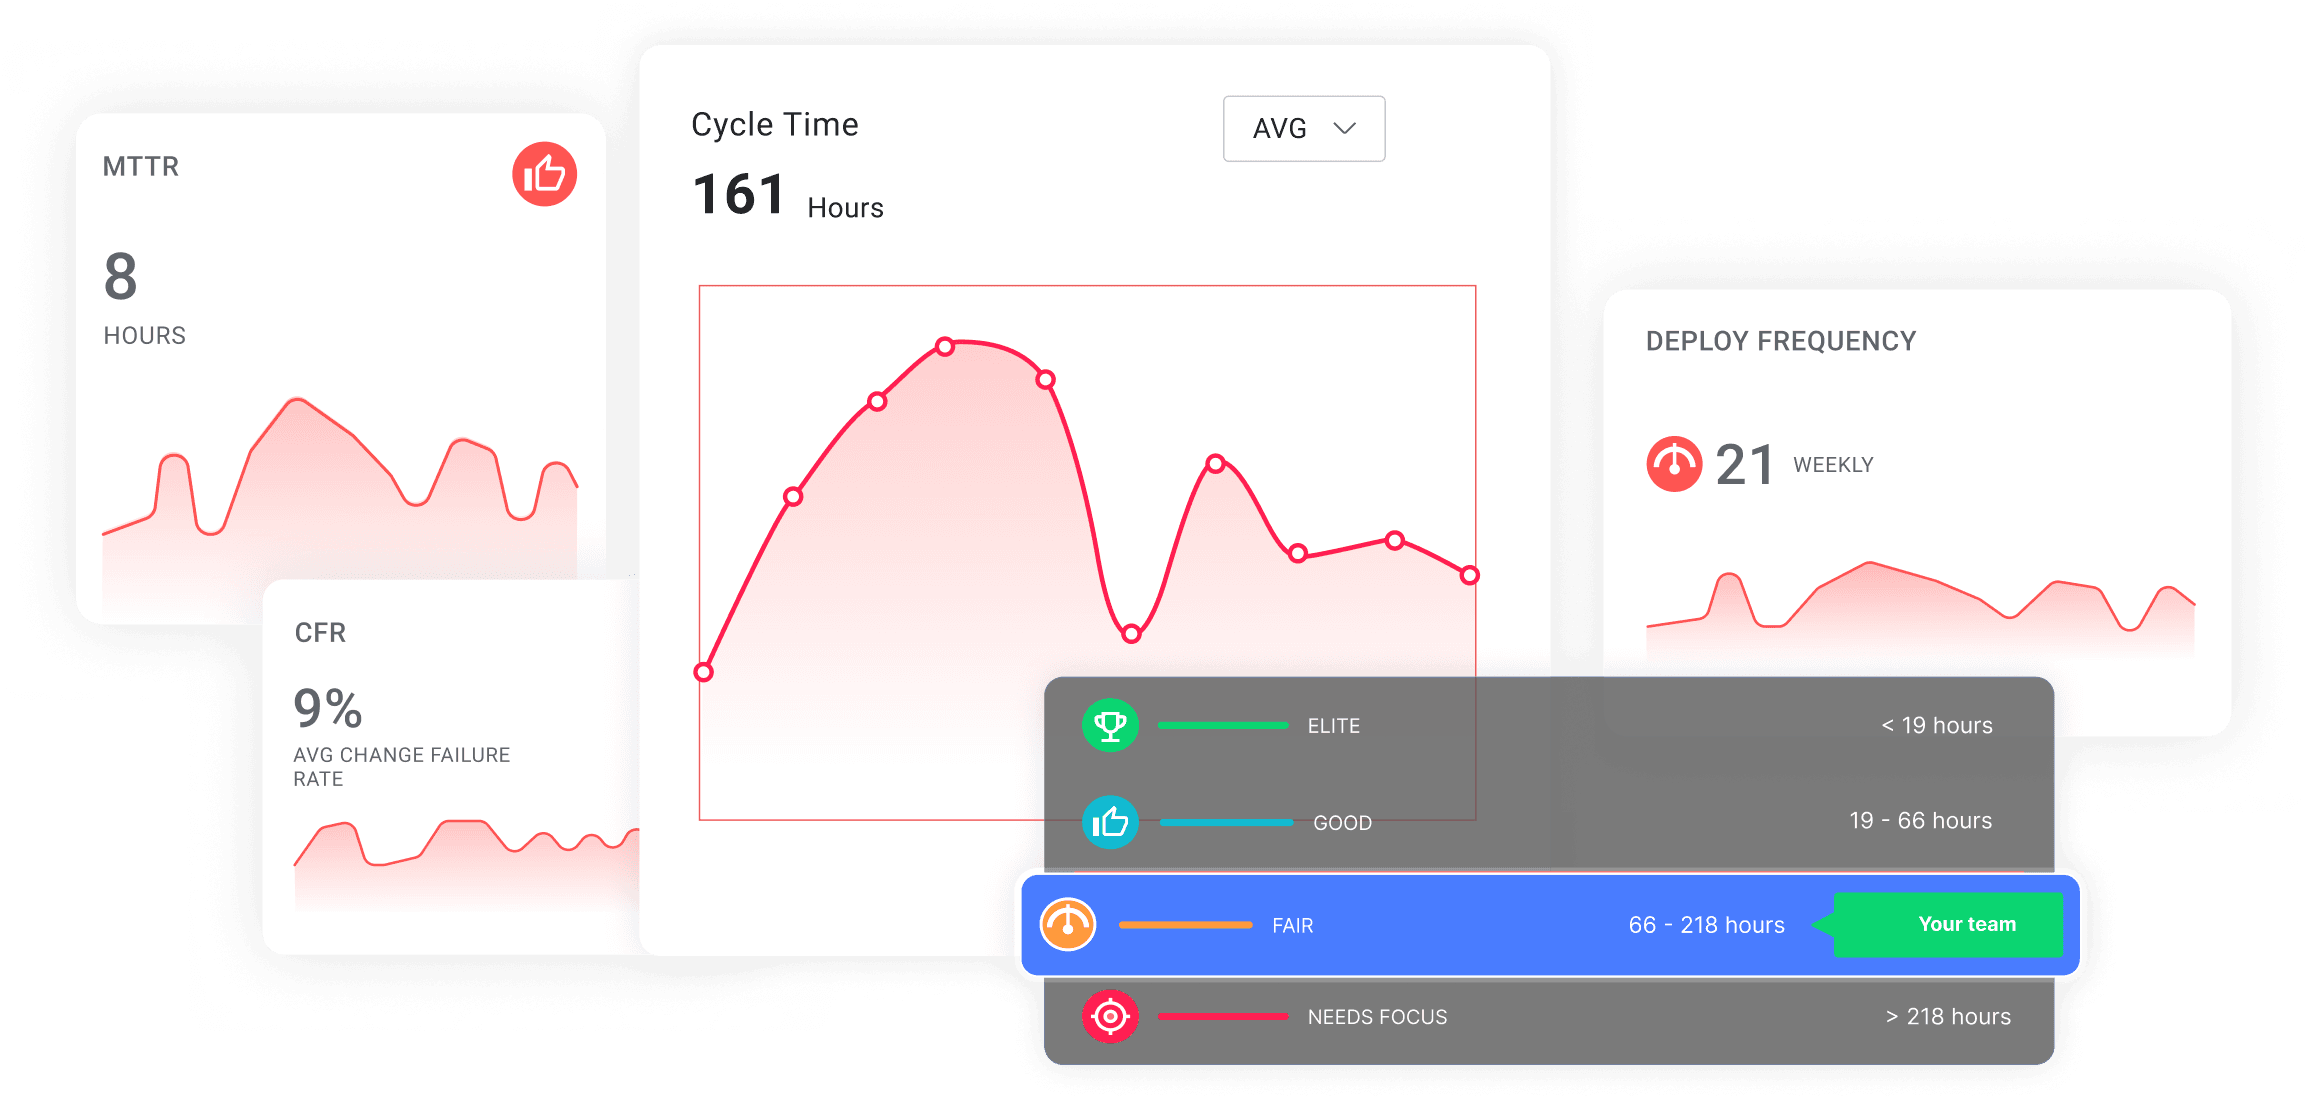
- Measure your software delivery performance with our Engineering Benchmarks, so you can see how you stack up to data-backed industry standards.
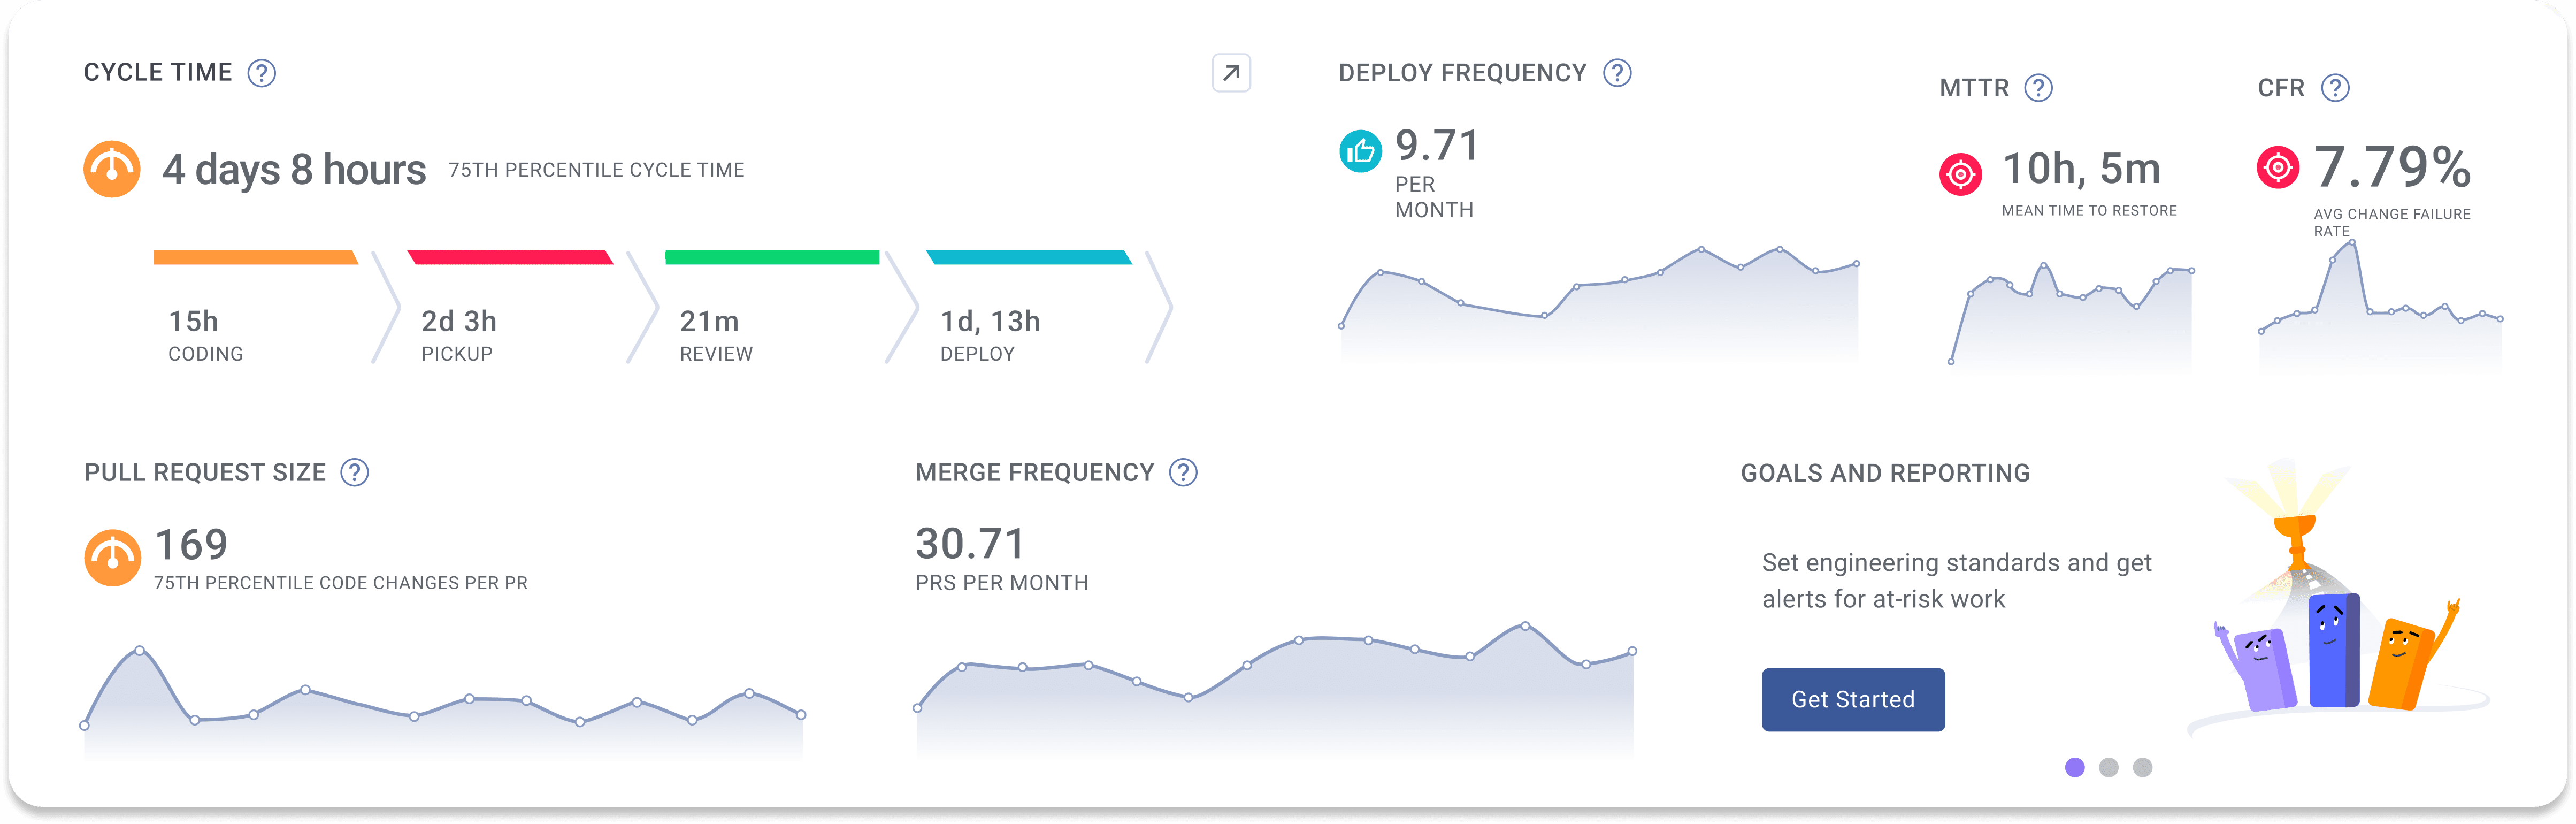
LinearB provides DORA metrics right out of the box, so you can discover your metrics in minutes and start your data-driven journey. No limitations on contributors, repos, or team size – and no credit card required. Get started today.
2. Cortex
Cortex is a helpful DORA metrics tool if you’re looking to better understand and refine your solutions, but it has limitations when it comes to extensive customization and scaling. Cortex offers several integrations, but some users may find it lacks the flexibility needed for complex team structures. Additionally, the reliance on CQL expressions can be challenging for users who are not familiar with query languages.
- Pros: Offers integrations and customizations to track DORA metrics out of the box.
- Cons: Limited flexibility for extensive customization and requires familiarity with CQL expressions, which can be a barrier for some users.
3. CTO.ai
CTO.ai offers DevOps as a Service, and they begin their implementation by measuring your DORA Metrics. CTO.ai’s Insights offers actionable data about your teams’ performance, but is best suited for smaller teams or those just starting out with DORA metrics. The platform's capabilities may be insufficient for larger teams requiring extensive integrations and more advanced reporting.
- Pros: Consolidated view of workload data across time with actionable insights.
- Cons: Limited scalability for larger engineering teams and fewer advanced reporting options compared to other tools.
4. Apache DevLake
Apache DevLake is an open-source tool designed to provide insights into your engineering processes by integrating data from multiple sources. While it offers extensive customization and flexibility, the downside is that it requires manual maintenance and upkeep to build DORA Metrics dashboards. This can be a significant burden, especially for teams that do not have dedicated resources for managing open-source tools. Additionally, there is no dedicated support available, meaning users may struggle with troubleshooting or custom setups.
- Pros: Highly customizable and flexible due to its open-source nature.
- Cons: Requires manual maintenance and lacks dedicated support, which can be challenging for teams without the necessary resources.
5. Sleuth
Sleuth is an operating system that highlights DORA Metrics as a key part of their platform. For teams that want to try Sleuth’s free DORA offering, you will run into limits on the number of users and repositories which will restrict you from deriving meaningful insights without upgrading to a paid version. Additionally, some users may find Sleuth’s capabilities too limited when compared to more feature-rich alternatives.
- Pros: Real-time tracking of deployments and bottlenecks.
- Cons: Limitations in the free version, missing capabilities and visualizations in the paid version.
6. Jira
Jira is a project management tool that helps teams plan, track, and manage their workflows. With plugins like Velocity, Jira Align, and other third-party add-ons, Jira can be extended to track DORA metrics by connecting development and deployment data. However, Jira's effectiveness for tracking DORA metrics heavily depends on integrating multiple plugins, which can make the setup complex and costly.
- Pros: Allows for Deployment Frequency, Lead Time, Change Failure Rate, and MTTR tracking through plugins and custom dashboards.
- Cons: Complex setup and maintenance due to reliance on multiple plugins, inconsistent data if teams do not update tickets properly, and potential additional costs for necessary plugins.
7. GitLab
GitLab is a DevOps platform that offers source control management, CI/CD pipelines, and deployment monitoring. It has built-in capabilities to track DORA metrics, but it can but it can lack granularity and customization.
- Pros: Automatically tracks all four DORA metrics with integrated CI/CD pipelines, providing real-time insights and metrics dashboards.
- Cons: Lacks granularity and customization, may require external tools for deeper incident analysis.
8. Datadog
Datadog is a monitoring and observability platform that helps teams track their applications' and infrastructure's performance and health. While it’s not specifically designed for DevOps metrics, it can track DORA metrics by integrating with CI/CD and incident management tools. Setting up Datadog for DORA metrics involves configuring multiple custom dashboards and integrations, which can be complex and costly.
- Pros: Excels at monitoring MTTR and Change Failure Rate, with customizable dashboards and seamless integrations.
- Cons: Limited native support for DORA metrics, high cost as more features are added, and a steep learning curve for custom dashboard configurations.
9. CircleCI
CircleCI is a CI/CD platform commonly used to track deployment frequency and lead time as part of continuous delivery practices. However, CircleCI’s capabilities for tracking the complete DORA metrics set are limited, and teams may need additional tools to get a full picture.
- Pros: Tracks Deployment Frequency and Lead Time, with easy integration options and reusable configuration packages (orbs).
- Cons: Lacks native incident management capabilities, and metrics may lack the granularity needed for more complex environments.
10. Pluralsight Flow
Pluralsight Flow provides visibility into engineering efficiency, including DORA metrics, but it comes with some downsides. It is often criticized for its steep learning curve and complex setup, which can be a barrier for teams trying to get started quickly. The platform may also feel overwhelming for teams that are not familiar with advanced analytics tools.
- Pros: Detailed reporting on DORA metrics and advanced visualizations.
- Cons: Steep learning curve and complex setup process, which may be daunting for teams looking for quick implementation.
11. Swarmia
Swarmia is a software engineering intelligence platform tool that focuses on data-driven insights, including DORA metrics. Swarmia’s value can be limited by its integration options and lacks integration with several popular developer tools like GitLab, Shortcut, and Azure DevOps, This greatly limits its compatibility for many organizations.
- Pros: Focuses on key DORA metrics and offers goal-setting capabilities.
- Cons: Integration limitations and user restrictions make it impractical for larger teams without upgrading to a paid plan.
12. Jellyfish
Jellyfish helps engineering leaders understand team performance by providing insights into DORA metrics, team efficiency, and delivery cycles. Although Jellyfish integrates with Git, project management tools, and incident management platforms, setup often requires more vendor-supported customization and hands-on configuration from engineering teams.
- Pros: Tracks DORA metrics alongside additional engineering KPIs, identifies bottlenecks and inefficiencies.
- Cons: Limited customization for advanced needs, potentially high cost for larger organizations, more time to configure.
13. GetDX
GetDX is an engineering intelligence platform that provides insights into engineering metrics, including DORA metrics, with a focus on improving developer experience. The tool integrates with existing systems, but requires additional setup to connect with all the necessary data sources, and the customization capabilities can be limiting for teams that need more control over their metrics.
- Pros: Focused on developer experience, provides DORA metrics tracking.
- Cons: Requires setup to connect data sources, limited customization options, lack of granularity with quantitative metrics.
How to Choose the Right DORA Metrics Tool for Your Team
With so many DORA metrics tools available, it’s important to choose the right one for your team’s needs. Here are factors you should consider:
- Integration Capabilities: Does the tool easily integrate with your existing systems, like Git, Jira, and CI/CD pipelines?
- Customization: Can the tool be customized to fit your team’s specific workflows and reporting needs?
- Actionable Insights: Does the tool go beyond tracking metrics and provide suggestions for improvement?
- Ease of Use: Is the interface user-friendly for all team members, from engineering managers to developers?
At LinearB, we’ve made it a priority to excel in each of these areas. We focus on providing seamless integrations, easy-to-use dashboards, and actionable insights that empower engineering teams to improve.
Looking for a comprehensive solution that helps you track, optimize, and take action? LinearB stands out as the market leader in delivering actionable DORA metrics insights.
Metrics Alone Don’t Improve Dev Teams
DORA metrics are here to stay, but how you monitor and implement these metrics into your engineering org makes all the difference. Measuring them with DORA metrics tools alone isn’t enough—and that’s exactly why we created LinearB.
Our DORA metrics software doesn’t just help you track your metrics. We help you build on and improve them, boosting your developers’ productivity and overall output quality. LinearB provides Engineering Benchmarks to work alongside DORA metrics, so you always have a complete assessment of your engineering org. Powerful tools like gitStream and WorkerB also help your engineering leaders automate parts of their workflows to optimize team productivity. Plus, Team Goals enables your dev teams to track their progress and continuously improve.
Want to improve your engineering processes at every level? Get started with a LinearB free-forever account today!