

Understanding your teams’ progress is essential to making informed decisions and ensuring business success. But this can be difficult if you don’t have hard or standardized data to show what your org is working on. Without accurate visibility into your teams’ workflows, tracking progress, identifying improvement areas, and effectively supporting your teams can become a mammoth task that chips away at your precious time.
Jenna Smith, Sr. Customer Success Manager at LinearB, sat down with several customers from around the world who provided insights into how they have leveraged LinearB to enable their teams with the engineering metrics and visibility they need to improve workflow processes and enhance their developer experience. They also discussed what makes their teams elite and how they’re hitting their productivity, pipeline, and workflow goals.
The panel included Paulo Almeida, CTO at Rabbit Care; Pini Shah, Engineering Manager at Shippo; and Ricardo Abdalla, Engineering Manager at Pismo. Watch the full interview below, or read on for the key takeaways.
Table of Contents
- What Metrics Matter?
- What to Do with Metrics?
- Who Chooses Which Metrics Matter?
- Metrics Alone Don’t Improve Dev Teams
What Metrics Matter?
Defining what metrics matter is key to improving engineering efficiency. In software development, the metrics that matter might not mirror metrics in other areas like shipping or finance.
Thankfully, the software industry has its own set of meaningful metrics that can help you understand critical areas of interest in your pipeline. The leaders on our customer panel discussed two of the most important metrics: cycle time and carryover.
1. Cycle Time
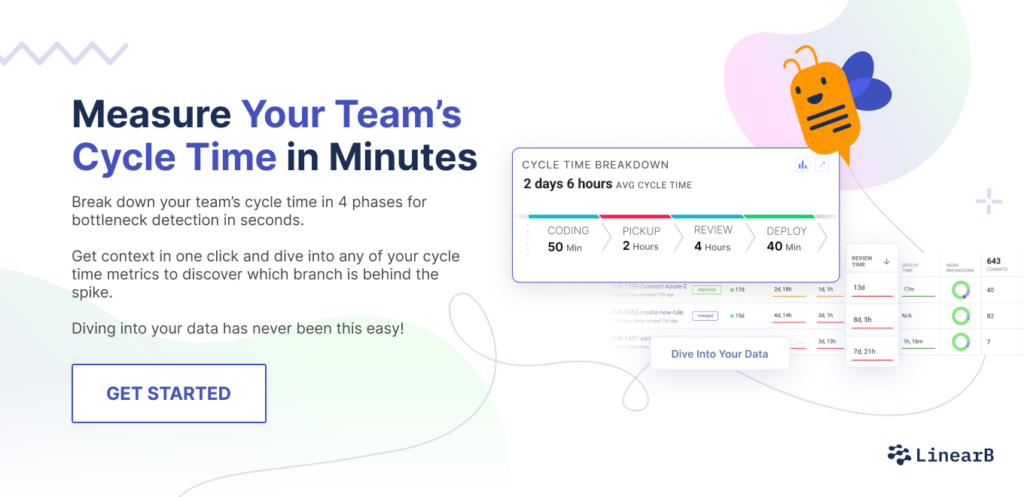
Cycle time is one of the four DORA metrics calculated as the time from the first commit to production release — essentially, the end-to-end time for a certain task.
Before switching to LinearB, Ricardo and Paulo struggled with a lack of standardization in metrics across teams. Even if all of their teams were calculating cycle time, each leader had their own way of calculating it. These leaders also found the process of manually extracting valuable metrics from GitHub to be tedious and time-consuming.
So they turned to LinearB, which correlates data from your Git provider and project management tool to instantly calculate cycle time and other standard metrics, like DORA, within minutes.
2. Carryover
Carryover is the number of story points or issues planned in a specific iteration that didn’t get completed. These tasks will then have to be carried over to the next iteration.
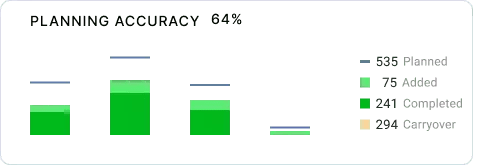
Paulo noted that carryover, even more so than code changes, is a good indicator of whether your team is moving at the right pace.
Why the Right Metrics Matter
Ultimately, the group shared that the right metrics provide critical insights into the following questions:
- How quickly can new engineers become productive?
- Are any bottlenecks slowing down deployment?
- Are my teams sized and scoped appropriately?
- What areas in the process get in the way of delivering value?
Pini also reminded the group of Peter Drucker’s (an influential contributor to Management Theory) words, “What gets measured, gets managed.” But the rest of that quote is also fantastic: “even when it’s pointless to measure and manage it, and even if it harms the purpose of the organization to do so.”
And that’s exactly why it’s so important to nail down what metrics matter. If you don’t, you’ll likely waste time and effort measuring and managing metrics that actually harm your organization.
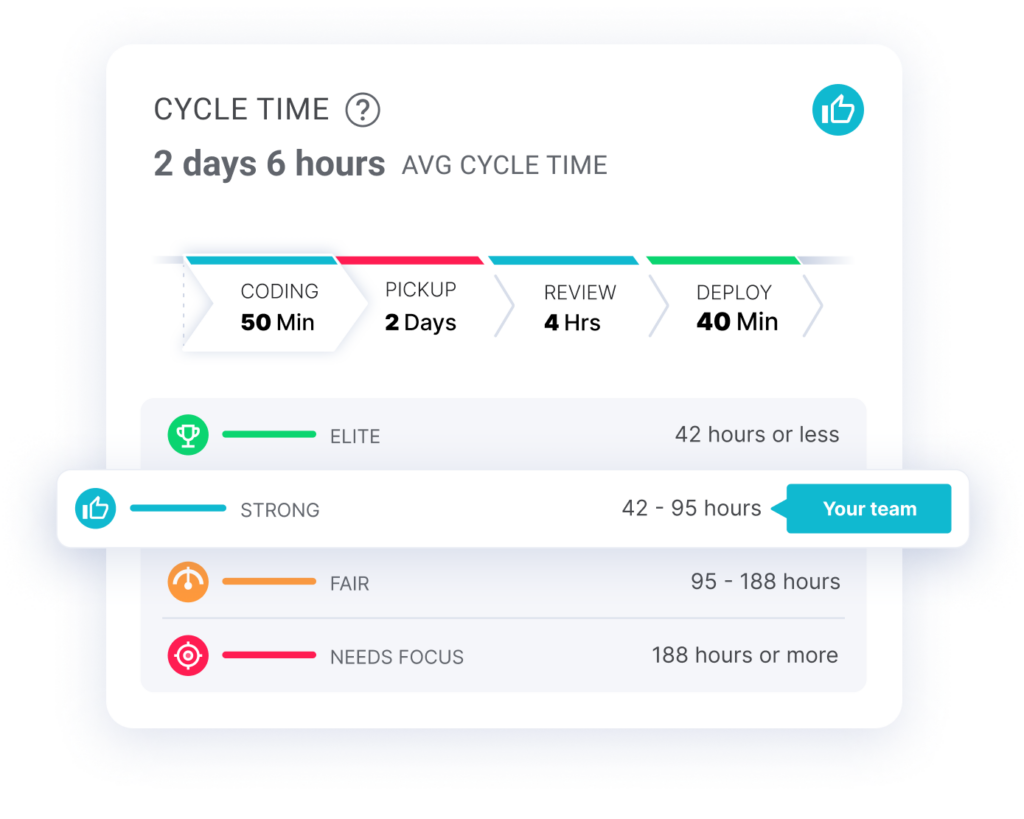
Pini shared that she really values the four DORA metrics, but also noted that the order in which you prioritize and emphasize these metrics can vary depending on your company’s size, stage, and goals. And this is why LinearB has studied millions of branches across thousands of dev teams to generate the Engineering Metrics Benchmarks Report.
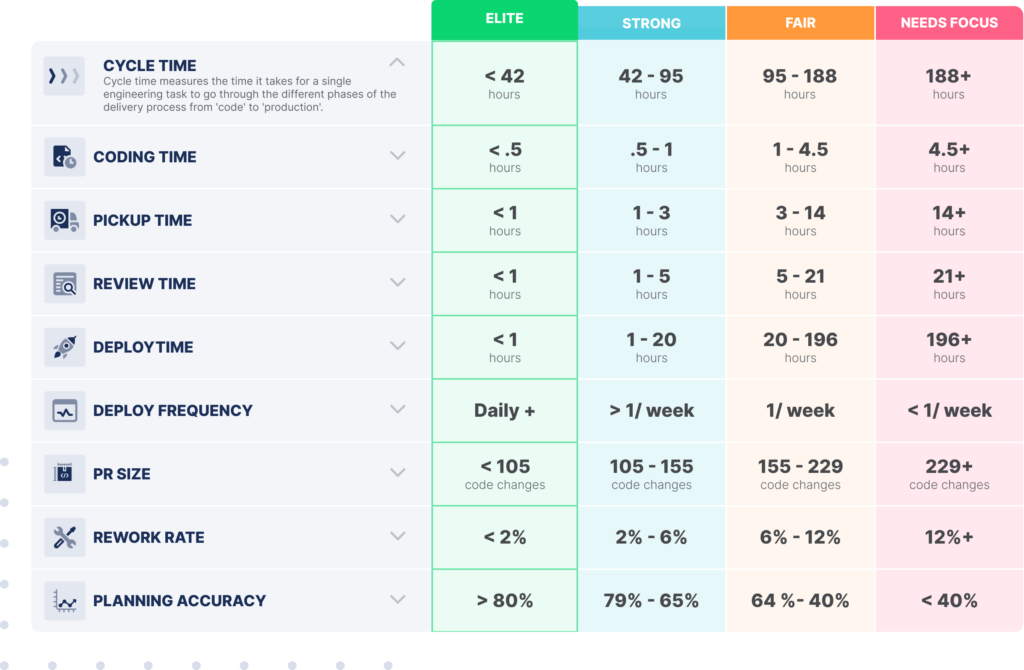
Ricardo noted that certain changes in metrics could be indicators of underlying issues related to people, processes, tools, and the environment. Ultimately, these metrics are an ideal starting point for improvement. Getting started with LinearB includes understanding how your teams compare against the benchmarks report. Your rank (elite, strong, fair, or needs improvement) is baked right into the dashboards.
But once you have the right metrics and know where you stand against industry benchmarks, what’s next?
What to Do With Metrics?
What you actually do with the metrics is much more important than which metrics you surface. Simply collecting data, surfacing metrics, and studying them won’t yield any positive results. There’s even a saying for this — DRIP: data rich, information poor — meaning, you can only make a difference with proper interpretation and action. And using metrics happens in two planes: the management plane and the developer plane. Below we’ll look at how each group uses metrics.
1. How Managers Use Metrics
The panel first emphasized NOT using metrics to micromanage your devs. Your devs will inevitably be worried about that.
Pini noted that the team at Shippo consciously doesn’t focus on granular changes in metrics. Instead, they want to keep the metrics at a high level and at a distance from their day-to-day work. This prevents devs from focusing only on improving the metrics, thus gaming the system.
The panel leaders also emphasized the importance of adopting a culture of “measuring to learn and improve, not to fire”. They also agreed that voicing this culture to your teams is critical. Meaning, engineering leaders should use metrics to celebrate the good and address the not-so-good.
Since adopting LinearB, Ricardo’s org saw a big change in its day-to-day operations. He shared that his managers started spending less time and effort collecting data or getting consensus on how to calculate the metrics. This means they had more time and energy to actually solve problems.
Paulo’s team has taken a creative approach to using metrics: they treat them like a game. They regularly review and reward teams with the best score for fifteen or sixteen key metrics. He says they never share which team was the worst because that’s demotivating. But sharing who’s best stimulates pride and motivates developers to self-improve.
One of the most compelling uses for metrics is self-improvement! Building a culture around self-growth addresses a vital component of human nature. So let’s dig deeper into how developers can use metrics themselves.
2. How Devs Use Metrics
Self-determination theory (SDT) states that humans strive for autonomy, competence, and relatedness. But New York Times best-selling author Daniel Pink puts it another way. He uses the terms “autonomy,” “mastery,” and “purpose” to expand upon the SDT needs. Pink claims that we want to learn and improve. We want to connect with others and serve the greater good. And we want to do so by choice.
When using tools for self-improvement, a bottom-up approach is probably the most effective. Those doing the work want to know how they’re doing and how they can improve. They understand that measurement is the start of their self-improvement journey. With these measurements, they can get insights to learn how to grow and achieve mastery. It’s in the developer’s day-to-day work, after all, where changes will actually happen.
Pini and Paulo both mentioned how their developers use WorkerB. WorkerB automates many manual tasks and helps speed up the PR process, making devs’ lives easier. Once engineering leaders and devs have set custom targets for their teams using Team Goals, they can use WorkerB to help their teams achieve them. And engineering leaders and devs can collaborate and co-create these goals based on their benchmark data.
We’ve established that leadership has a different perspective than their developers. Developers focus more on improving aspects that impact their day-to-day functioning. Your devs are closer to the work your org is doing. They know what’s working and what’s not — at least in their domain. And you, as the leader, are closer to the business outcomes and know what’s aligned and what isn’t. So this begs the question, Who chooses which metrics matter?
Who Chooses Which Metrics Matter?
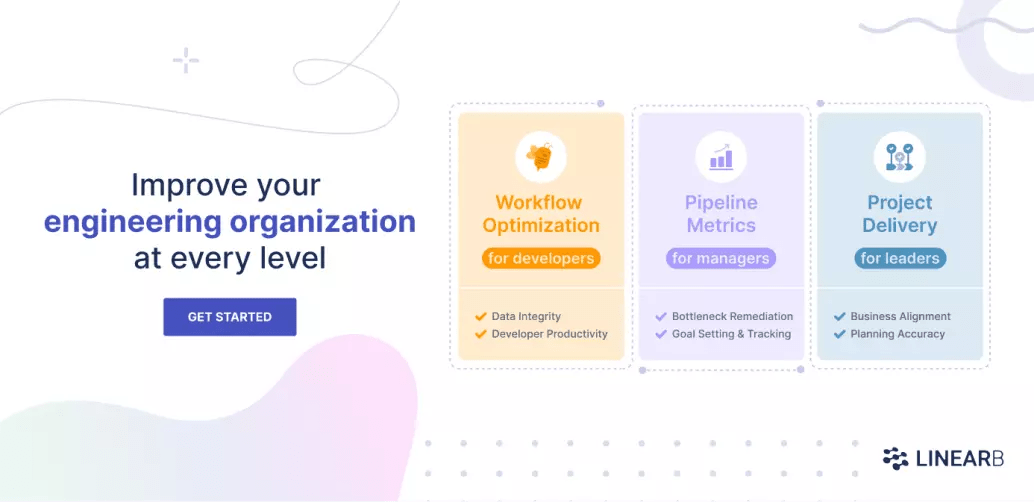
Different perspectives come together in the workplace to make the whole system function. This means you should share the responsibility of choosing which metrics to watch. Leadership and devs should each choose two or three metrics to focus on.
Leadership should focus on metrics like planning accuracy and resource allocation. These metrics help you get a clear picture of your teams’ progress and steer business decisions. Instead of focusing on individual dev performance, you get a better view of how things are going at a bird’s eye level.
Paulo shared that engineers have often asked him which metrics they should focus on. That’s likely a common scenario in your org, too. And that’s no surprise. Devs often look to their managers for direction — it’s part of the job description!
Managers should encourage devs to seek self-improvement. Allow them to focus on metrics like PR size, cycle time, and merge frequency, all of which are directly related to devs’ operations.
Managers should also offer support, guidance, and coaching when necessary. In this way, measuring metrics becomes a partnership for improvement at all levels.
Metrics Alone Don’t Improve Dev Teams
The industry is flooded with metrics and even more ways to collect data for them. That’s why it’s important to understand WHY you should collect metrics. But you should also learn HOW to use them. The consensus is: include engineers, leave room for autonomy, and use the metrics to learn and improve — not to punish or fire.
LinearB provides standard metrics and resources for understanding industry best practices around software engineering productivity, so you don’t have to guess. Using our 3-step recipe for success, you can benchmark your teams’ performance, use Team Goals to set team targets, and then use WorkerB to automate improvement.
Team Goals allows you to customize targets, track your teams’ progress, and celebrate their wins to encourage continuous improvement. And WorkerB automates tons of manual tasks, helping your teams reach these goals. It also gives them contextual information about their PRs, so they feel way more empowered.
You can also use our workflow automation tool gitStream to streamline the PR process. Small, low-risk changes can get merged quickly, while larger, higher-risk changes can get routed to the correct reviewer.
Whatever your business goals, focusing on the right metrics is the first (and we’d argue the most important!) step in achieving them. With LinearB, you can measure and improve the right metrics to ensure you get the right results across your teams and org overall.


