Four signals your team is absorbing AI's hidden cost

Summary
- Four signals move before delivery does: reviewer imbalance, PR readiness, context switch and active on weekends, all on LinearB's engineering health dashboard.
- The busiest 20% of reviewers absorb the AI verification load; Kraken cut review time by more than half by routing reviews by ownership.
- Elite teams keep PR maturity above 89% and teams below 77% need focus; when it falls, review turns into rework and rubber stamping (LinearB 2026 benchmarks).
- Developers who use AI on 75%+ of coding days merged 95.7% more pull requests year over year, so each engineer holds more work in flight.
- 84% of developers work overtime at least occasionally (Developer Nation, 2024); treat a sustained rise in weekend work as a capacity signal.
Your team is absorbing AI's hidden cost when AI output rises faster than the process around it, and people make up the difference. The AI productivity paradox shows up in your engineering data as four signals that move before delivery does: review load concentrating on a few people, pull requests arriving before they are ready, more work in flight per engineer, and work spilling into weekends. According to LinearB's 2026 Software Engineering Benchmarks Report, developers who use AI on 75% or more of their coding days merged 95.7% more pull requests year over year, while elite teams still hold PR maturity above 89% and teams below 77% need focus. The volume went up. The people reading it did not.
This guide walks through each of the four signals on the engineering health dashboard in LinearB: what to watch, what to change, and how you'll know it worked. It ends with a six-row scorecard to decide which signal to fix first. Updated November 2026.
AI's hidden cost is the work your engineers absorb when AI tools raise output faster than review, planning and working hours can keep up. It leaves a trace in your git history, your ticket system and your team's working hours before it shows up in cycle time or delivery.
The four signals that move first
Every bottleneck in a software factory leaves a trace in your git history, your ticket system and your team's working hours, and that trace appears before your delivery numbers move. The engineering health dashboard in LinearB turns the trace into four signals you can act on: whether review rests on a few people (reviewer imbalance), whether work spills past the week (active on weekends), how much each developer is holding at once (context switch), and whether work arrives ready for review (PR readiness).
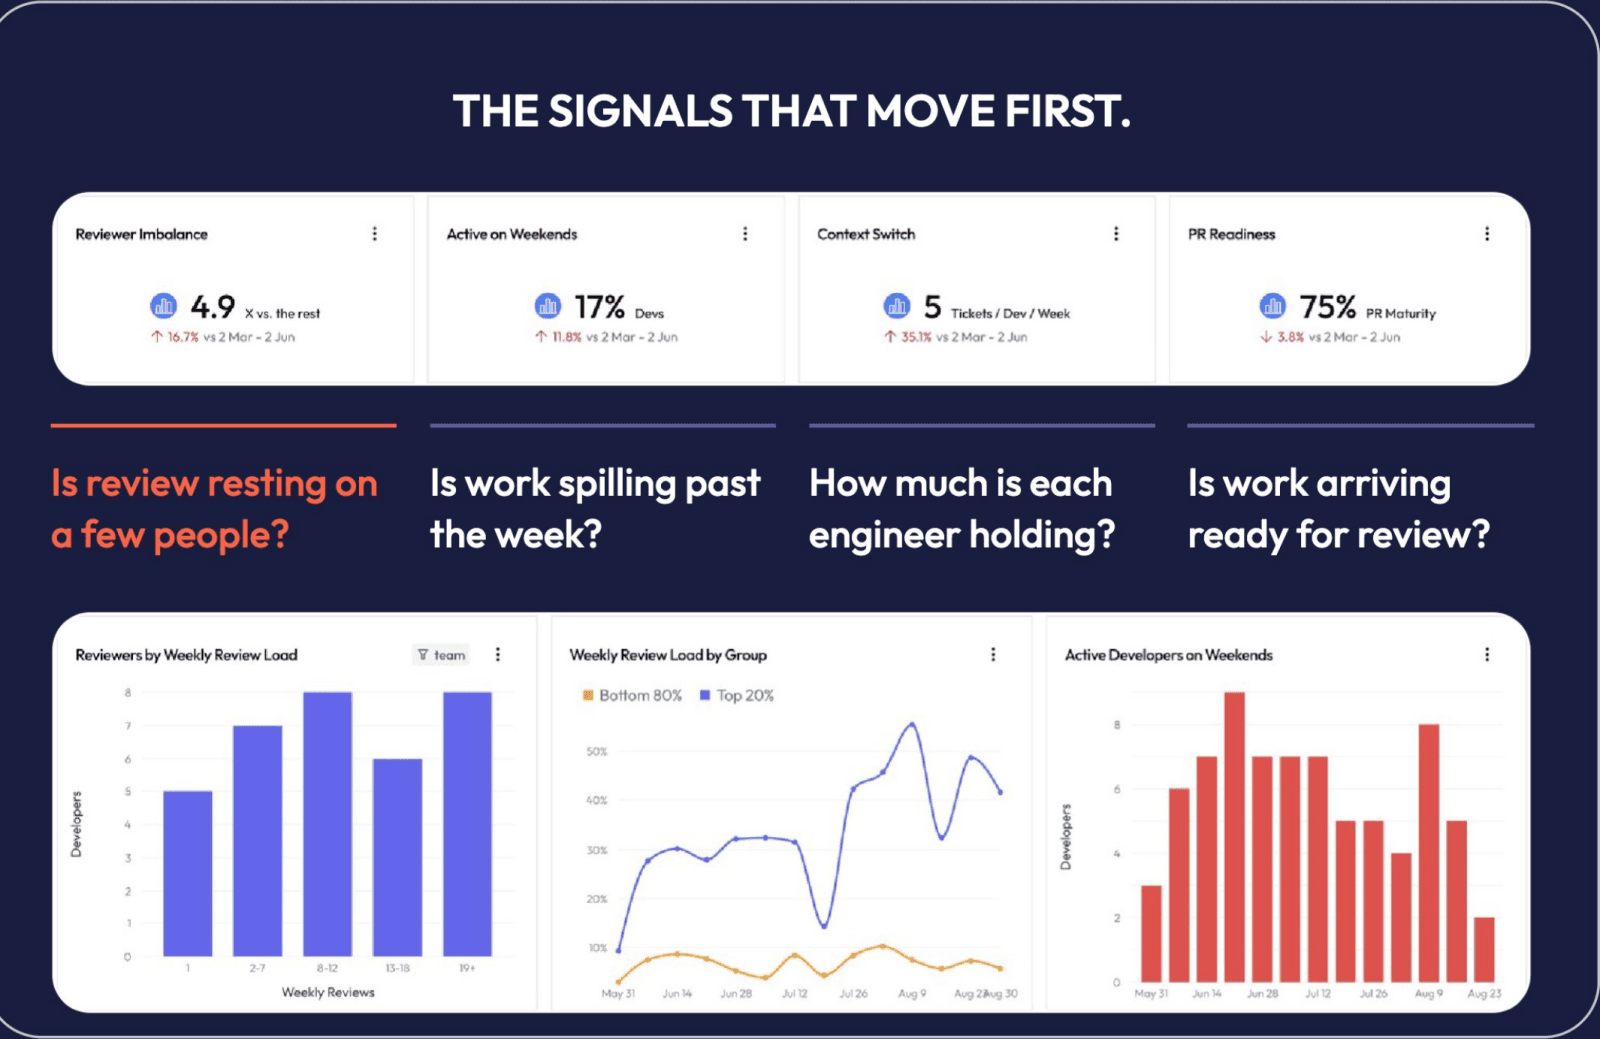
Each signal is a bottleneck you can measure and fix. The sections below take them one at a time, in the order they appear on the dashboard. If you want the strain behind these numbers first, start with who is holding up your AI-generated code.
What to do next: open the engineering health dashboard and note today's value for all four signals. Every fix below is judged against that baseline.
Download your free copy of the guide
Signal 1: review load concentrates on a few people
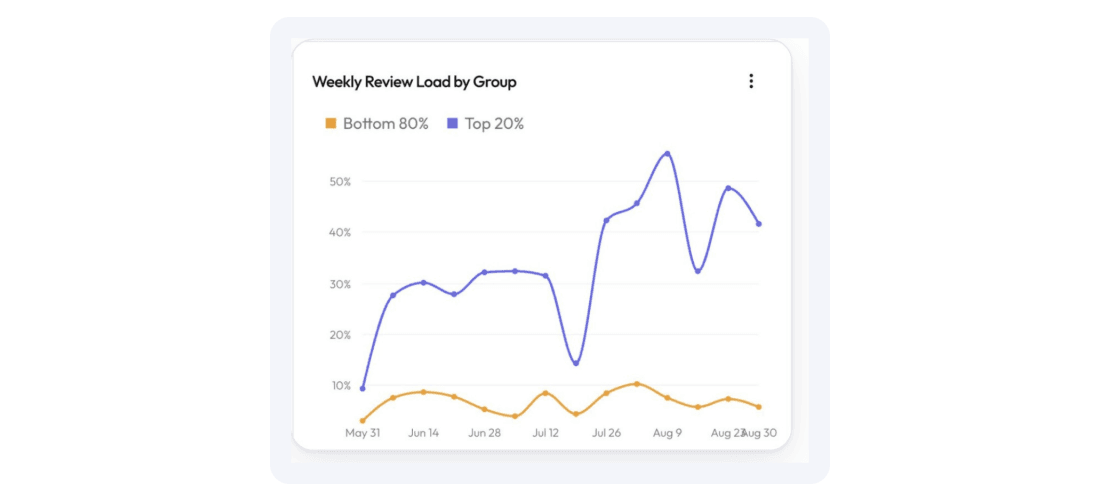
When review volume climbs faster than the number of people doing it, the extra work lands on the engineers with the most context. A Fastly developer survey found the verification load for AI-generated code falls most heavily on senior developers. Reviewer imbalance on the engineering health dashboard shows how far that load has concentrated on your own teams, by comparing the busiest 20% of reviewers with everyone else, week by week.
What to watch
Reviewer imbalance: how many more reviews the busiest 20% of reviewers do each week compared with everyone else. A widening gap means review work is concentrating, and the engineers it concentrates on are the senior ones whose judgment the team already leans on.
What to change
Route review by ownership. Kraken traced 70% to 80% of its review delay to time zones, silos and reviewer availability, then cut review time by more than half. With gitStream, you can assign reviewers by directory or by code expertise, and route a share of reviews to engineers building knowledge of an area.
How you'll know it worked
Reviewer imbalance comes down week over week, and agentic pull requests get picked up about as fast as manual ones.
What to do next: list the repositories where the busiest 20% of reviewers spend their review time, and turn on reviewer assignment by directory for those first.
Signal 2: pull requests arrive before they're ready
PR maturity measures how little a pull request changes after it opens for review. According to LinearB's 2026 Software Engineering Benchmarks Report, elite teams keep PR maturity above 89%, and teams below 77% need focus. When it falls, pull requests are opening before they are ready, and reviewers spend their time on rework instead of review. Under that load, a share of reviewers stop reading closely at all.
The quiet version of this signal is review that stops being review. One engineering leader in LinearB's 2026 leadership survey described it plainly: a larger amount of code slips into production without proper review, as rubber stamping. When PR maturity drops and the zero-reviewer merge count climbs on the same team, that is the pattern to look for.
What to watch
PR readiness: how complete pull requests are when they open, scored from 0 to 100%. The dashboard trends it weekly, so you can see whether the Very low band is growing and which teams are sending the least review-ready work.
What to change
Match review depth to risk. Decide which changes need human judgment, such as architectural calls and security-sensitive paths. AI code reviews in LinearB take the first pass on the rest, and in LinearB's 2026 AI benchmarks, AI code review lifts the share of pull requests merged within 30 days by up to five percentage points.
How you'll know it worked
PR readiness holds steady or climbs, and your most senior reviewers take on a smaller share of routine reviews.
What to do next: count the pull requests that merged with zero reviewers last quarter, by team, and put a human review policy on the paths where that number is highest.
Download your free copy of the guide
Signal 3: more work in flight means more context switching
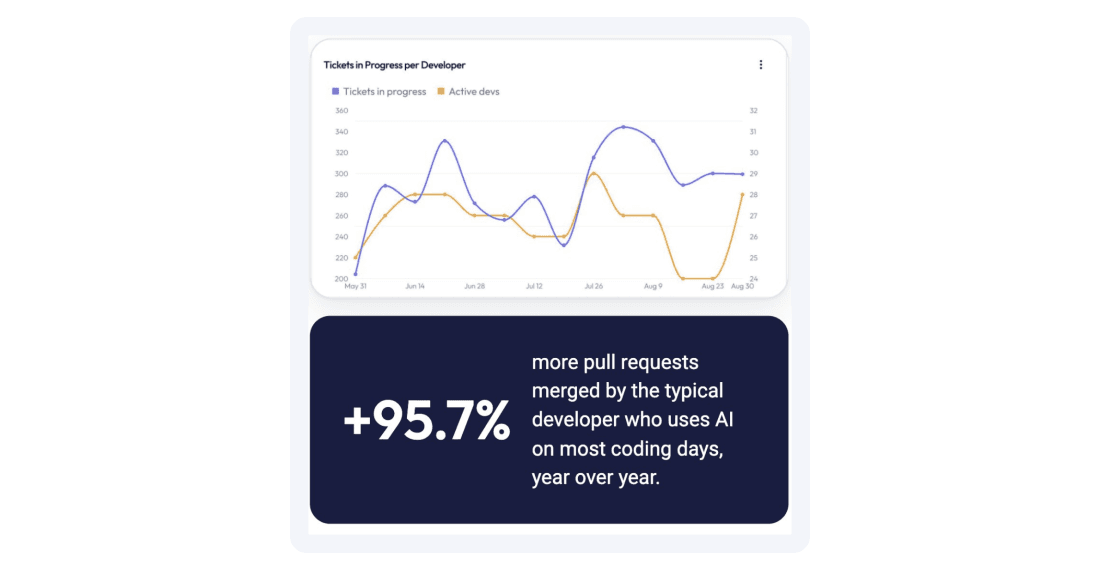
More merged work per person means more work in flight and more switching for each engineer. The engineering health dashboard tracks tickets in progress per developer week by week, so you can see whether each engineer is carrying more open work at once. According to LinearB's 2026 AI benchmarks, developers who use AI on 75% or more of their coding days merged 95.7% more pull requests than they did a year earlier, while developers who use no AI merge at about the rate they did a year ago. That extra output came from volume.
What to watch
Context switch: how many different tickets a developer works on in a single busy day, on average. It climbs fast with agents. One engineering leader described developers running five or six Claude Code sessions across five or six projects at once.
What to change
Give parallel work a ceiling. Before you add more agents to a team, check how much of each sprint arrives unplanned. The planned vs. unplanned completion chart shows whether incoming work is displacing the plan, and an agreed limit on tickets in progress per engineer caps the switching. The broader pattern, where faster coding moves the constraint downstream, is covered in why cycle time climbs as AI output rises.
How you'll know it worked
Context switch falls back toward your team's earlier level, and more of each sprint's planned work gets finished.
What to do next: agree a tickets-in-progress limit per engineer with each team lead before the next agent rollout, and write it into the sprint plan.
Signal 4: your factory has a night shift
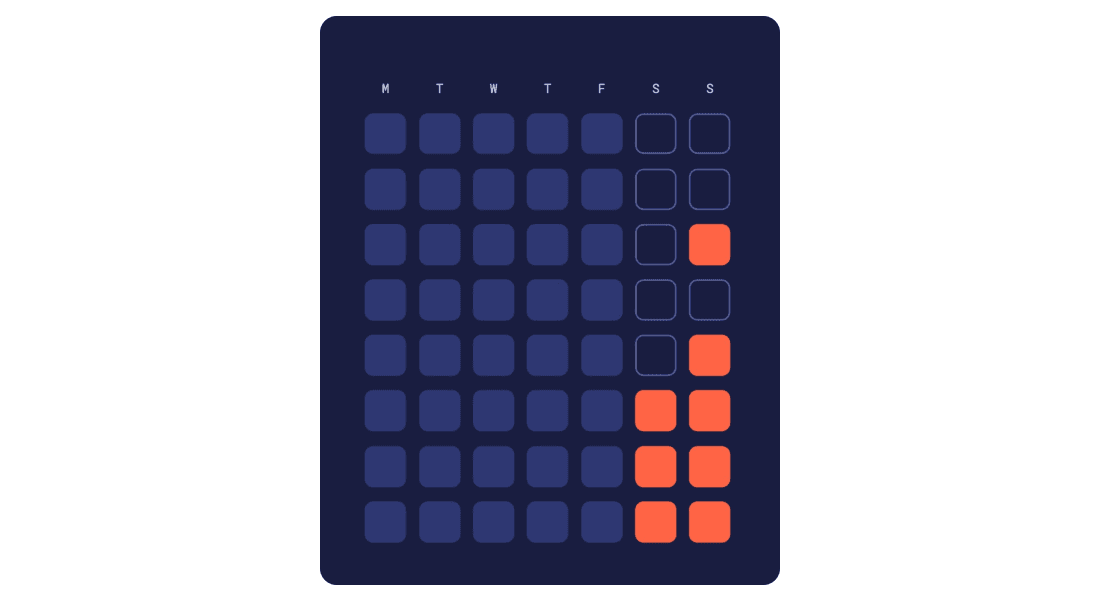
The night shift in a software factory is run by senior engineers. According to Developer Nation's State of Developer Wellness 2024 report, 84% of developers work overtime at least occasionally. One LinearB customer described a senior engineer as the last human in the loop on a large volume of AI-written code. At another company, one engineer had worked 19 days straight without a day off.
What to watch
Active on weekends: the share of developers who do Git work on weekends in a given week. A sustained increase signals delivery pressure, and repeated peaks on the same team point to a pattern. A short survey to that team tells you whether it is one deadline or something that keeps happening.
What to change
Treat weekend work as a capacity signal. A sustained rise means the plan needs more capacity than the team has. Check whether the same people top the review load, and move work off them before asking anyone to push harder. If the pattern holds, rebalance the plan rather than the hours. LinearB's guide to sustaining engineering health covers the rebalancing conversation in more depth.
How you'll know it worked
Active on weekends falls back to its earlier level, and the people doing the most reviews are no longer the ones working weekends.
What to do next: cross the active-on-weekends list with the reviewer imbalance list. The names on both are where the plan needs changing first.
Download your free copy of the guide
Score how much your factory leans on people
Tick each statement that is true of your organization today. Each unticked row names the view in LinearB to open first.
| True of us today | Where to look in LinearB |
|---|---|
| Review work is spread across your reviewers, and the busiest few carry a stable share month over month | Reviewer imbalance (Signal 1) |
| Weekend activity is flat or falling | Active on weekends (Signal 4) |
| Engineers work on a manageable number of tickets at once | Context switch (Signal 3) |
| Pull requests arrive ready for a reviewer to work with | PR readiness (Signal 2) |
| Every agent-authored pull request has a named human owner | Agentic vs. manual acceptance rate (see the AI code review bottleneck) |
| You have asked your developers how the shift is landing in the last quarter | Developer surveys |
Start with the first unticked row, fix that signal, and score again next quarter. Six ticks means your process is keeping up with your AI output; fewer than three means people are absorbing the difference.
Frequently asked questions
What is the AI productivity paradox in software engineering?
The AI productivity paradox is the gap between how much more code AI helps developers produce and how little faster software ships. According to LinearB's 2026 AI benchmarks, developers who use AI on 75% or more of their coding days merged 95.7% more pull requests year over year, yet review load, rework and weekend work absorb the gain before it reaches delivery.
What are the signs that AI is creating hidden work for an engineering team?
Four signals move first: the busiest 20% of reviewers doing a rising share of reviews, PR readiness falling below 77%, tickets in progress per developer climbing, and a sustained rise in developers active on weekends. All four are tracked on the engineering health dashboard in LinearB.
Why are more pull requests merging with no review?
Reviewers under load stop reading closely, and pull requests that open before they are ready turn review into rework. Engineering leaders in LinearB's 2026 leadership survey described code slipping into production without proper review as rubber stamping. Track the count of pull requests merged with zero reviewers by team, alongside PR maturity, to see where it is happening.
What is a good PR maturity score?
Elite teams keep PR maturity above 89%, and teams below 77% need focus, according to LinearB's 2026 Software Engineering Benchmarks Report. PR maturity measures how little a pull request changes after it opens for review.
How do I know if weekend work is a pattern or a one-off?
Repeated peaks on the same team across three or more weeks point to a pattern; a single spike points to a deadline. Cross the active-on-weekends list with the reviewer imbalance list, and send a short survey to the team that appears on both.
Run the signals on your own data
You know the four signals. The next step is asking your own data about them. Six questions to ask your engineering data turns each signal into a playbook you can run through the LinearB MCP server, with what to change when the answer comes back. The engineering health dashboard is live for every LinearB customer, built on the same benchmarks as the 2026 Software Engineering Benchmarks Report.
See the four signals on your own teams: book a demo.
