# How to Build a DORA Metrics Dashboard | LinearB Blog

> Using a DORA metrics dashboard is one of the best ways to track your teams’ KPIs and improve. Learn how to build one in less than 5 minutes.

_This is a markdown rendering of a live HTML page on linearb.io, generated for AI/LLM consumption — it is not a markdown-only site. To get the full HTML page instead, request this URL with an explicit `Accept: text/html` header (no wildcard, no markdown preference)._

[Blog](https://linearb.io/blog)

/

How to Build a DORA Metrics Dashboard

# How to Build a DORA Metrics Dashboard

![Photo of Rachel Garner](https://assets.linearb.io/image/upload/c_limit,w_2560/f_auto/q_auto/v1/logo-mark-lg?_a=BAVMn6ID0)

By [Rachel Garner](https://linearb.io/blog/dora-metrics-dashboard#rachel-garner)

|

April 5, 2023

![dora_metrics_dashboard_0ab5365c75](https://assets.linearb.io/image/upload/c_limit,w_2560/f_auto/q_auto/v1/dora_metrics_dashboard_0ab5365c75?_a=BAVMn6ID0)

Optimizing software delivery is critical to your org’s success. But without visibility into the key performance indicators (KPIs) of software delivery, it can be difficult to make informed decisions on optimizing that process. It’ll also be challenging to communicate your teams’ progress and successes to other stakeholders without the right data. 

That’s where a DORA metrics dashboard comes in. This dashboard ensures you can identify bottlenecks, improve collaboration between teams, optimize delivery speed, and effectively communicate your teams’ successes. 

In this article, we’ll show you how to save yourself the hassle of building a DORA metrics dashboard manually.

## **Table of Contents**

* [What Are DORA Metrics?](#what)
* [Challenges in Building a DORA Metrics Dashboard ](#challenges)
* [How to Build a DORA Metrics Dashboard with LinearB](#how)
* [Metrics Alone Don’t Improve Dev Teams](#metrics)

## **What Are DORA Metrics?**

[DORA metrics](https://linearb.io/blog/dora-metrics/) — developed by the DevOps Research and Assessment (DORA) team — measure your software development teams’ velocity and stability.

These four key metrics can make or break your org’s productivity: 

1. [Deployment frequency](https://linearb.io/blog/deployment-frequency/) measures the number of times code is deployed into production.
2. [Lead time for changes (aka cycle time)](https://linearb.io/blog/cycle-time/) measures the average time it takes for code to go from first commit to being released to production.
3. [Mean time to recovery (MTTR)](https://linearb.io/blog/all-you-should-know-about-mean-time-to-restore/) calculates the average time it takes for a team to recover from a failure or incident.
4. [Change failure rate](https://linearb.io/blog/change-failure-rate/) measures the percentage of failed deployments or deployments that result in incidents.

Check out this video with Dana Lawson (VP of Engineering at GitHub), Charity Majors (CTO at Honeycomb), and Kathryn Koehler (Director of Productivity Engineering at Netflix) as they discuss how they apply DORA metrics to facilitate continuous improvement in their businesses:

## **Challenges in Building a DORA Metrics Dashboard**

Building a DORA metrics dashboard can be challenging. In particular, we’ve highlighted two areas that are time-consuming and error-prone when done manually. 

### 1\. **Correlating Data from Different Sources**

Trying to get all your data together from different places is one of the biggest challenges when building a DORA metrics dashboard. For example, to measure the lead time for changes, you need to collect data from code commits made in git and compare it with the deployment dates recorded in Jenkins. 

Similarly, to measure change failure rates, you need to correlate data from project management tools like Jira or Shortcut with your CI/CD pipeline. This may involve manually exporting and importing data which can take up a lot of your time. You might also face data formatting issues across different tools, which could result in errors when comparing and correlating that data.

### **2\. Effectively Visualizing Performance**

Another challenge is choosing the right visualization techniques that effectively communicate your teams’ performance. DORA metrics generate a lot of complex data, and trying to effectively see everything can be a mammoth task to handle manually. 

Your DORA metrics dashboard should be user-friendly and provide a clear overview of each team’s software delivery performance. And it should do this without overwhelming users with too much data. The dashboard should also be easily customizable to suit different people’s needs, such as developers, managers, or executives. 

So you’ll have to figure out how to give your dashboard all these features, either by doing it from scratch or by outsourcing some tools. But that’s not very time-efficient. 

Fortunately, you can work around this manual process with a [DORA metrics tool](https://linearb.io/blog/dora-metrics-tools/) that can automate data collection and correlation from various sources and offer customizable visualization options. 

## **How to Build a DORA Metrics Dashboard with LinearB**

If you’re looking to build a DORA metrics dashboard, LinearB is the best tool for the job. It pulls in data from all your sources and presents it in a way that you — and everyone else in your org — can understand. That way, you’ll have real-time visibility into your teams’ KPIs to spot bottlenecks and make informed business decisions. 

It only takes three steps to get (and maintain) your DORA metrics dashboard! 

### **Step 1: Connect Your Data Sources**

Set up your LinearB account by connecting to your Git provider, project management tool, and incident and release detection software. 

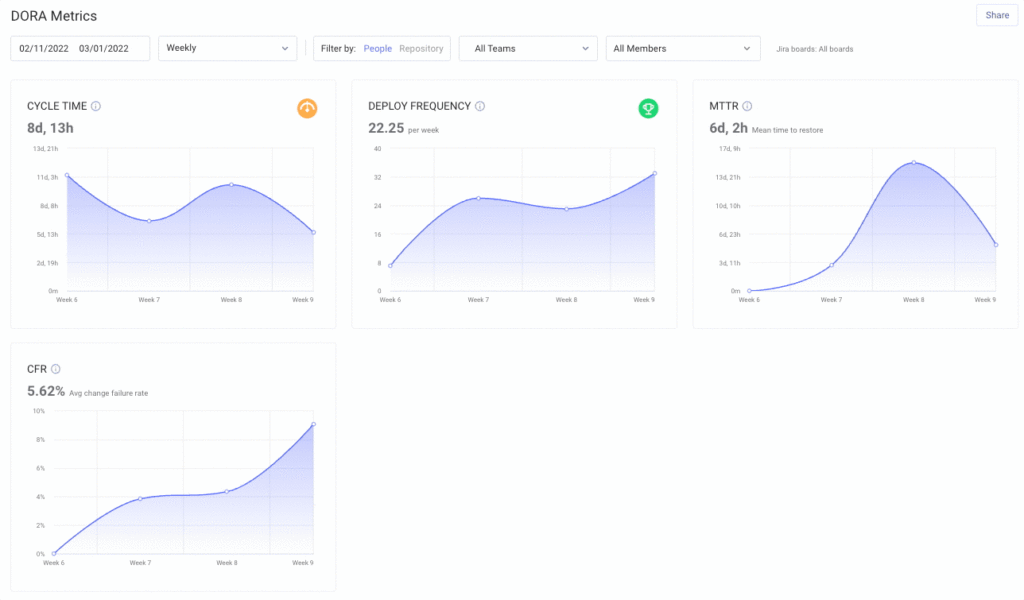
Once your data sources are connected, you’ll automatically have access to a DORA metrics dashboard that comes out of the box. To find it, just go to the Metrics tab and select “DORA Metrics” from the left menu of available dashboards.

### **Step 2: Filter Your Key Metrics**

Once you’ve navigated to your DORA metrics dashboard, you can filter the DORA metrics according to what kind of data you want to see. Your dashboard can be filtered to show data for specific date ranges, one or multiple teams, or even specific repos.

This will enable you to zero in on the data that matters the most for your teams and other stakeholders. 
![LinearB DORA metrics dashboard filtering process](https://assets.linearb.io/uploads/2023/03/gif1-1024x600.gif)

Get rid of all the noise in a click!

### **Step 3: Automate Team Configuration**

Finally, you can automate your teams’ configuration with the [Automated Team Configuration](https://linearb.helpdocs.io/article/0ecpdge217-adding-your-git-hub-teams-to-linear-b) feature. This will sync your GitHub teams with LinearB, so you don’t have to do manual updates in LinearB when team members change in GitHub down the line. 

Your DORA metrics will always be accurate because you’ll always be working with the most up-to-date team configurations. 

## **Metrics Alone Don’t Improve Dev Teams**

While DORA metrics are a critical component of measuring your org’s productivity and efficiency, metrics alone can’t improve your dev teams. It’s essential to also have a tool that helps you _do something_ with the insights from your DORA metrics dashboard.

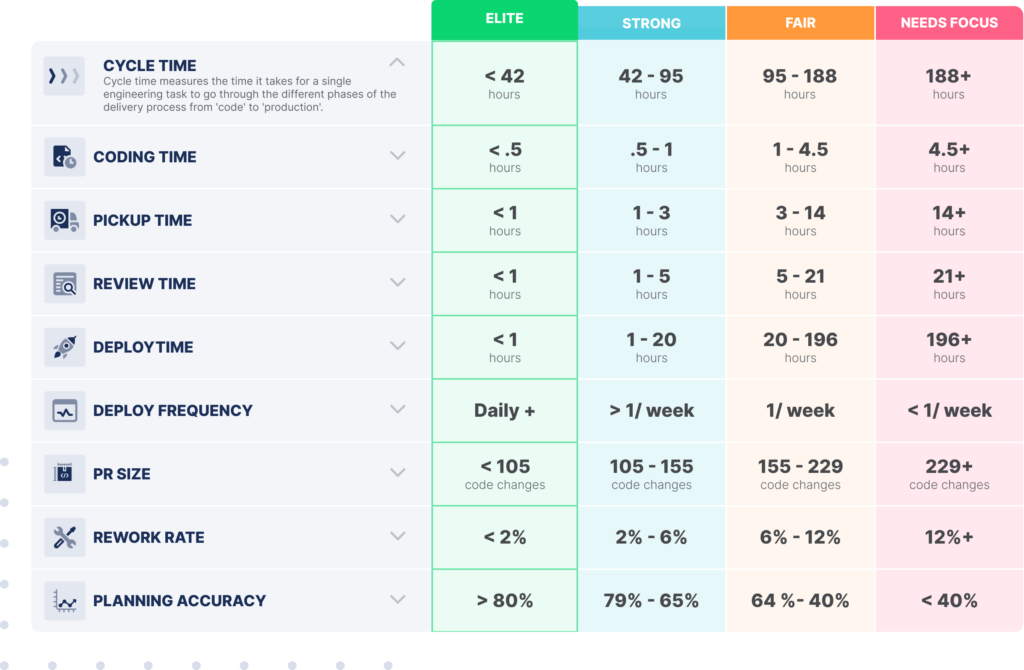
LinearB’s [Engineering Benchmarks](https://linearb.io/engineering-benchmarks/) compares your metrics against industry standards to identify where you need to improve. 
![Engineering benchmarks chart](https://assets.linearb.io/uploads/benchmarks-chart-1024x670.png)

Want to learn more about being an elite engineering team? [Check out this blog](https://linearb.io/blog/engineering-metrics-benchmarks-what-makes-elite-teams/) detailing our engineering benchmarks study and methodology.

You can then use [Team Goals ](https://linearb.io/engineering-metrics/)to set objectives for your teams’ DORA metrics and track progress toward those goals. And our AI-powered bot, [WorkerB](https://linearb.io/workflow-optimization/), lets your teams know when they’ve missed a goal or are about to. By focusing your goals and alerts on leading indicators like PR size and pickup time, you’ll see a significant improvement in your cycle time and deployment frequency. 

Finally, use [gitStream](https://linearb.io/dev/gitstream/), our workflow automation tool, to implement policies around your PR review process to reduce failures and improve CFR. For example, gitStream’s [code experts](https://linearb.io/blog/its-time-for-code-experts/) ruleset routes PRs to the most qualified contributors based on blame and activity filters to ensure changes get sent to the best reviewers.

By combining DORA metrics with programmable workflows, LinearB provides a comprehensive solution for optimizing your teams’ performance. With the ability to identify bottlenecks quickly, track progress towards goals, and automate improvement, you can easily go beyond visibility into a DORA metrics dashboard and have a plan to improve your teams.
[![datadriven engineering starts with DORA metrics](https://assets.linearb.io/uploads/DORAMetrics-1024x497.png)](https://linearb.io/get-started/)

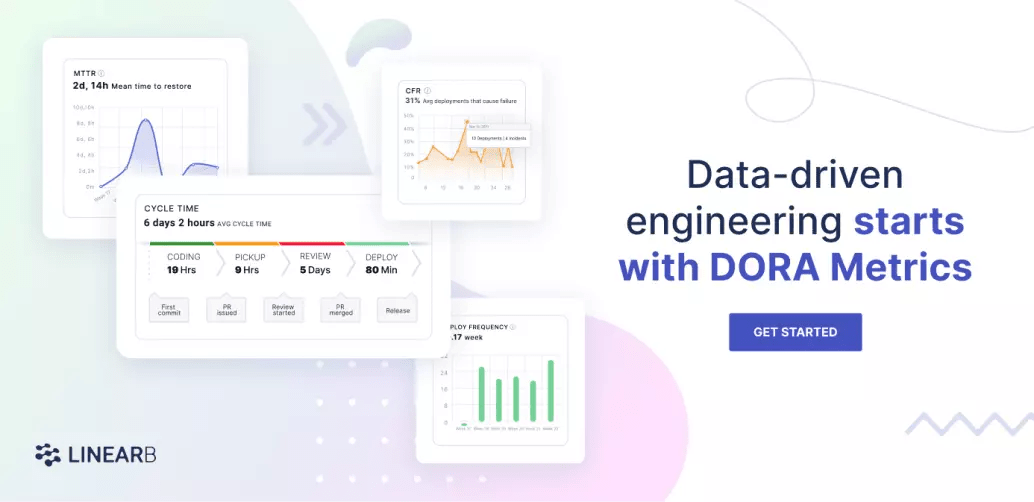
LinearB provides DORA metrics right out of the box so you can discover your DORA metrics in minutes. [Get started today!](https://linearb.io/get-started/)

## Improve developer productivity with LinearB

Find us on

[](https://www.linkedin.com/company/linearb)
[](https://devinterrupted.substack.com/)

## Your next read

[![Cover image for AI ROI comes from measuring engineering outcomes on day one](https://assets.linearb.io/image/upload/c_limit,w_2560/f_auto/q_auto/v1/Blog_AI_ROI_comes_from_measuring_engineering_software_security_2400x1256_2c5eae0862?_a=BAVMn6ID0)](https://linearb.io/blog/kraken-nik-sudan-measure-ai-roi-engineering-outcomes)

Eng. Metrics

[AI ROI comes from measuring engineering outcomes on day one](https://linearb.io/blog/kraken-nik-sudan-measure-ai-roi-engineering-outcomes)

Kraken Engineering Operations Lead Nik Sudan details how to establish day-one data infrastructure to accurately measure AI ROI. Discover why raw token adoption...

[![Cover image for AI is rebuilding software delivery from SDLC to ADLC](https://assets.linearb.io/image/upload/c_limit,w_2560/f_auto/q_auto/v1/Blog_AI_rebuilding_software_delivery_2400x1256_3fd5887e75?_a=BAVMn6ID0)](https://linearb.io/blog/sdlc-to-adlc-agentic-software-delivery-transformation)

Eng. Metrics

[AI is rebuilding software delivery from SDLC to ADLC](https://linearb.io/blog/sdlc-to-adlc-agentic-software-delivery-transformation)

Discover how engineering organizations are transitioning from the traditional SDLC to an Agentic Development Lifecycle (ADLC). Learn why rising token costs...

[![Cover image for 8 million pull requests reveal where engineering productivity breaks down](https://assets.linearb.io/image/upload/c_limit,w_2560/f_auto/q_auto/v1/Blog_8_million_pull_requests_2400x1256_03724bfbb2?_a=BAVMn6ID0)](https://linearb.io/blog/8-million-prs-engineering-productivity)

Eng. Metrics

[8 million pull requests reveal where engineering productivity breaks down](https://linearb.io/blog/8-million-prs-engineering-productivity)

8.1M pull requests reveal the gap between AI adoption and engineering impact, and why code review is the bottleneck blocking real productivity gains.

## Structured data

_Machine-readable metadata (JSON-LD) embedded in the page for search/AI context — not content rendered on the page itself._

```json
{
  "@context": "https://schema.org",
  "@type": "Organization",
  "name": "LinearB",
  "url": "https://linearb.io",
  "logo": "https://assets.linearb.io/image/upload/v1715628027/logo-mark-lg.svg",
  "description": "LinearB is the engineering productivity platform that helps engineering leaders prove AI is improving throughput without sacrificing delivery confidence, flow efficiency, or developer experience.",
  "sameAs": [
    "https://www.linkedin.com/company/linearb"
  ],
  "award": [
    {
      "@type": "Award",
      "name": "LinearB is a Leader in the 2026 Gartner® Magic Quadrant™ for Developer Productivity Insight Platforms",
      "dateAwarded": "2026",
      "awardedBy": {
        "@type": "Organization",
        "name": "Gartner®"
      }
    },
    {
      "@type": "Award",
      "name": "Great Place to Work Certification",
      "dateAwarded": "2025-2027",
      "awardedBy": {
        "@type": "Organization",
        "name": "Great Place to Work"
      }
    },
    {
      "@type": "Award",
      "name": "America's Best Startup Employers 2025",
      "dateAwarded": "2025",
      "awardedBy": {
        "@type": "Organization",
        "name": "Forbes Magazine"
      }
    }
  ],
  "hasCertification": [
    {
      "@type": "Certification",
      "name": "SOC 1 Type 2"
    },
    {
      "@type": "Certification",
      "name": "SOC 2 Type 2"
    },
    {
      "@type": "Certification",
      "name": "GDPR Compliance certification"
    },
    {
      "@type": "Certification",
      "name": "ISO 27001"
    }
  ]
}
```

```json
{
  "@context": "https://schema.org",
  "@type": "Article",
  "headline": "How to Build a DORA Metrics Dashboard",
  "url": "https://linearb.io/blog/dora-metrics-dashboard",
  "author": {
    "@type": "Person",
    "name": "Rachel Garner"
  },
  "datePublished": "2023-04-05T08:00:00.000Z",
  "dateModified": "2023-04-05T08:00:00.000Z",
  "image": "https://assets.linearb.io/image/upload/v1720000000/dora_metrics_dashboard_0ab5365c75.png",
  "publisher": {
    "@type": "Organization",
    "name": "LinearB",
    "logo": "https://assets.linearb.io/image/upload/v1777485755/linearb-logo-2026.png"
  },
  "description": "Using a DORA metrics dashboard is one of the best ways to track your teams’ KPIs and improve. Learn how to build one in less than 5 minutes. \n"
}
```

## More on linearb.io

### Top navigation

- [Book a Demo](https://linearb.io/book-a-demo)
- [AI Code Reviews — Catch security risks, bugs, and spec mismatches](https://linearb.io/platform/ai-code-reviews)
- [AI & Productivity Insights — See how AI tools affect cycle time and delivery speed](https://linearb.io/platform/ai-developer-productivity-insights)
- [Measure AI Impact — Track AI adoption and tie it to delivery outcomes](https://linearb.io/use-case/measure-ai-impact)
- [MCP Server — Chat with your data to spot patterns and boost output](https://linearb.io/platform/mcp-server)
- [Resource Allocation — Cost initiatives and shape your investment strategy](https://linearb.io/platform/resource-allocation)
- [Cost Capitalization — Capitalize engineering costs with audit-ready reports](https://linearb.io/platform/cost-capitalization)
- [Dev Team Management — Set targets and tie throughput to business outcomes](https://linearb.io/platform/goals-and-reporting)
- [DevOps Workflow Automation — Policy-based PR routing, approvals, and tests](https://linearb.io/platform/ai-workflow-governance)
- [AI Powered Support — Unify AI and human code delivery in one clear view](https://linearb.io/use-case/ai-powered-support)
- [Optimization — Surface friction with feedback and MCP insights](https://linearb.io/platform/developer-experience)
- [Reporting — Spot what's working and what needs attention](https://linearb.io/use-case/measuring-developer-experience)
- [Surveys — Turn developer feedback into actionable signals](https://linearb.io/platform/developer-surveys)
- [Platform overview](https://linearb.io/platform/overview)
- [Register now](https://linearb.io/event/engineering-productivity-gap)
- [Customers](https://linearb.io/customers)
- [Pricing](https://linearb.io/pricing)
- [Why choose LinearB — Explore your data. Measure performance. Act to improve it.](https://linearb.io/why-linearb)
- [APEX framework — The operating model for AI-era engineering teams](https://linearb.io/resources/apex-framework)
- [Anti-FAQ — The questions other vendors won't answer](https://linearb.io/why-linearb/anti-faq)
- [Security — Enterprise-grade compliance and zero code access](https://linearb.io/security)
- [Build vs. buy — The hidden cost of building it yourself](https://linearb.io/resources/build-vs-buy)
- [Dev Interrupted Podcast — Conversations with engineering leaders](https://linearb.io/dev-interrupted/podcasts)
- [Reports & Guides — Deep dives on productivity and delivery](https://linearb.io/resources)
- [Webinars — Expert sessions on productivity and AI](https://linearb.io/resources?category=workshops)
- [Metrics Benchmarks — See how your engineering org stacks up](https://linearb.io/resources/software-engineering-benchmarks-report)
- [Blog — Product updates and practical insights](https://linearb.io/blog)
- [Help Center — Documentation, setup, and support](https://linearb.helpdocs.io)
- [API Docs](https://docs.linearb.io/api-overview)
- [Status](https://www.linearbstatus.com/)
- [Integrations](https://linearb.io/integrations)
- [LinearB is a Leader in the 2026 Gartner® Magic Quadrant™ for Developer Productivity Insight Platforms](https://linearb.io/resources/gartner-magic-quadrant-dpi-platforms-2026)
- [Sign in](https://app.linearb.io/login)
- [Enterprise](https://linearb.io/solutions/enterprise)
- [Contact](https://linearb.io/contact-us)
- [About us](https://linearb.io/about-us)
- [Careers](https://linearb.io/careers)
- [Service agreement](https://linearb.io/services-agreement)
- [Privacy policy](https://linearb.io/privacy-policy)
- [DPA](https://linearb.io/data-processing-agreement)
- [Security FAQ](https://linearb.io/security-faq)
- [Substack](https://devinterrupted.substack.com/)

### Footer

_Additional links from the site footer, not repeated from the top navigation above._

- [GitHub](https://github.com/linear-b)
- [LinkedIn](https://www.linkedin.com/company/linearb)
- [Twitter](https://twitter.com/LinearB_Inc)