

When I talk about what the four Accelerate metrics are and why they matter, I like to use a metaphor that involves something most of us can agree on: Pizza.
Have you ever ordered a pizza? Ideally, you’d want that pizza delivered on time, and you’d also want it to have the right level of crustiness, the correct amount of toppings, and above all, you’d want it to taste great.
A bad pizza that arrives on time will lead to an unhappy customer, the same as a good pizza that’s late. Basically, quick delivery and good quality equal a happy customer and a five-star rating.
Quick delivery and high-quality code are the two main goals of software engineers. Software engineers use metrics to track progress and find areas that need improvement.
Engineering teams have lots of metrics available to them, and they’re all important, but some are a bit more crucial than others. Choosing the right set of metrics to measure helps ensure success.
In this post, you’ll learn about four key metrics covered in the book Accelerate: The Science of Lean Software and DevOps: Building and Scaling High Performing Technology Organizations.

Accelerate Metrics
Accelerate's authors are Dr. Nicole Forsgren, Jez Humble, and Gene Kim. They aimed to figure out what made high-performing teams different from low-performing teams.
They analyzed 23,000 data points from companies all around the world. The companies ranged from startups to major enterprises, including for-profit and nonprofit organizations. They also included digital companies and companies that transformed from brick-and-mortar to digital. This research summarized years of State of DevOps Reports.
Their study uncovered four key metrics that serve as strong performance indicators of teams with high rates of sales, customer satisfaction, and efficiency. They call these metrics the Accelerate metrics, (also known as DORA metrics) and they include:
Let’s examine each one in turn.
Lead Time for Changes
Lead time for changes indicates how long it takes for code to move from the development phase to being ready for deployment. In other words, how long it takes to make code changes or new features ready for delivery, including passing all the necessary checks.
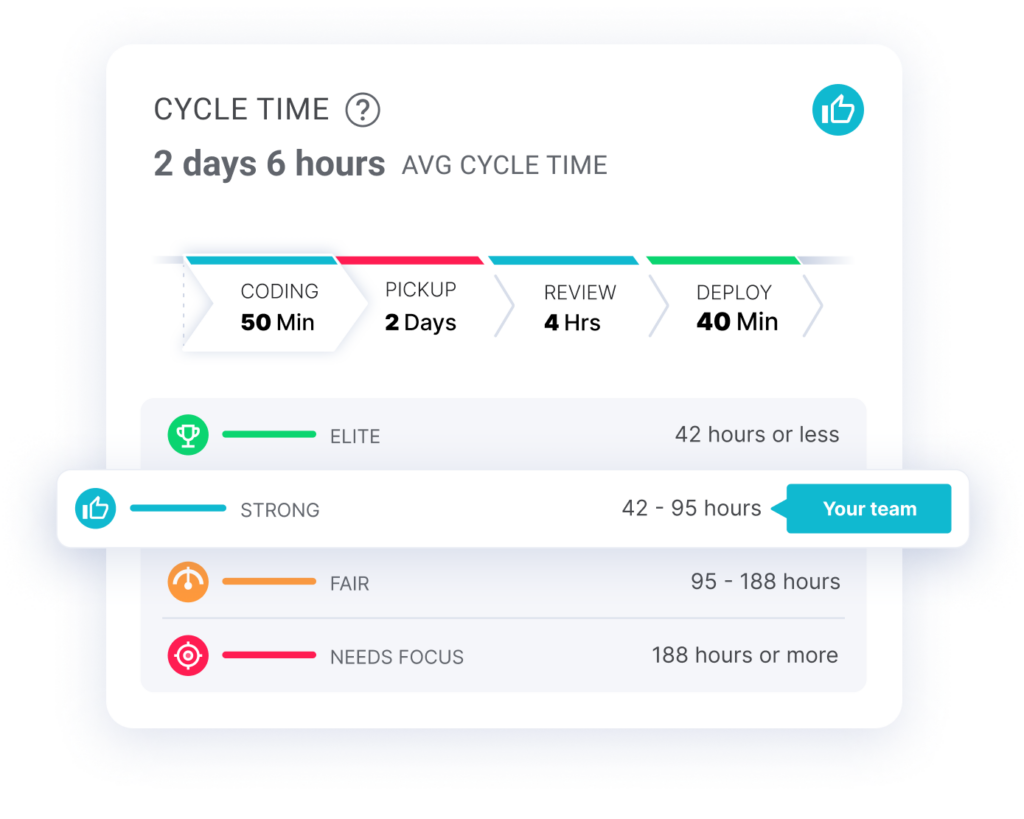
This metric is often measured alongside cycle time, which tracks speed and agility and can be broken into four phases.
- Coding Time
- Pull Request Pickup Time
- Pull Request Review Time
- Deploy Time
To help us understand the difference between lead time and cycle time, let’s go back to the pizza delivery scenario. Cycle time spans the time taken to prepare the dough, add the toppings, bake it in the oven, carry out a quality check, package the pizza, and then deliver the pizza. Change lead time includes all that, plus the time it takes for you to place the order for your pizza via phone or app.
Engineers who want to maintain a high level of efficiency look beyond the change lead time and measure cycle time. Shorter cycle times indicate high levels of productivity. Longer cycles times mean there’s too much wasted time and too little time spent delivering value to customers.
How to Improve Change Lead Time and Cycle Time
Research showed that the average cycle time for the dev teams was 6 days and 5 hours, but elite scrum teams have a cycle time of less than 48 hours.
Here are some ways to improve this metric, and it turn, improve change lead time:
- Keep PR Size under 200 changes to reduce review time.
- Use our WorkerB bot to notify your code reviewers when PRs are created.
- Use our WorkerB bot to catch PRs that fall through the cracks and remind the team they’ve been waiting.

Deployment Frequency
Deployment frequency means how often teams deploy new code to production, and it gives insight into the speed and agility of an engineering team.
This metric measures how much value gets to the customer. New code can include new features, updates, or bug fixes; basically, any new additions or replacements.
High-performing teams can make multiple deployments daily and can do so on-demand. Teams should be concerned when the space between deployments extends for months.
How to Improve Deployment Frequency
As already established, high-performing teams aim to make frequent deployments and deliver high-quality code. Here are some ways to ensure this happens.
- Automate the production process. Have a continuous integration (CI) and delivery (CD) pipeline in place that automates testing, deployment, and monitoring.
- Make small changes. Reducing deployment size will reduce the overall risk of failure. Teams can find bugs more quickly in smaller deployments.
Mean Time to Restore(MTTR)
MTTR is the average time it takes an engineering team to recover from incidents that lead to failure. It reflects how much time the team spends fixing problems.
We measure this metric by dividing the total amount of time a system is out of service by the total number of incidents. So if downtime totaled 30 hours from five incidents, the MTTR is 6 hours.
How to Improve MTTR
MTTR shouldn’t exceed one day and teams should strive to make it as short as possible. High-performing teams can recover within hours. Too much downtime leads to low productivity and loss of revenue. Here are some tips to improve MTTR:
- The developer environment must be ready at all times. Have the right tools, processes, and permissions in place to handle incidents as soon as they happen.
- Maintain the same team from development to deployment. They know the history of the code, and are in the best position to understand what exactly caused a failure.
- Build automated CI/CD systems. Use feature flags to isolate changes that lead to failure.
- Again, make small changes at fixed intervals.
Change Failure Rate
The change failure rate indicates the percentage of code changes that lead to failure. You calculate it by counting the number of failed deployments and dividing by the total number of deployments. This metric gives insight into the reliability of a team.
From the previous example, if those five incidents were from a pool of 20 deployments, the change failure rate would be 25%.
How to Improve Change Failure Rate
Elite and high-performing teams have change failure rates of 0%–15%. You want to keep this rate as low as possible. Here are some ways to minimize the change failure rate.
- At the risk of sounding like a broken record, deploy in smaller sizes. You don’t need to be searching for a bug in large, week-old commits.
- Teams should define what failure means to them.
- The same team should handle both development and deployment to better understand any failure that occurs.
- Have multiple checks in place to detect failures as soon as they occur.
Importance of the Accelerate Metrics
The authors based the Accelerate book on years of rigorous research and analysis of thousands of companies around the world. Elite and high-performing teams did well across these metrics, which are backed by data found in the annual State of DevOps Reports.
The Accelerate metrics give useful insights into the good, bad and ugly aspects of a team’s software development process. They measure agility and productivity and how often value is delivered to the user. They also track stability and the effectiveness of a team’s incident response process.
LinearB provides your teams with industry-standard metrics, like the DORA metrics, that cut across all key areas of the development pipeline. Get fully customizable public or private dashboards that present data from these metrics in an easily digestible format. You can integrate LinearB into your existing project management systems. Schedule a demo, or get started with our free-forever plan today.
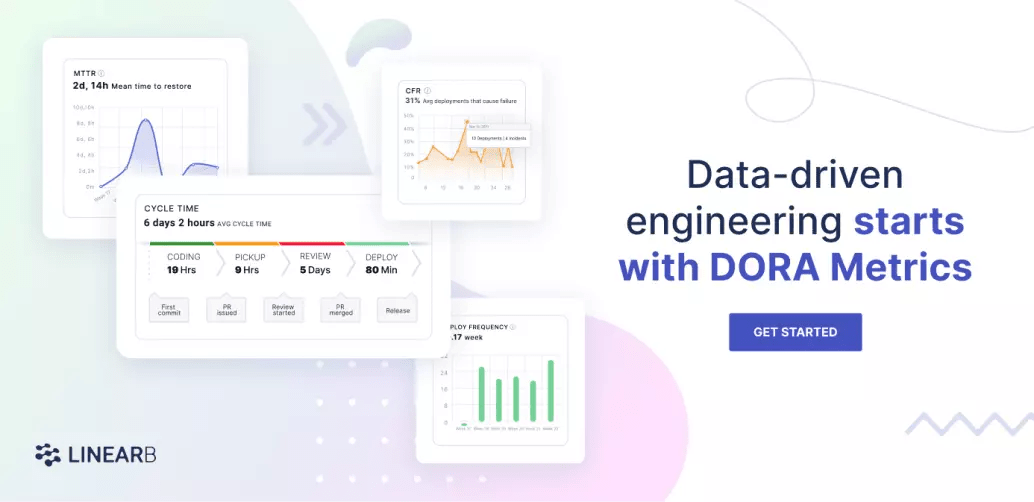 LinearB provides DORA metrics right out of the box so you can discover your DORA metrics in minutes. Get started today!


