Guiding engineering teams without clear data on what they’re all working on is like sailing a ship through a storm. As the captain, you have to navigate precisely and make quick decisions to avoid disaster.
But this isn’t easy without a clear view of what your crew is working on. You need to know if they’re working efficiently, whether they’re encountering any problems, and if they’re following the course correctly.
This is where engineering analytics tools come in. They’ll give you a smog-free view of what everyone is up to, how they’re working together, and any issues they may be facing. Equipped with this data, you can guide your teams and ensure you’re on the right path.
This article will cover engineering analytics, what to look for in an engineering analytics tool, and our top picks. Let’s dive right in.
Table of Contents
- What Is Engineering Analytics?
- What to Look for in an Engineering Analytics Solution
- Top 5 Engineering Analytics Solutions
- How to Improve Your Software Engineering Metrics
What Is Engineering Analytics?
Engineering analytics involves using data science to keep track of all the coding work in a software project and engineering org. This enables you to stay on top of everything that happens to your codebase like pull requests, merges, and who made which changes and when.
With software engineering analytics, you get a top-level view of how things are progressing with your software projects. But to collect accurate data on your engineering processes, you need software engineering analytics tools. They’ll provide crucial data on and insights into your organization. These tools are an invaluable resource to help you see how your projects are progressing and identify any bottlenecks.
These tools correlate data between Git providers and project management tools to help you make decisions. They’ll also highlight important trends, data, and key performance indicators. And finally, engineering analytics solutions help centralize teams’ past progress in one spot. They provide reports by iteration or quarter, so you can evaluate where things stand and what you need to do to move forward.
What to Look for in an Engineering Analytics Solution
If you’re already in the eye of the storm, you need a tool that can help you take your teams to softer seas. To help you get there faster, we’ve rounded up three must-have features you should look for in a software engineering analytics tool:
- Key metrics: If you really want to gain actionable insights into your teams’ work, your engineering analytics tool should focus on the right metrics.
- User-friendliness: Your engineering analytics tool should make your life easier, not harder. Ensure you choose a tool that’s easy to use and intuitive, so you can actually understand the data it gives you.
- Visibility into roadblocks: The tool you choose should give you insight into current and potential obstacles so you can help clear them and get your teams back on track.
Pro Tip: Choose a tool that will show you outcome-based metrics. That’s how you see where your teams are struggling and make an impact. Here’s how Kathryn Coehler, Netflix Director of Productivity, puts it:
Top 5 Engineering Analytics Solutions
Our top five engineering analytics tools offer good metrics, are user-friendly, and give you visibility into roadblocks. With the help of these tools, you can navigate your teams from port to port safely.
1. SonarQube
Available for free, SonarQube inspects several parts of your software to find bugs and ensure your teams consistently deliver clean code. It also:
- Allows you to monitor your teams’ day-to-day progress with multiple dashboards
- Informs you of changes to libraries, packages, and the data warehouse that may introduce security vulnerabilities
- Has fail pipelines to prevent problems from being deployed
With its focus on code quality, SonarQube helps guide development teams and safeguards your products against security vulnerabilities that otherwise might slip through the cracks.
2. ZenHub
ZenHub’s agile automation tool integrates with GitHub and provides insights and transparency to help measure your teams’ productivity. It also:
- Tracks key metrics like the number of pending pull requests, number of projects, and number of critical issues
- Provides you with multiple boards to view your priorities, issues, and work in progress at a glance
- Features real-time reports that give you data on various aspects of your project to help your teams ship faster software
Thanks to its GitHub integration, you can use ZenHub to better understand the stumbling blocks involving your code, so you know where and how to get involved.
3. Hatica
Hatica gives your teams the insights and workflows they need to perform at their peak while also promoting well-being. It also:
- Consolidates information from Git, projects, and collaborations, so you have visibility into your teams’ development processes
- Features metrics for gauging DevOps performance like lead time, change failure rate, deployment frequency, and mean time to recover
- Integrates with Git and CI/CD systems, so you can view all your project’s activities and data analytics in one convenient location
Hatica gives you a comprehensive view of what your teams’ are working on so you can base your business decisions on a full, accurate picture.
4. LinearB
LinearB focuses on improving your org’s efficiency and productivity overall by providing you with key metrics and high-quality data about your entire workflow. It also:
- Features the LinearB Pulse board, which syncs your Git branches and PRs to the relevant project stories to give you real-time updates in a single view
- Provides Project Delivery Tracker, so you can communicate project delivery status updates with confidence using planning accuracy and delivery reports
- Includes a Resource Allocation dashboard, so you can see where your teams’ time is going and ensure they’re working on the most important business initiatives
- Offers Engineering Benchmarks, so you can keep up with (and even exceed) the industry standard
LinearB equips you with all the data you could possibly need to ensure your teams’ work always align with your business goals. At the same time, the platform helps your teams finish projects more quickly while still achieving consistently high quality.
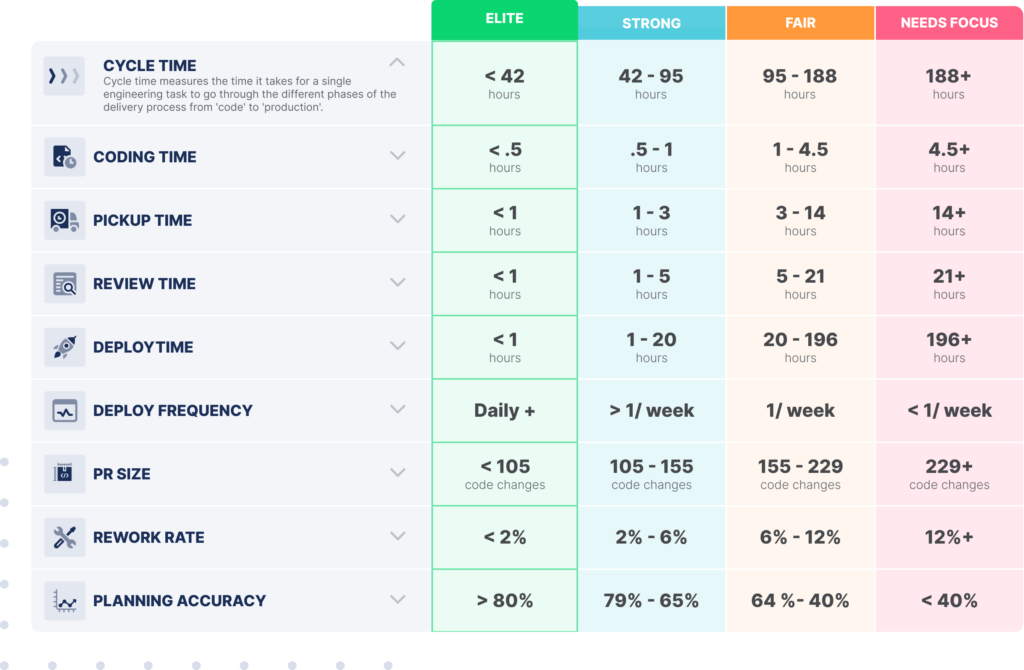 Want to learn more about being an elite engineering team? Check out this blog detailing our engineering benchmarks study and methodology.
5. Stackin
Stackin gives you actionable insights into how you can improve team alignment, communication, and efficiency. It also:
- Seamlessly integrates with applications, extensions, and services, making it ideal for automating engineering processes
- Gathers data from previous software development cycles to help you make business decisions going forward
- Helps you discover and eliminate roadblocks to minimizing delays and keep tabs on project goals
With Stackin, you’ll be able to keep your org lean and effective with data-driven insights into your teams’ work patterns and progress over time.
How to Improve Your Software Engineering Metrics
Engineering analytics solutions can be your lighthouse. They can give you key insights into what your teams are working on and how the work is going. With this data, you’ll be equipped to clear out bottlenecks and make the best business decisions for your org.
But metrics alone don’t improve dev teams.
LinearB helps you leverage powerful data to visualize your processes and know where and how you need to improve. And this will help you boost your overall engineering efficiency and productivity. LinearB also allows you to compare yourself to other elite orgs, so you can continue competing with the best of the best.
Plus, with Team Goals and our WorkerB bot, you can set goals for your teams to achieve (based on the Engineering Benchmarks) and automate improvement. On top of automating loads of manual tasks, WorkerB can alert your team when they’re nearing or have crossed customizable thresholds to keep you on track with your goals. And with the Team Goals dashboard, you can track your teams’ progress and celebrate their wins.
Whether it’s increased efficiency, productivity, or return on investment (ROI) you’re after, you can achieve, and even exceed, your business goals by putting engineering analytics tools like LinearB to work in your data pipeline.
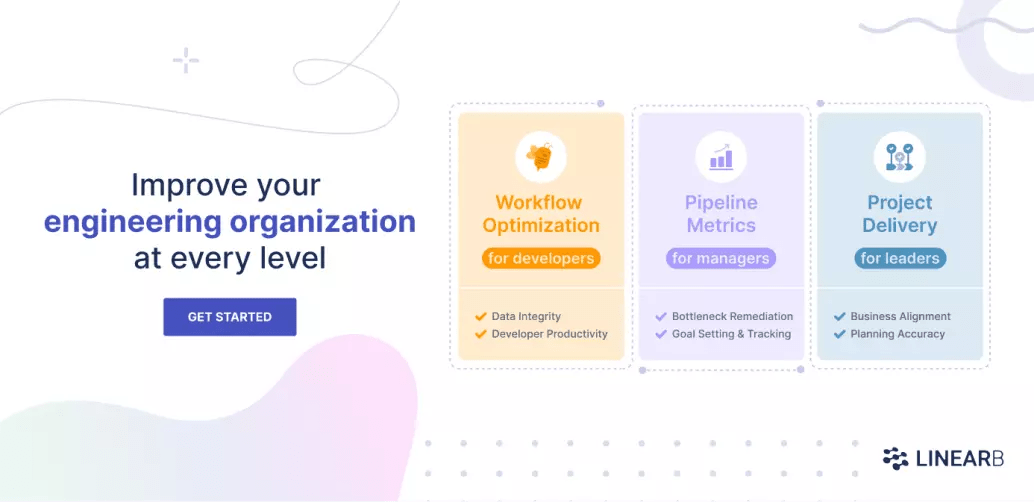 Want to improve your engineering processes at every level? Get started with a LinearB free-forever account today!