A high-performing software engineering team is integral for businesses to deliver value. Understanding and improving engineering performance starts with a well-structured engineering metrics program. With the insights provided by implementing an engineering metrics program, you can deliver high-quality work efficiently and align your work with business goals.
Understanding Engineering Metrics
Engineering metrics are quantitative measures of engineering team performance and health. When used correctly, you can leverage engineering metrics to find improvement opportunities, track progress, and demonstrate value to stakeholders. The key metrics to focus on are lagging indicators, which reflect past performance, and leading indicators, which predict future performance.
Lagging Indicators:
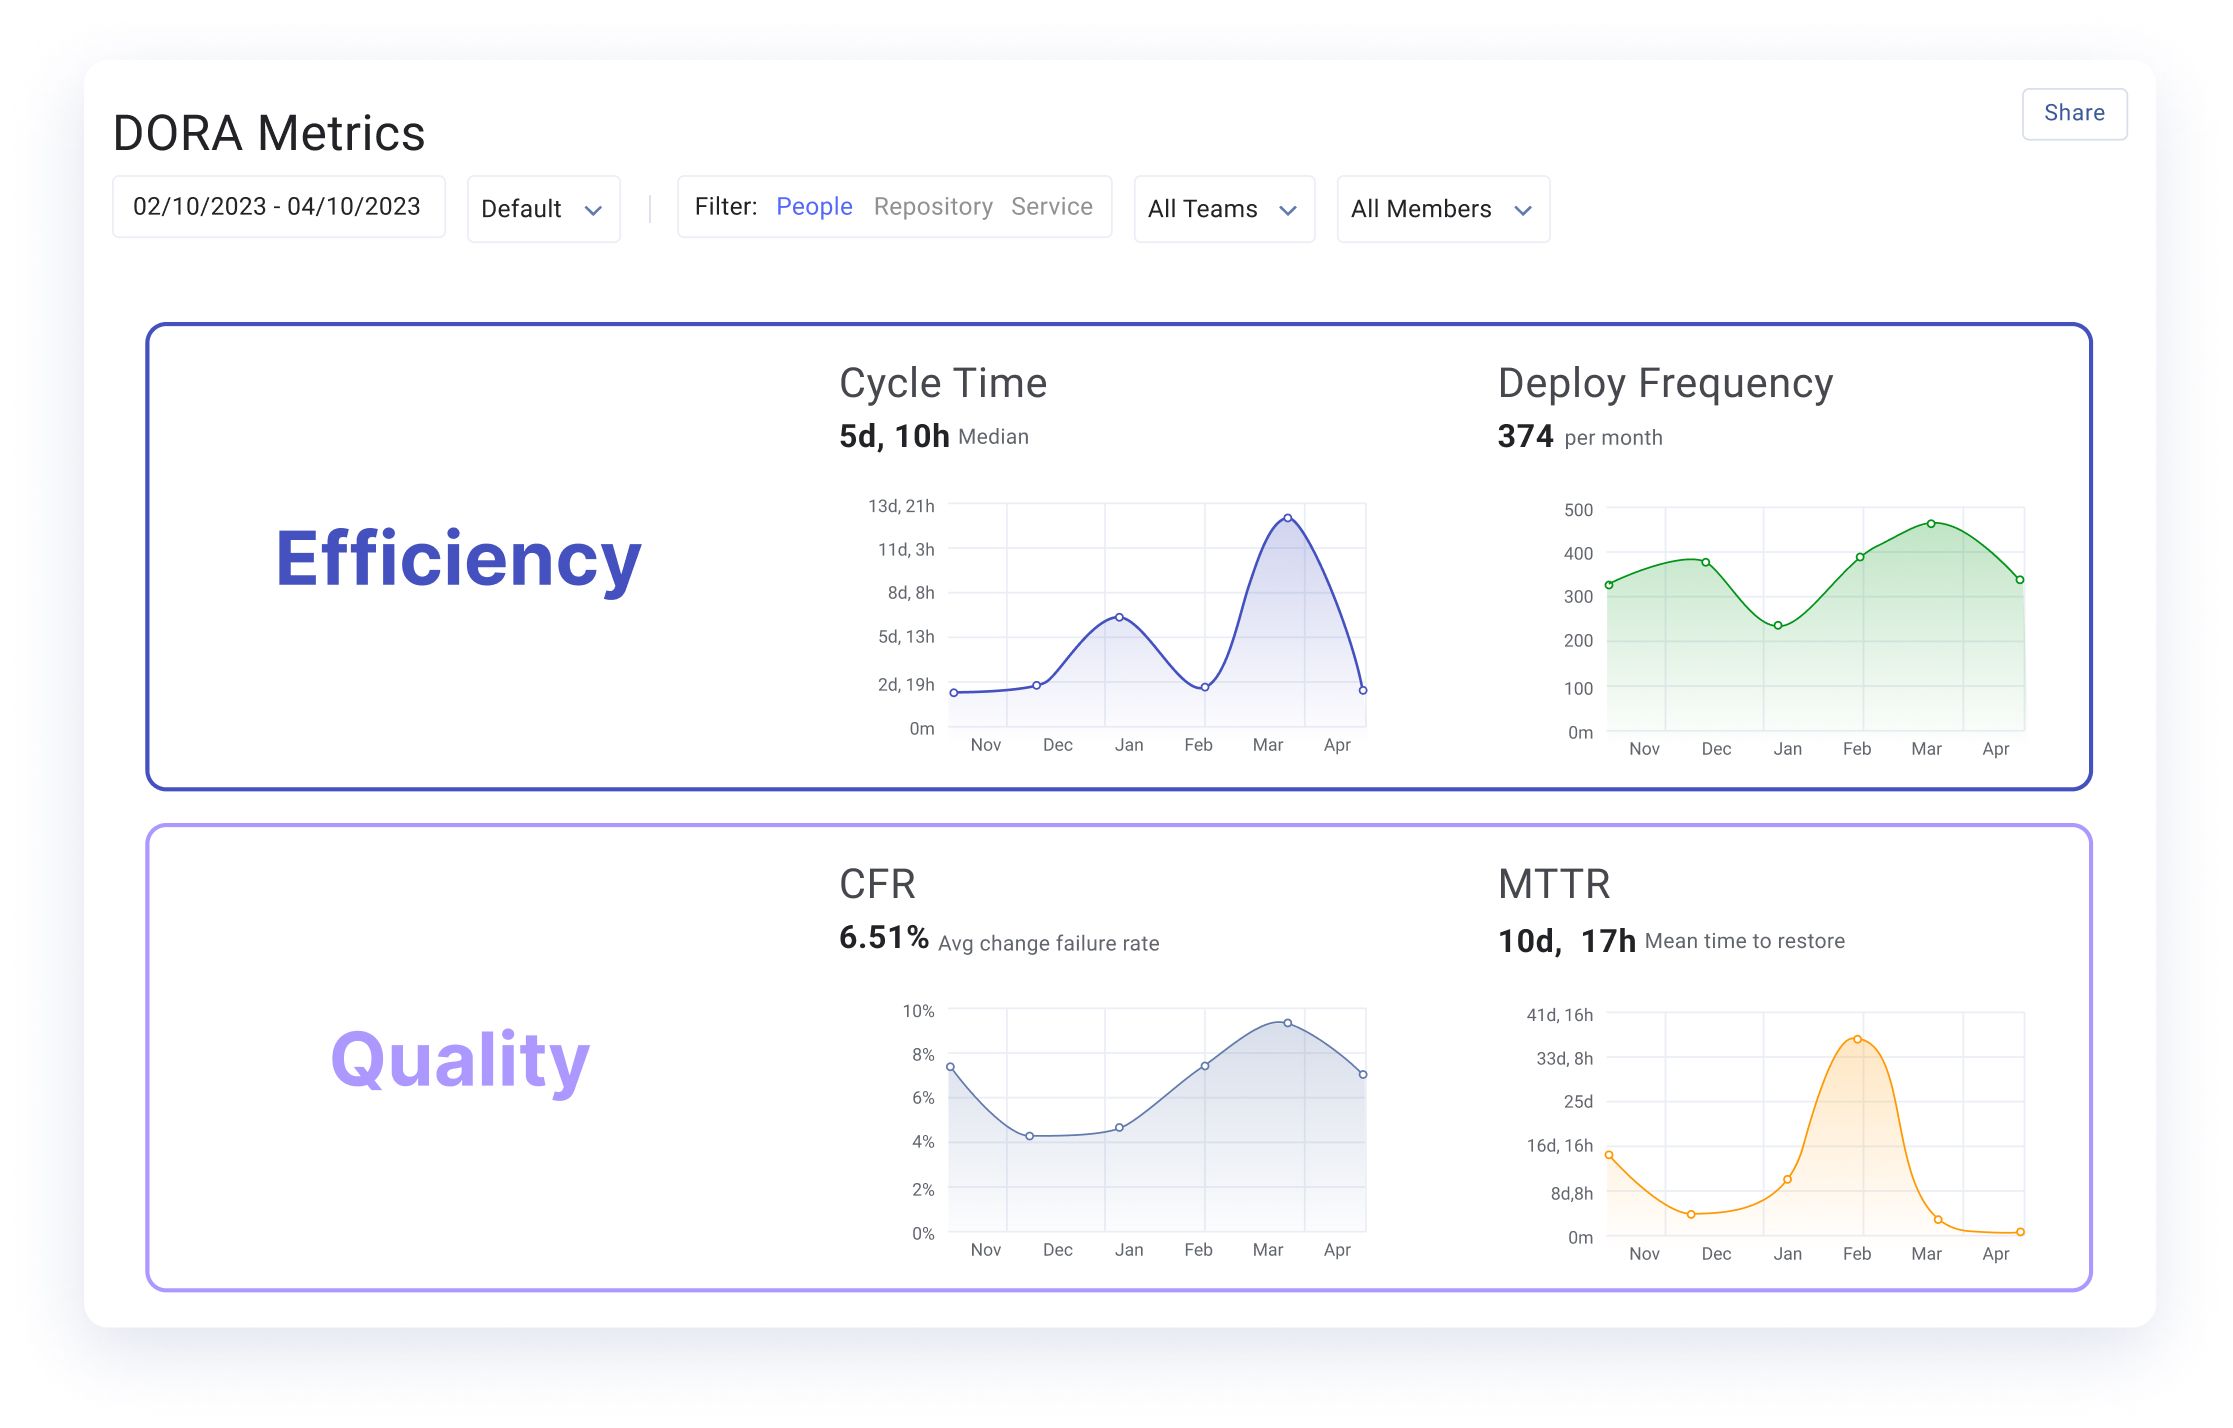
Lagging indicators measure the outcomes of past engineering performance and provide insights into the effectiveness of your processes over time. These metrics are essential for understanding the long-term health and stability of your engineering practices.
- Cycle Time: The time from the first commit to production release, and the related four phases: coding time, pickup time, review time, and deploy time.
- Deployment Frequency: How often you deploy code to production over time.
- Mean Time to Restore (MTTR): The average time it takes to restore from a failure of the system or one of its components
- Change Failure Rate: The percentage of production deployments that cause one or more failures.
Leading Indicators:
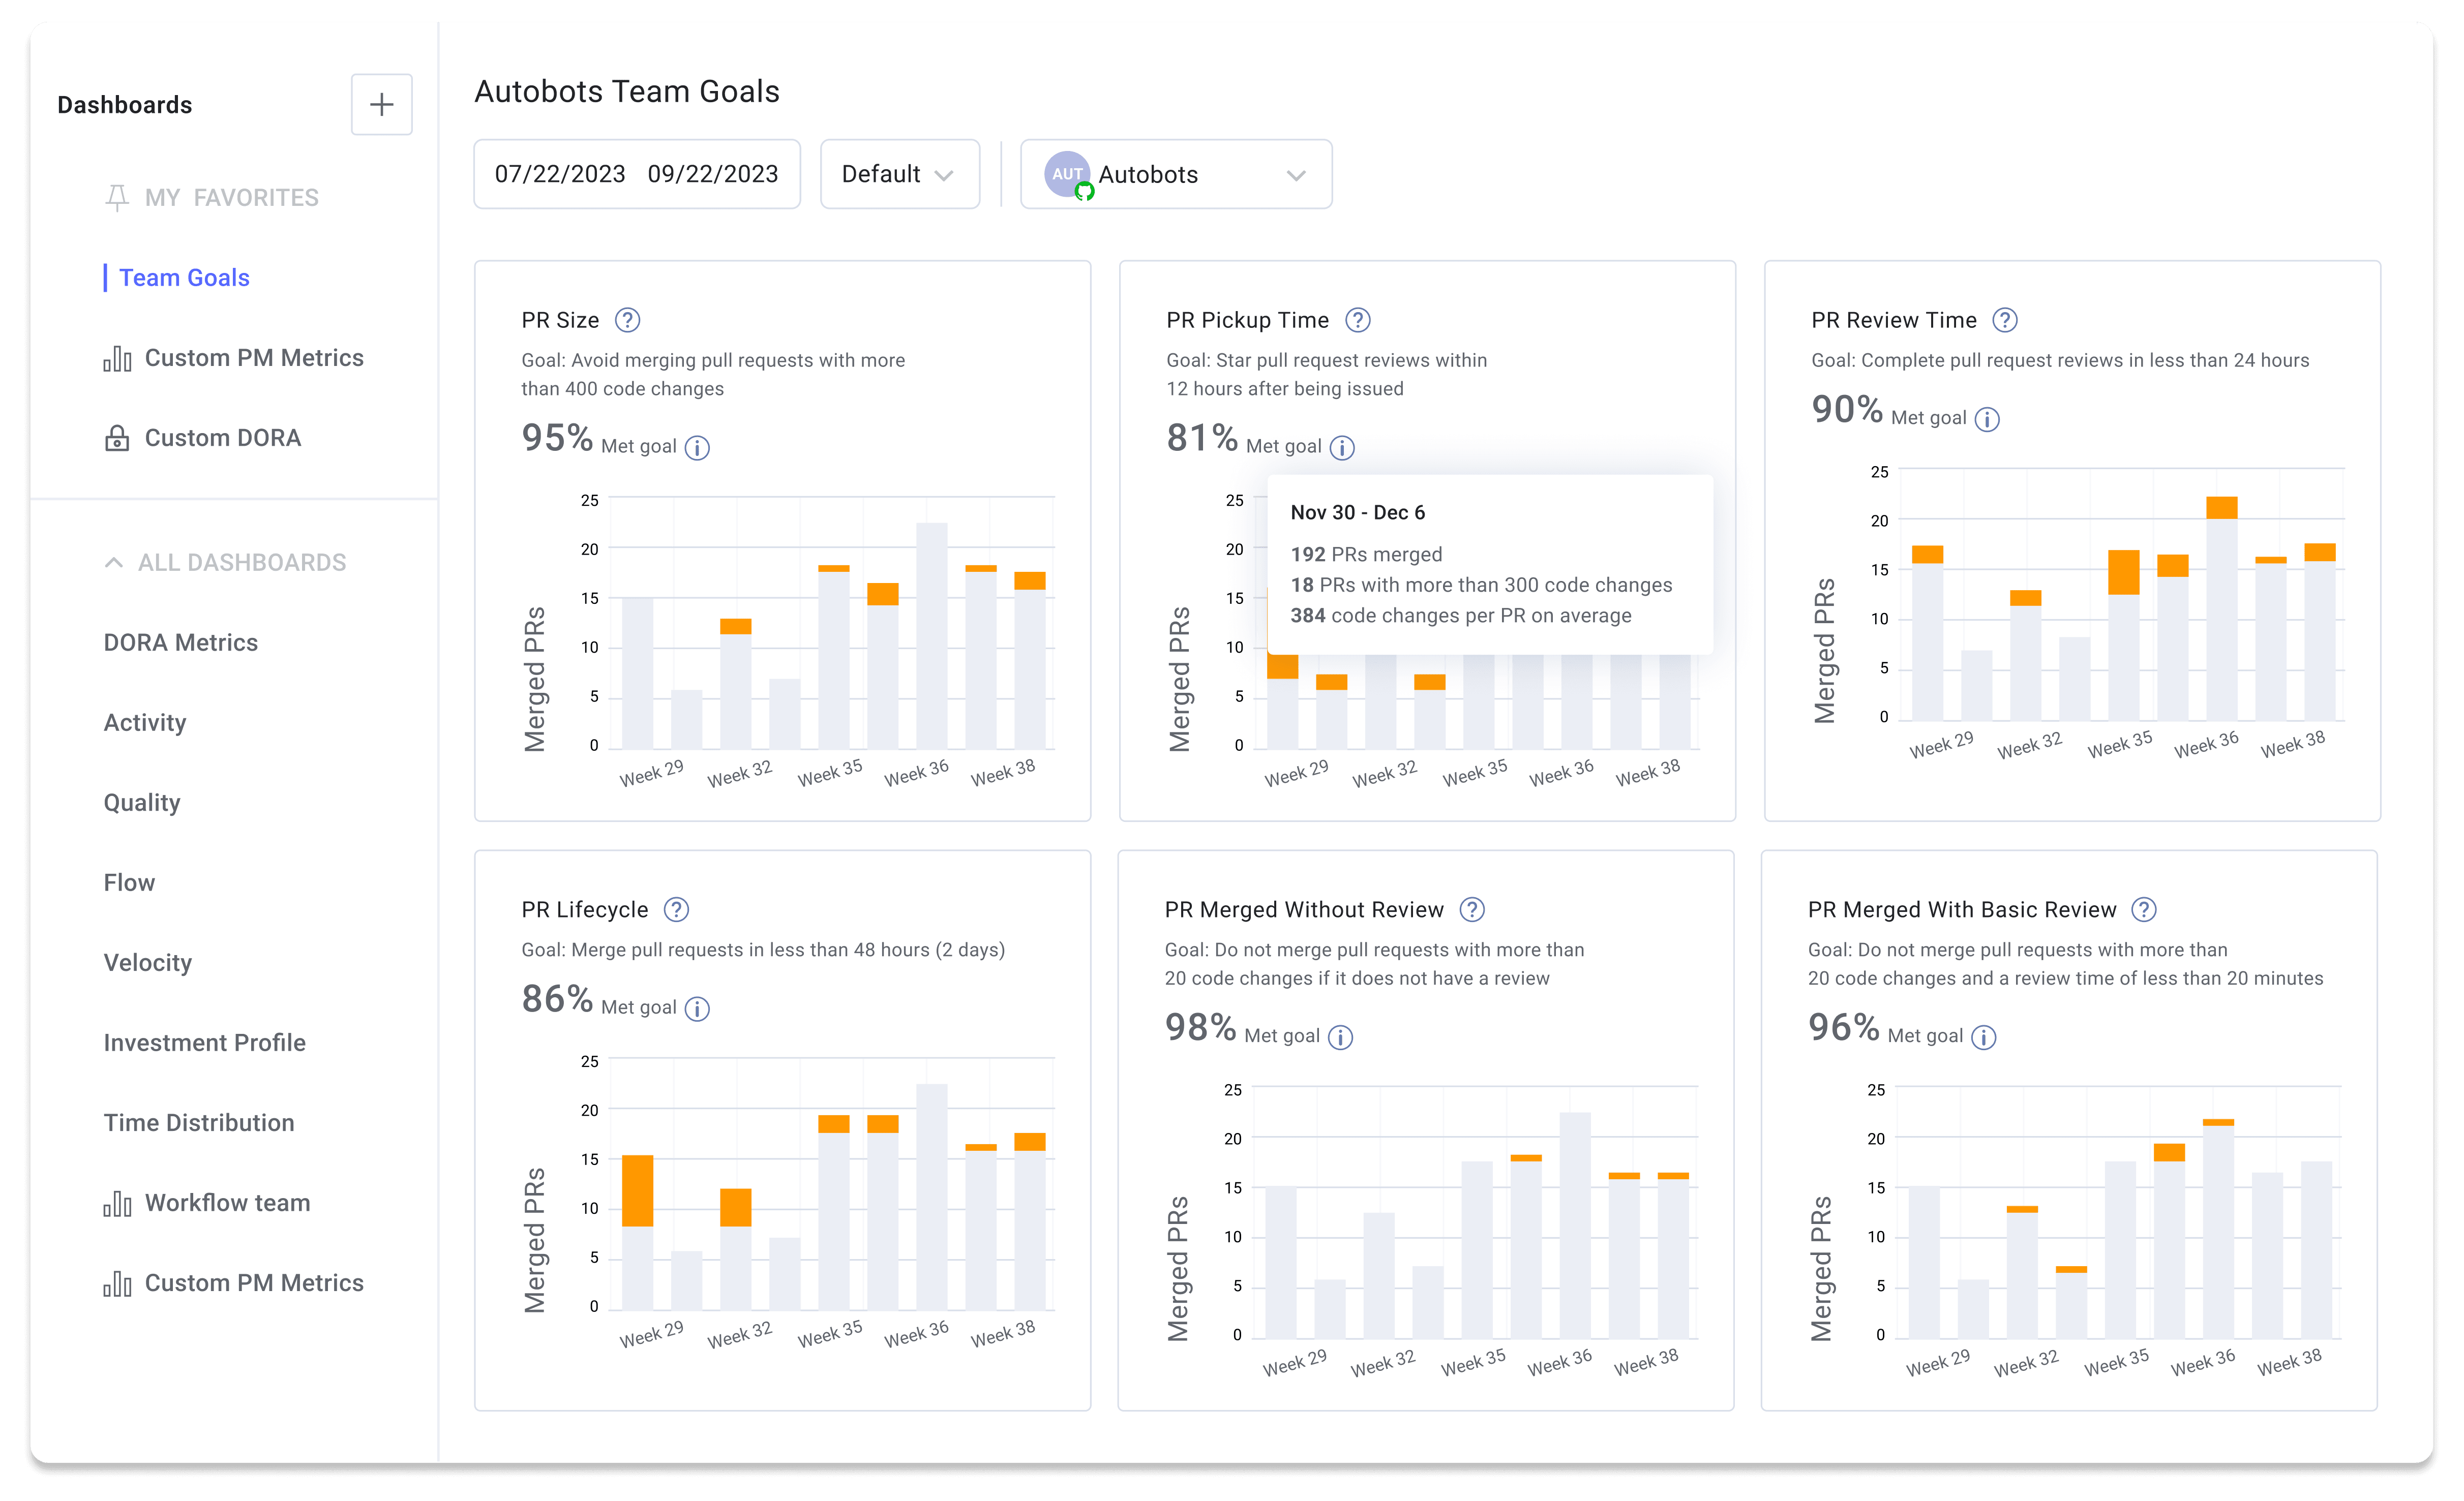
Leading indicators predict future performance and help identify potential issues before they escalate. Monitoring these metrics allows teams to proactively address inefficiencies and improve their processes.
- Pull Request (PR) Size: The number of code lines modified in a pull request.
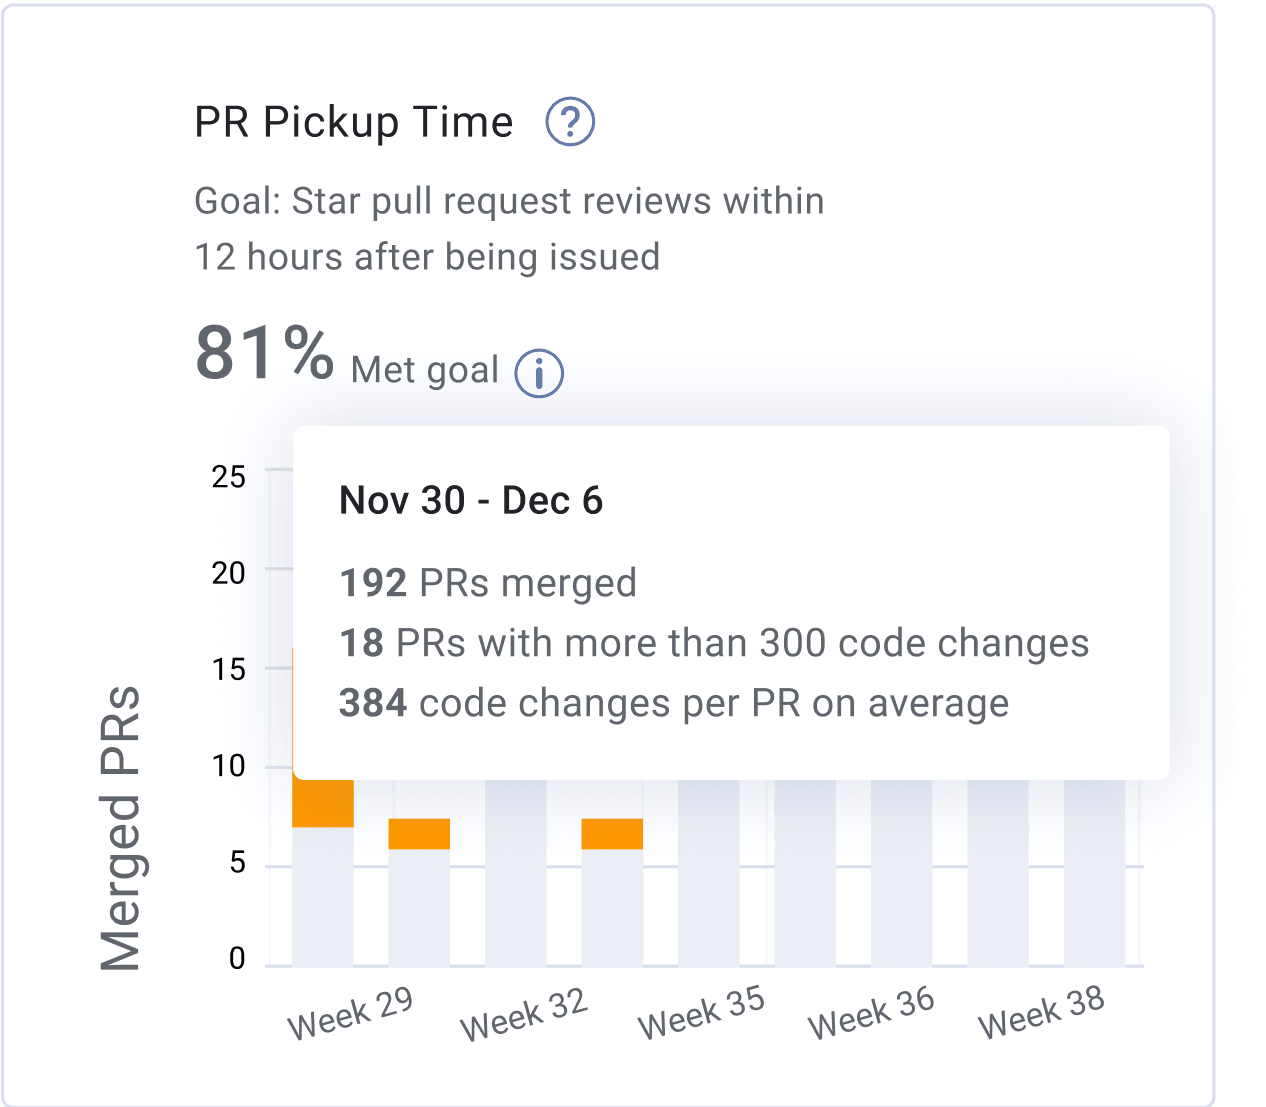
- PR Pickup Time: The time between when someone creates a PR and when a code review has started.
- PR Review Time: The time between the start of a code review and when someone merges the code.
- Rework Rate: The percent of total code that has been reworked over a specified period.
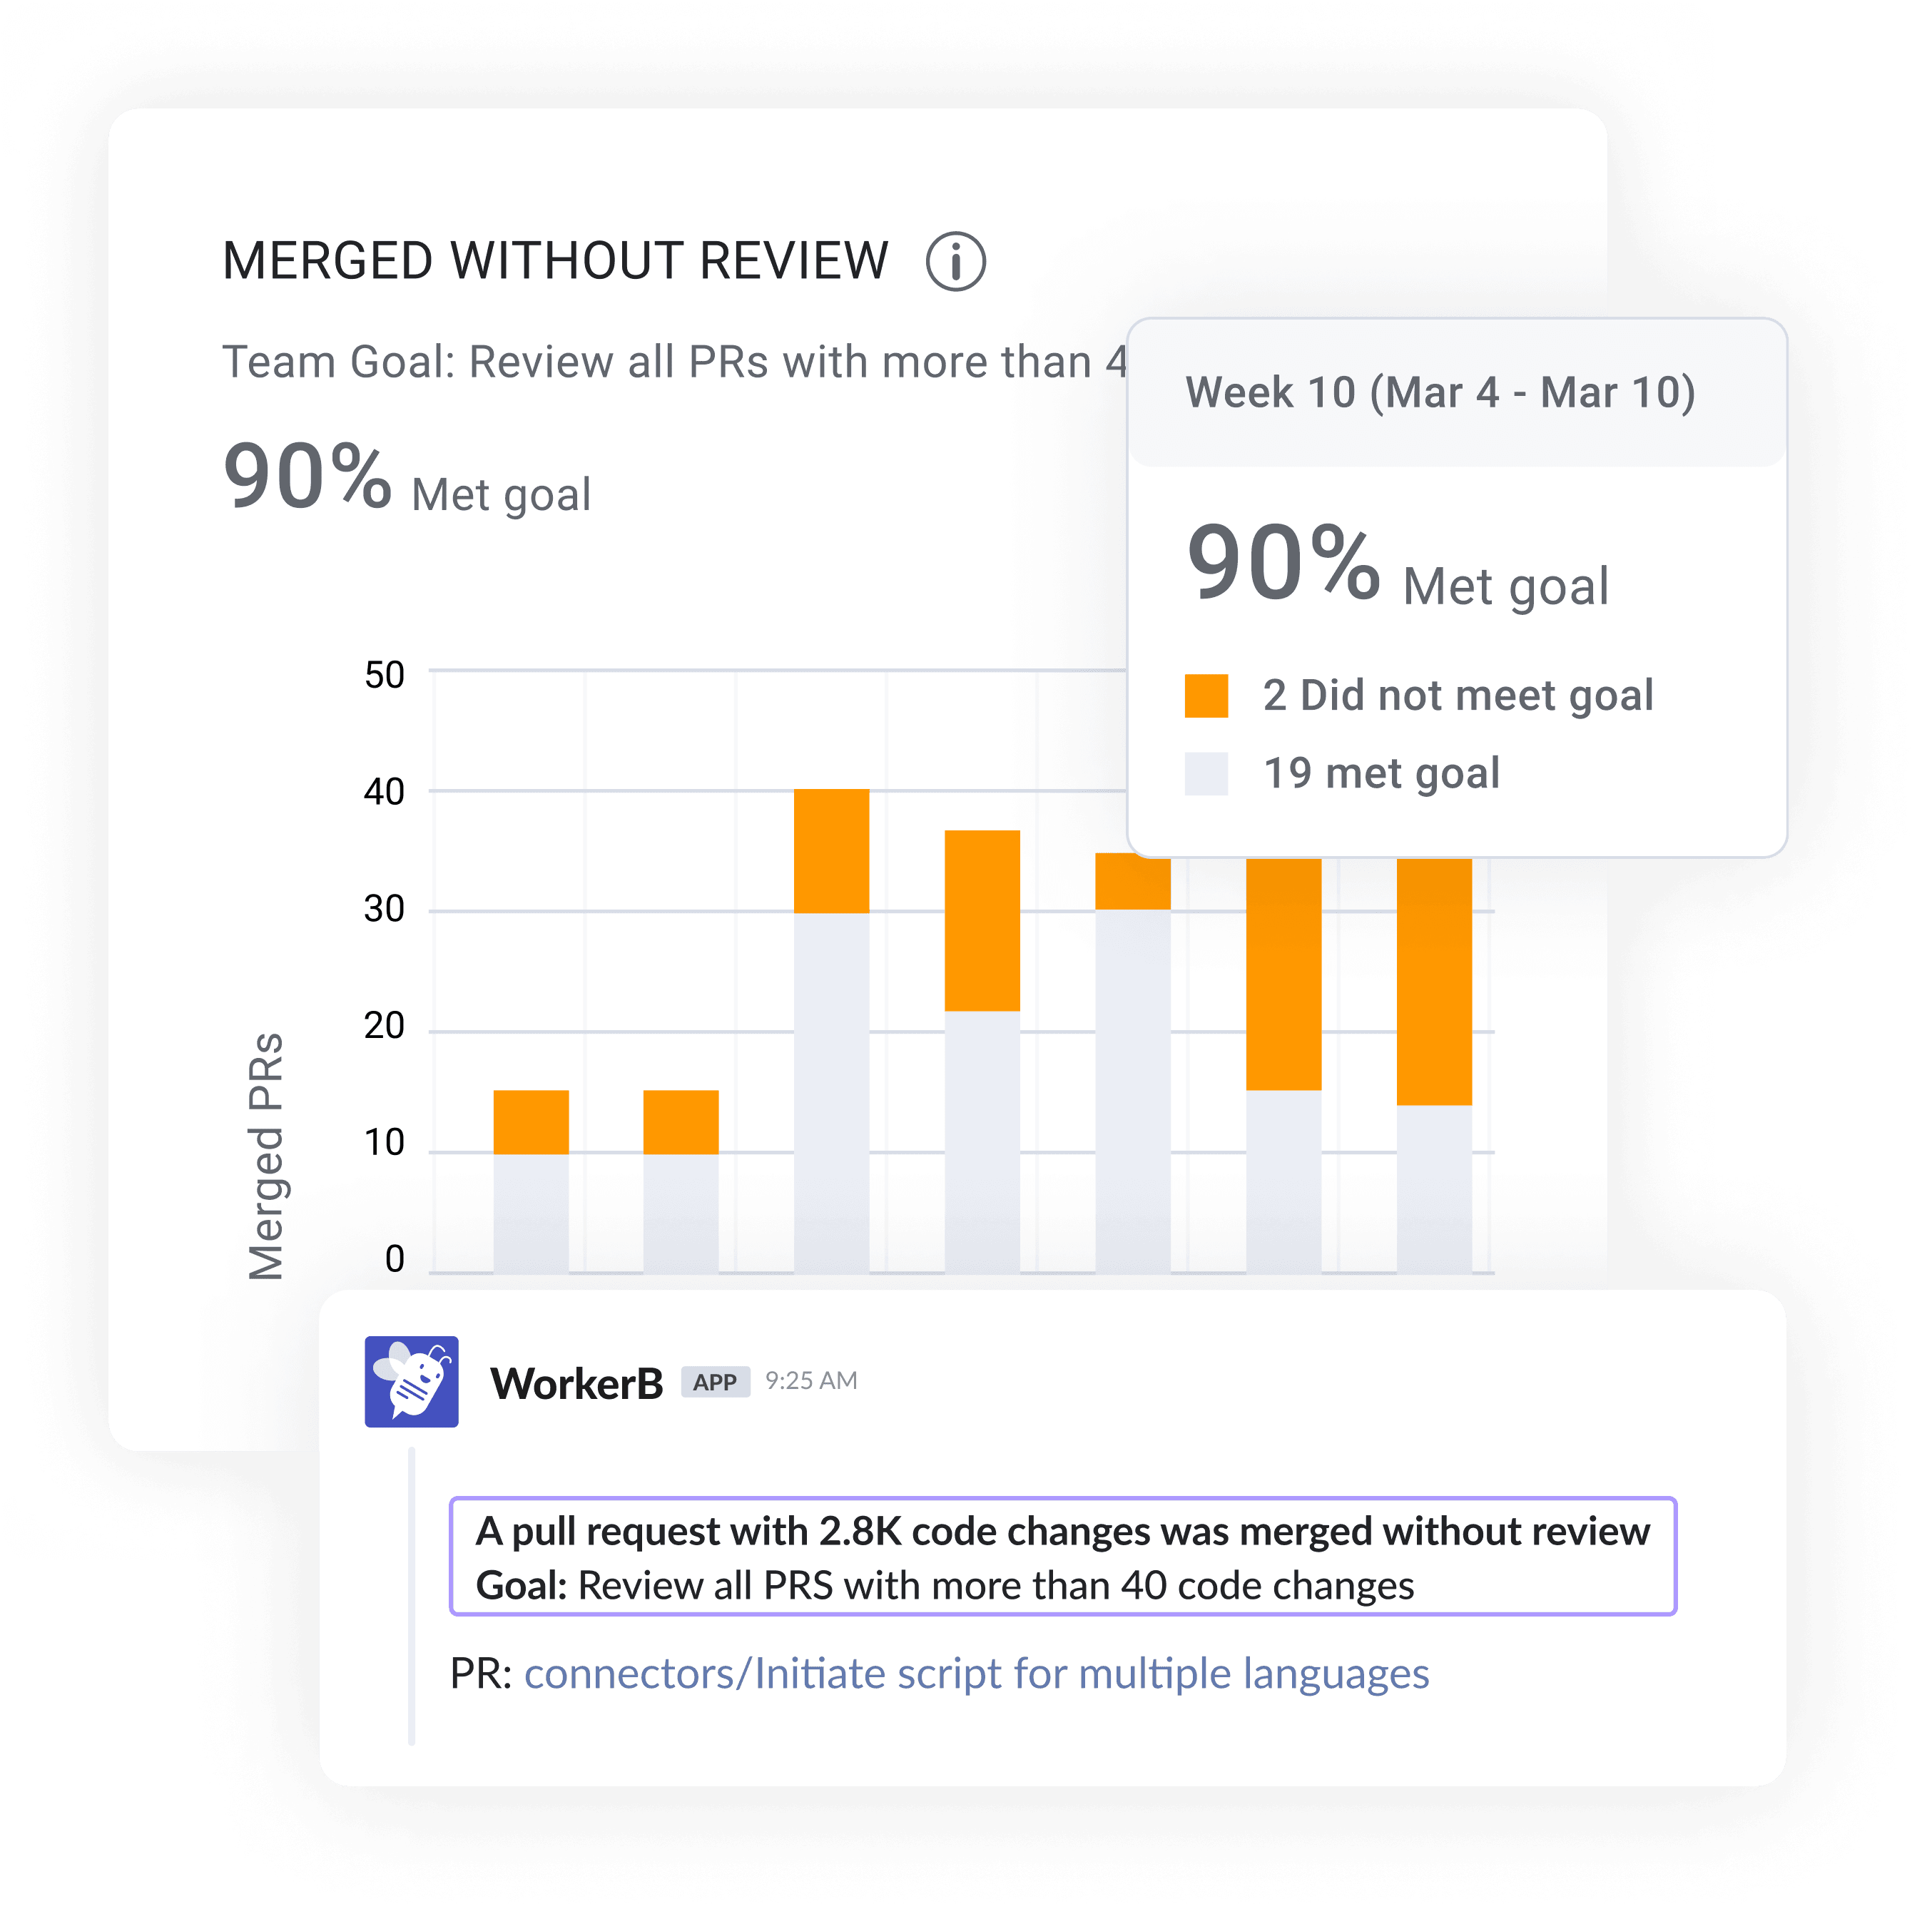
- PRs Merged Without Review: The number of code changes that enter production without peer review.
Setting Up Your Engineering Metrics Program
1. Visibility: The Foundation of an Engineering Metrics Programs
The first step in building your engineering metrics program is achieving visibility into your software development lifecycle (SDLC). Using a Software Engineering Intelligence (SEI) Platform like LinearB, you can aggregate data from various sources such as project management tools, git repositories, and CI/CD pipelines to create a comprehensive view of your engineering processes and outcomes.
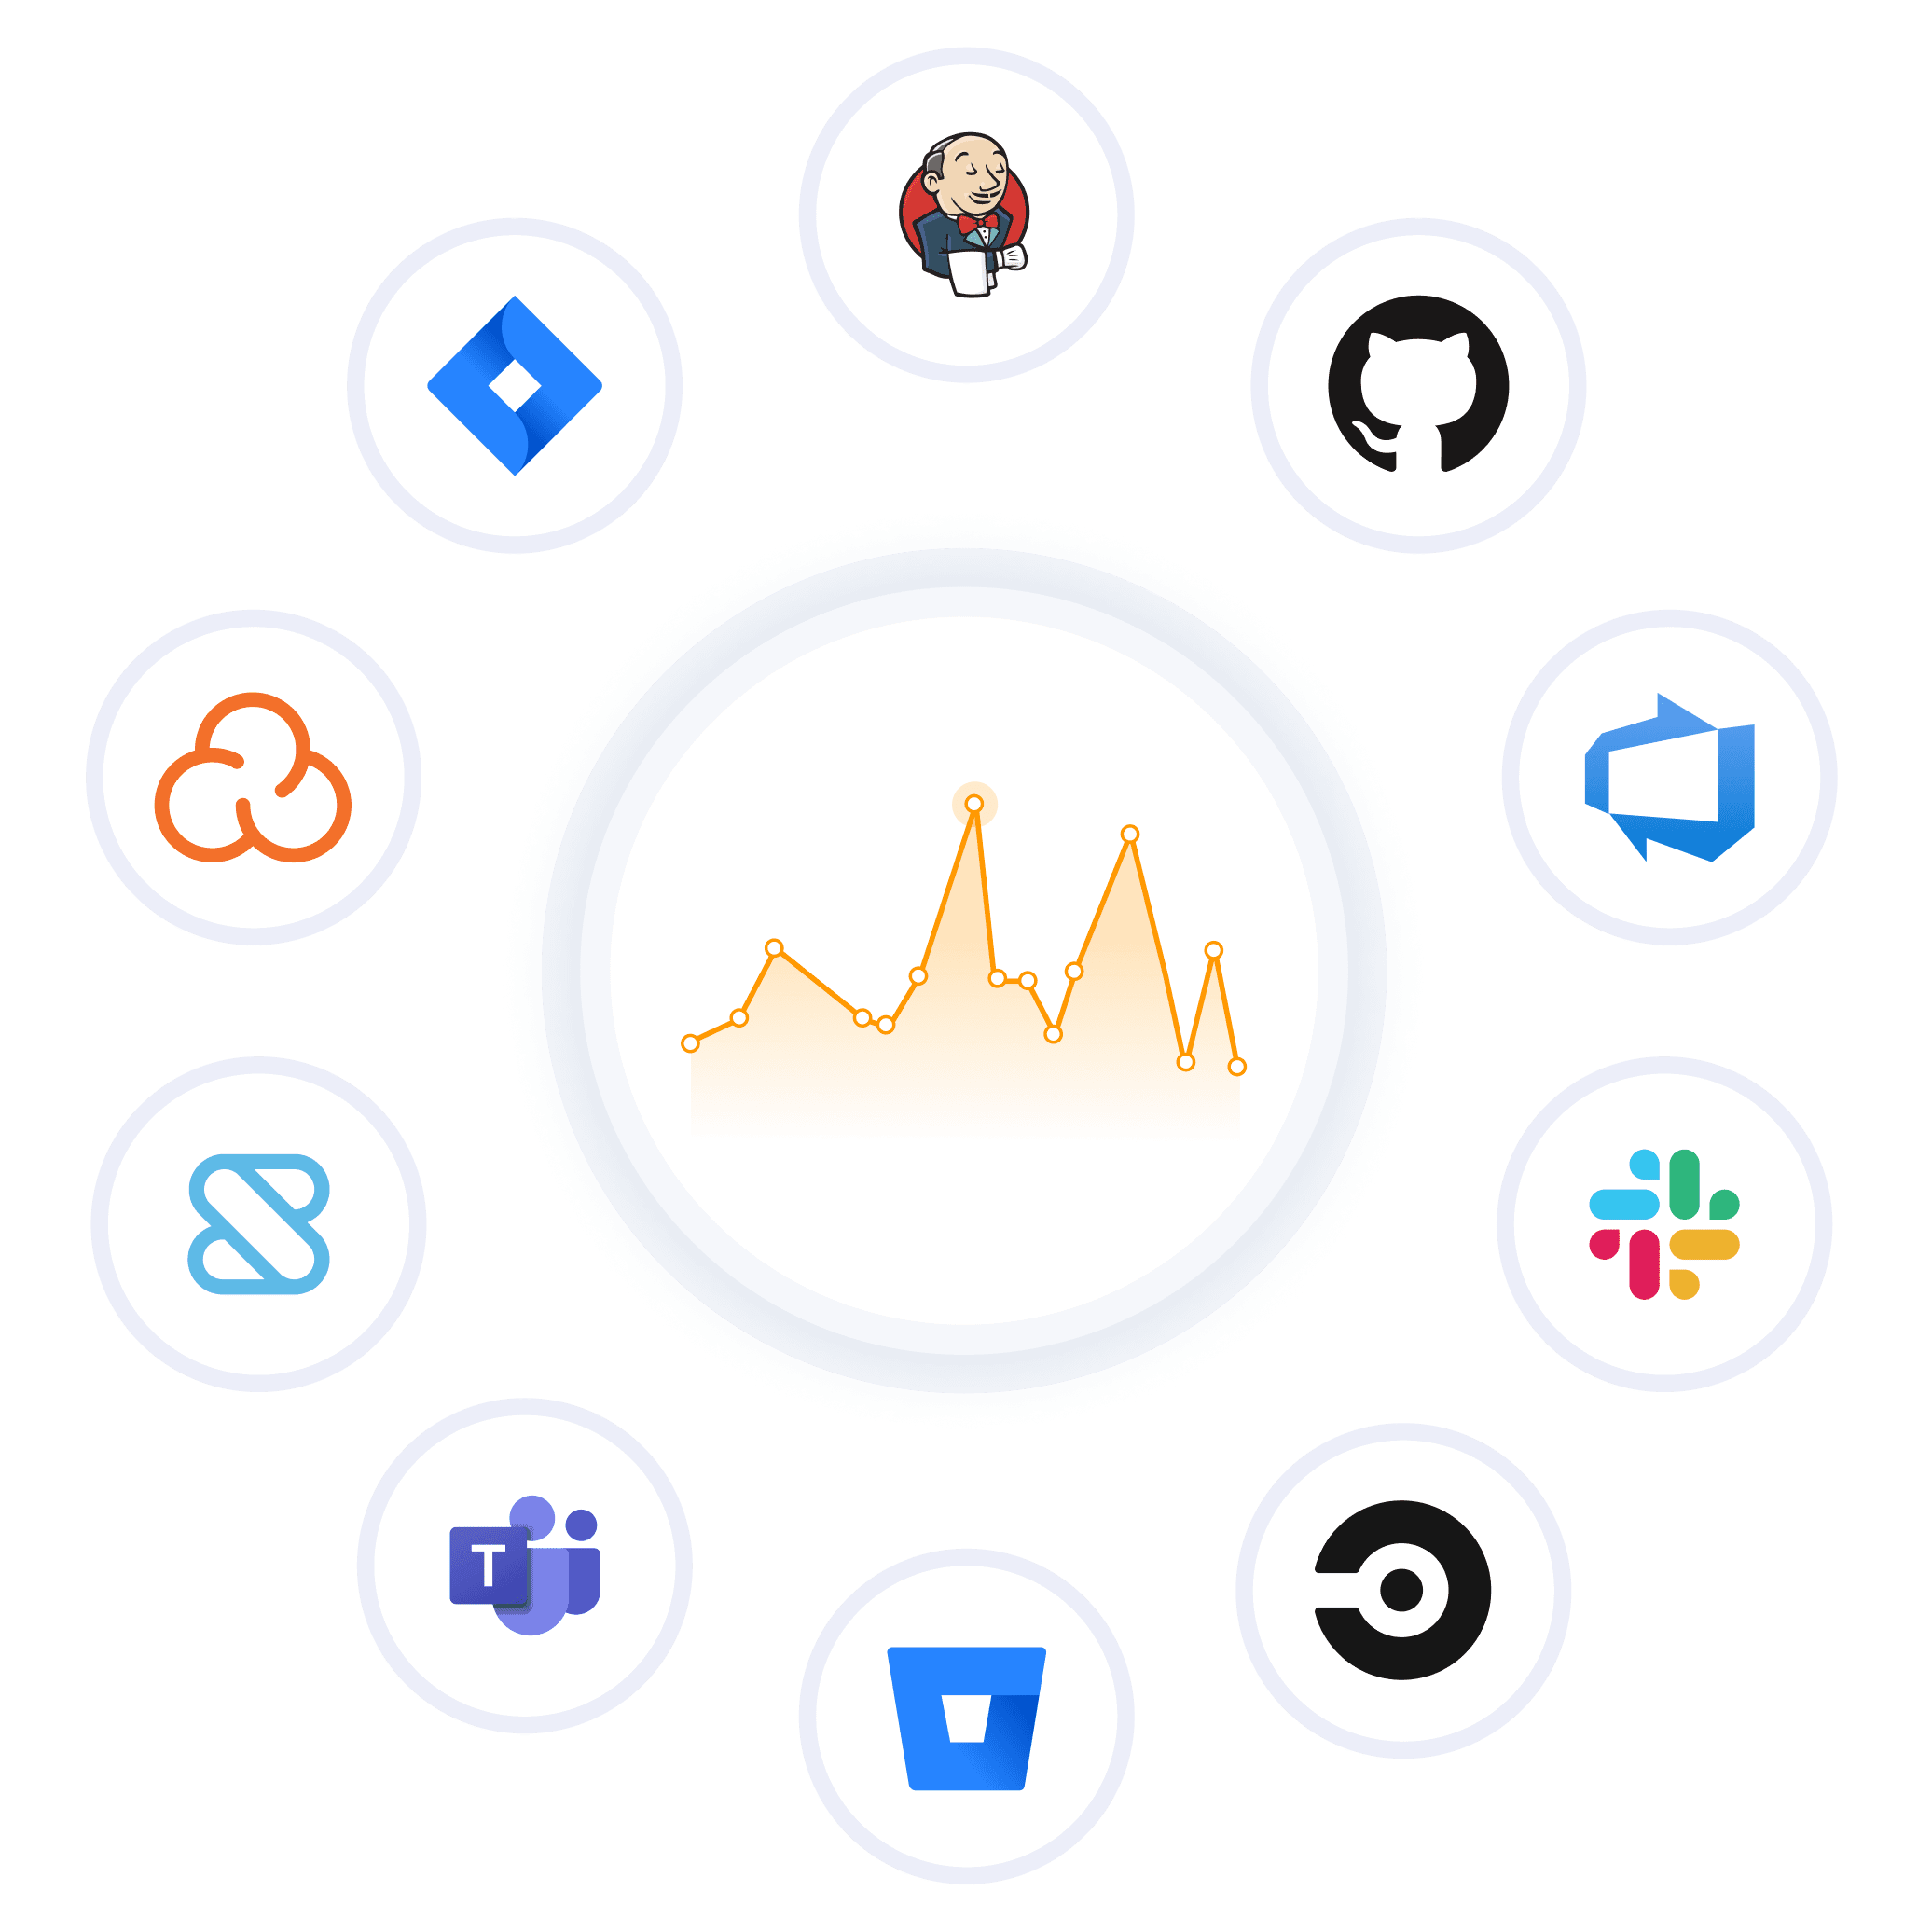
Once you aggregate data your data from all relevant tools and platforms, you can start to correlate data points across the different sources to achieve a holistic view. Analyzing historical data over time will unlock insights into the trends and patterns of your engineering organization’s performance.
2. Benchmarking: Understanding Your Position
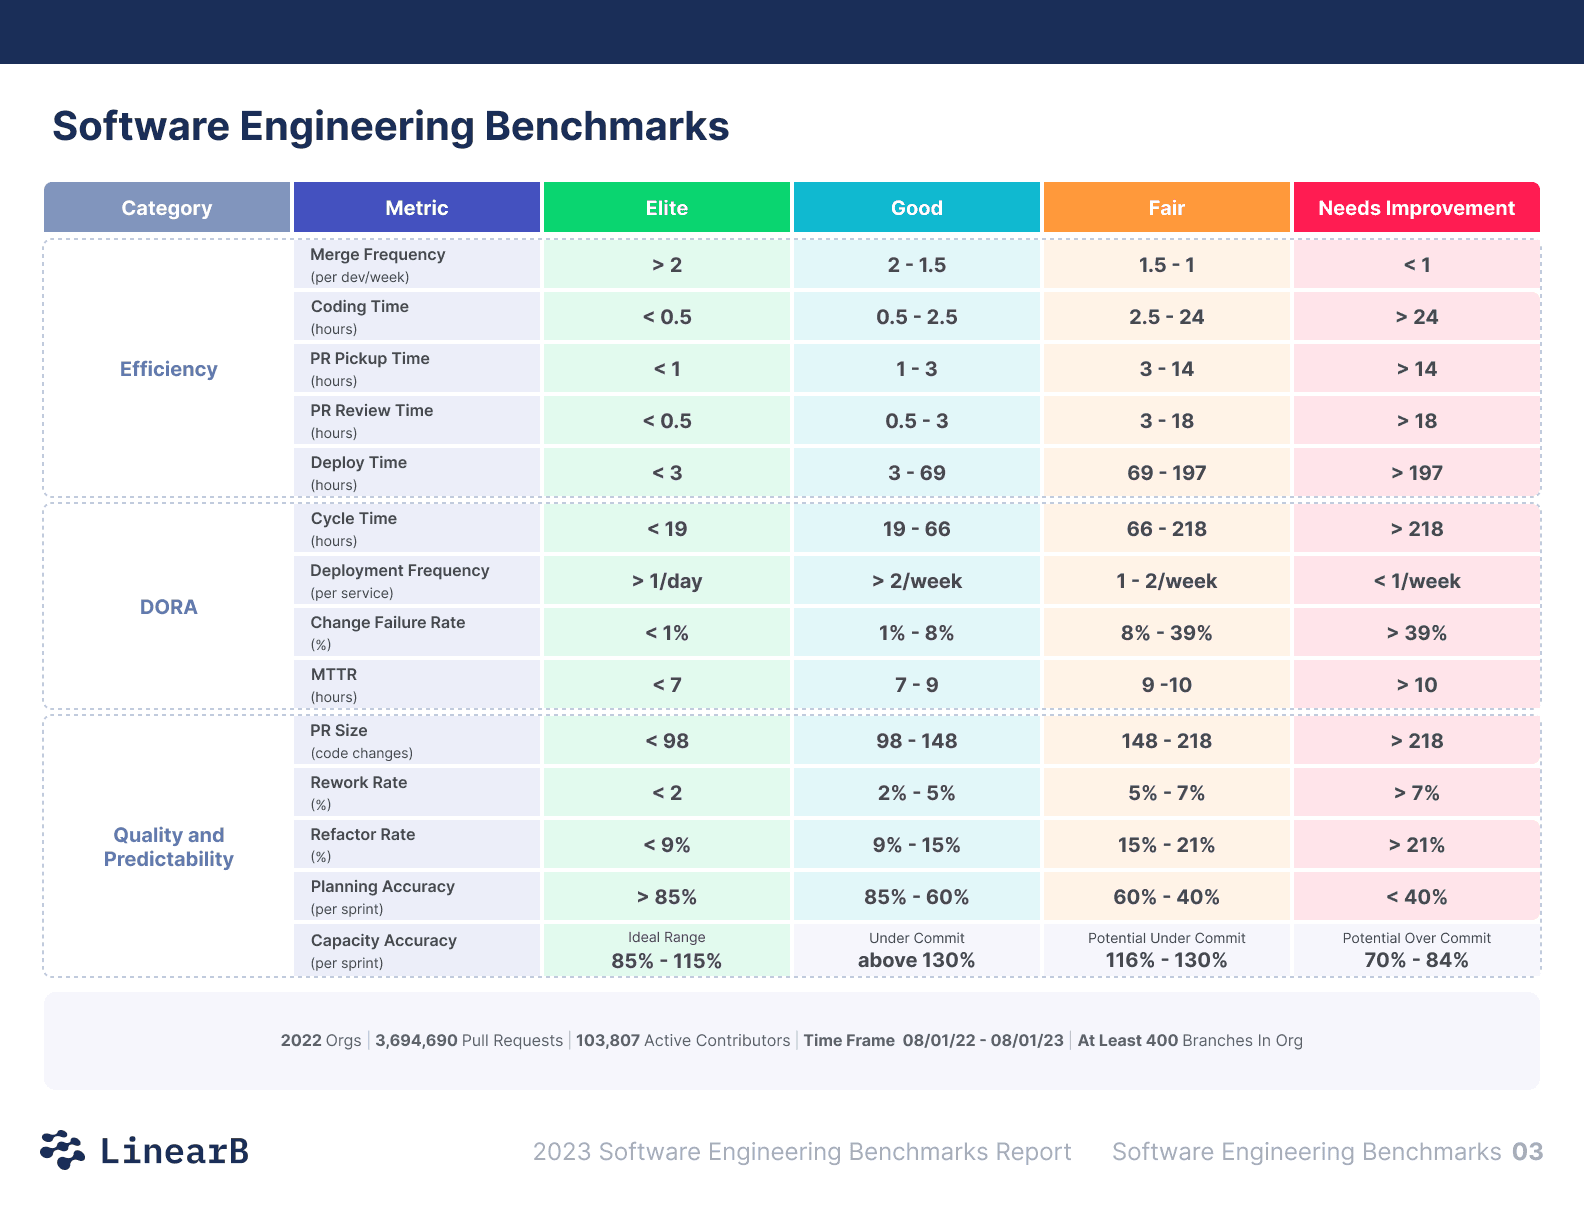
Once you have visibility, the next step is benchmarking your engineering metrics against industry standards so you can figure out what they mean.
- Is your 12 day cycle time good?
- How about your average PR size of 250 lines of code?
Visibility is a great first step, but understanding the context, where you are, and how far you have to go is much more important. All the engineering metrics and visibility in the world don’t mean much without a baseline. The only way to know is to contextualize your metrics and see what your industry peers are doing using the Engineering Benchmarks.
LinearB analyzed the engineering metrics from more than 3,600,000+ pull requests (PRs) from over 2022 organizations to illustrate what the top performing teams’ metrics are in each of these key areas. This helps you understand where your team stands and identify areas that need improvement.
3. Diagnosis and Reporting: Identifying and Addressing Bottlenecks
After benchmarking, shift your focus to diagnosing issues and reporting on improvement opportunities. Use metrics to pinpoint bottlenecks in your processes and develop strategies to unblock them. We recommend most organizations start with cycle time, because it provides an end-to-end snapshot of software delivery efficiency, and is the source of the single most common developer productivity bottleneck: code reviews.
Diagnosing Common Cycle Time Bottlenecks:
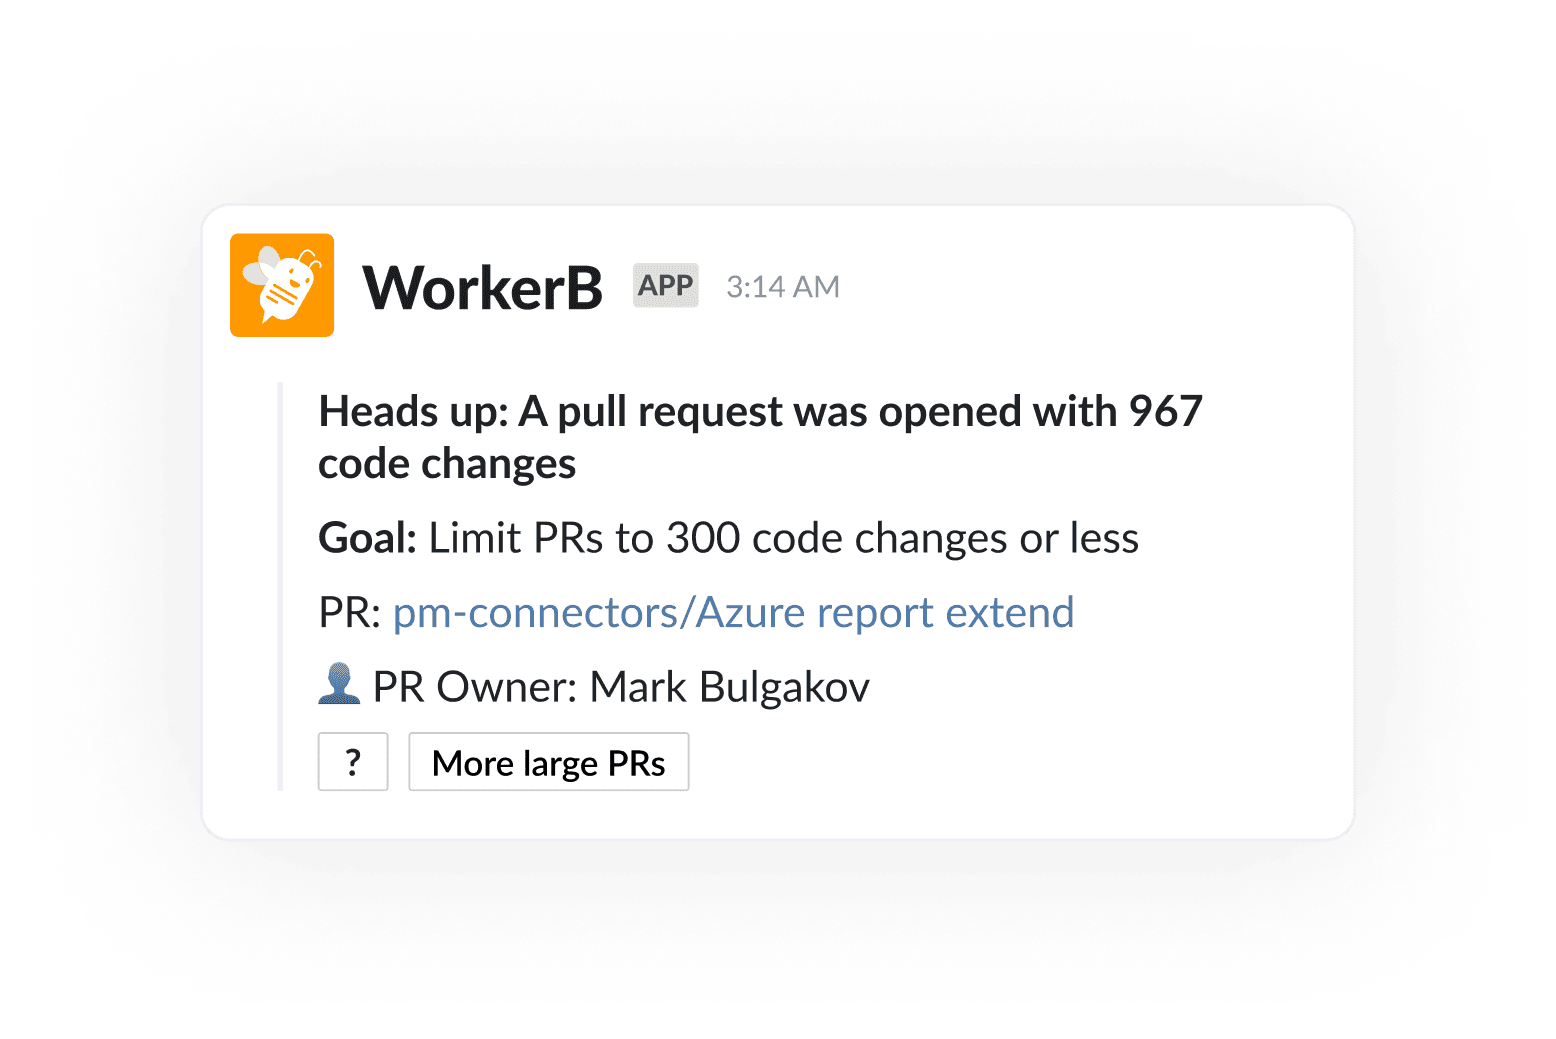
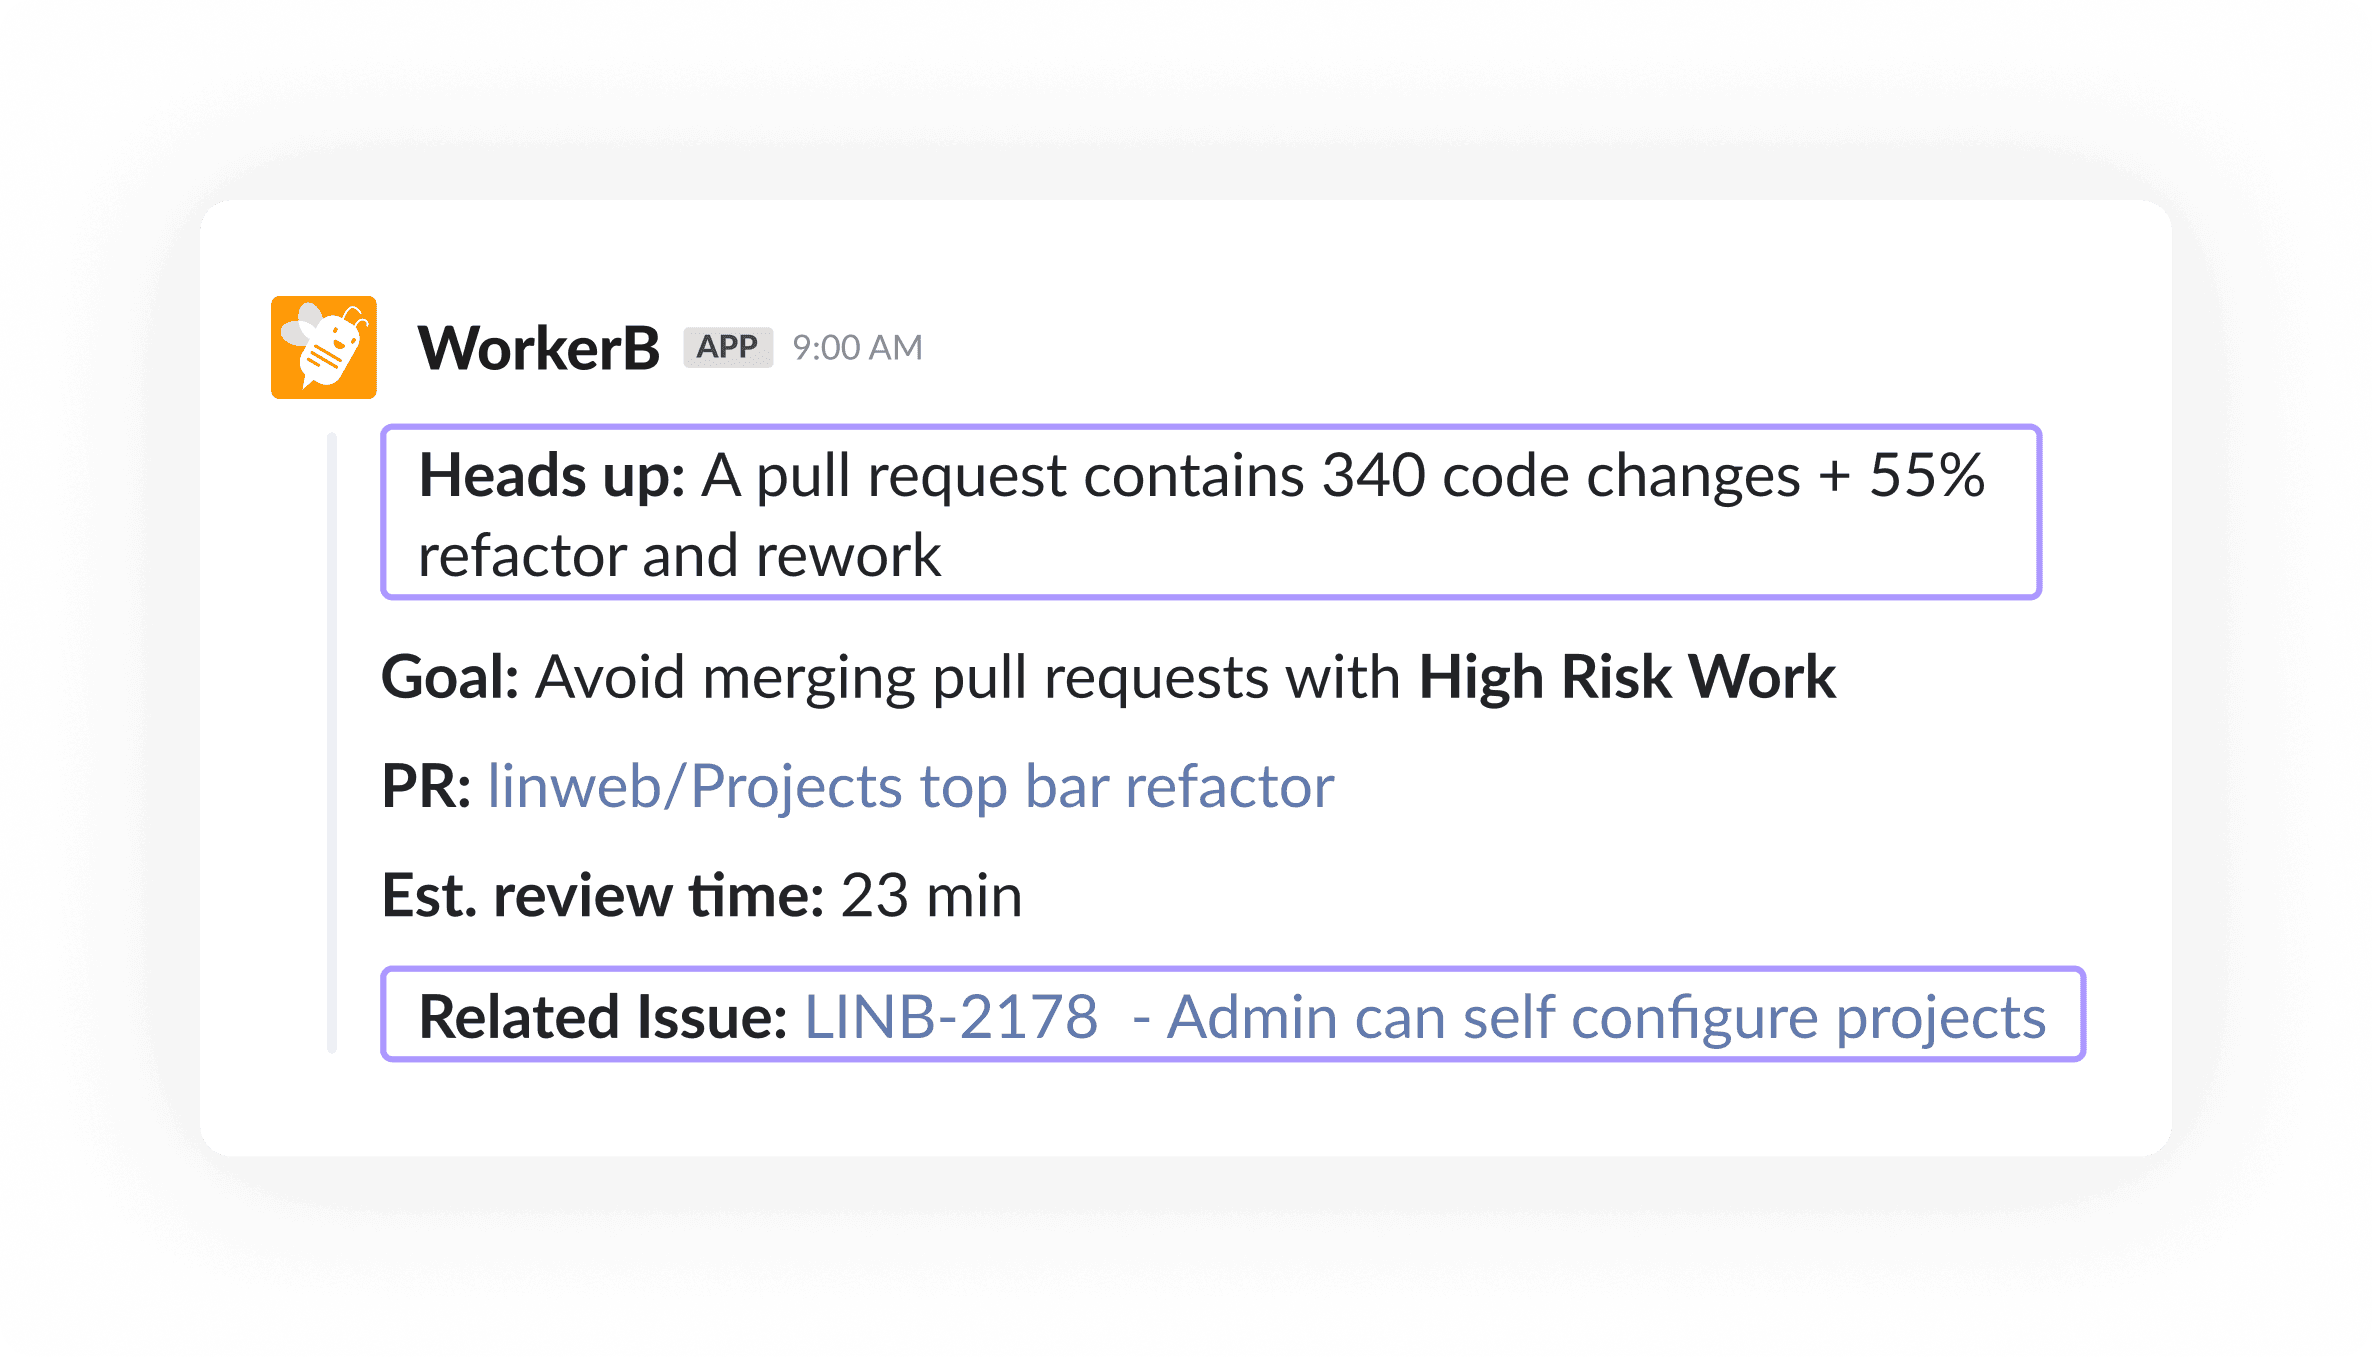
- High PR Sizes: PR size is a leading indicator for cycle time and software quality. Smaller, more manageable pull requests help developers minimize the risk of introducing new bugs or causing production issues. When PRs are concise, they are easier to test and review, allowing developers to focus on specific functionalities without being overwhelmed by numerous changes.
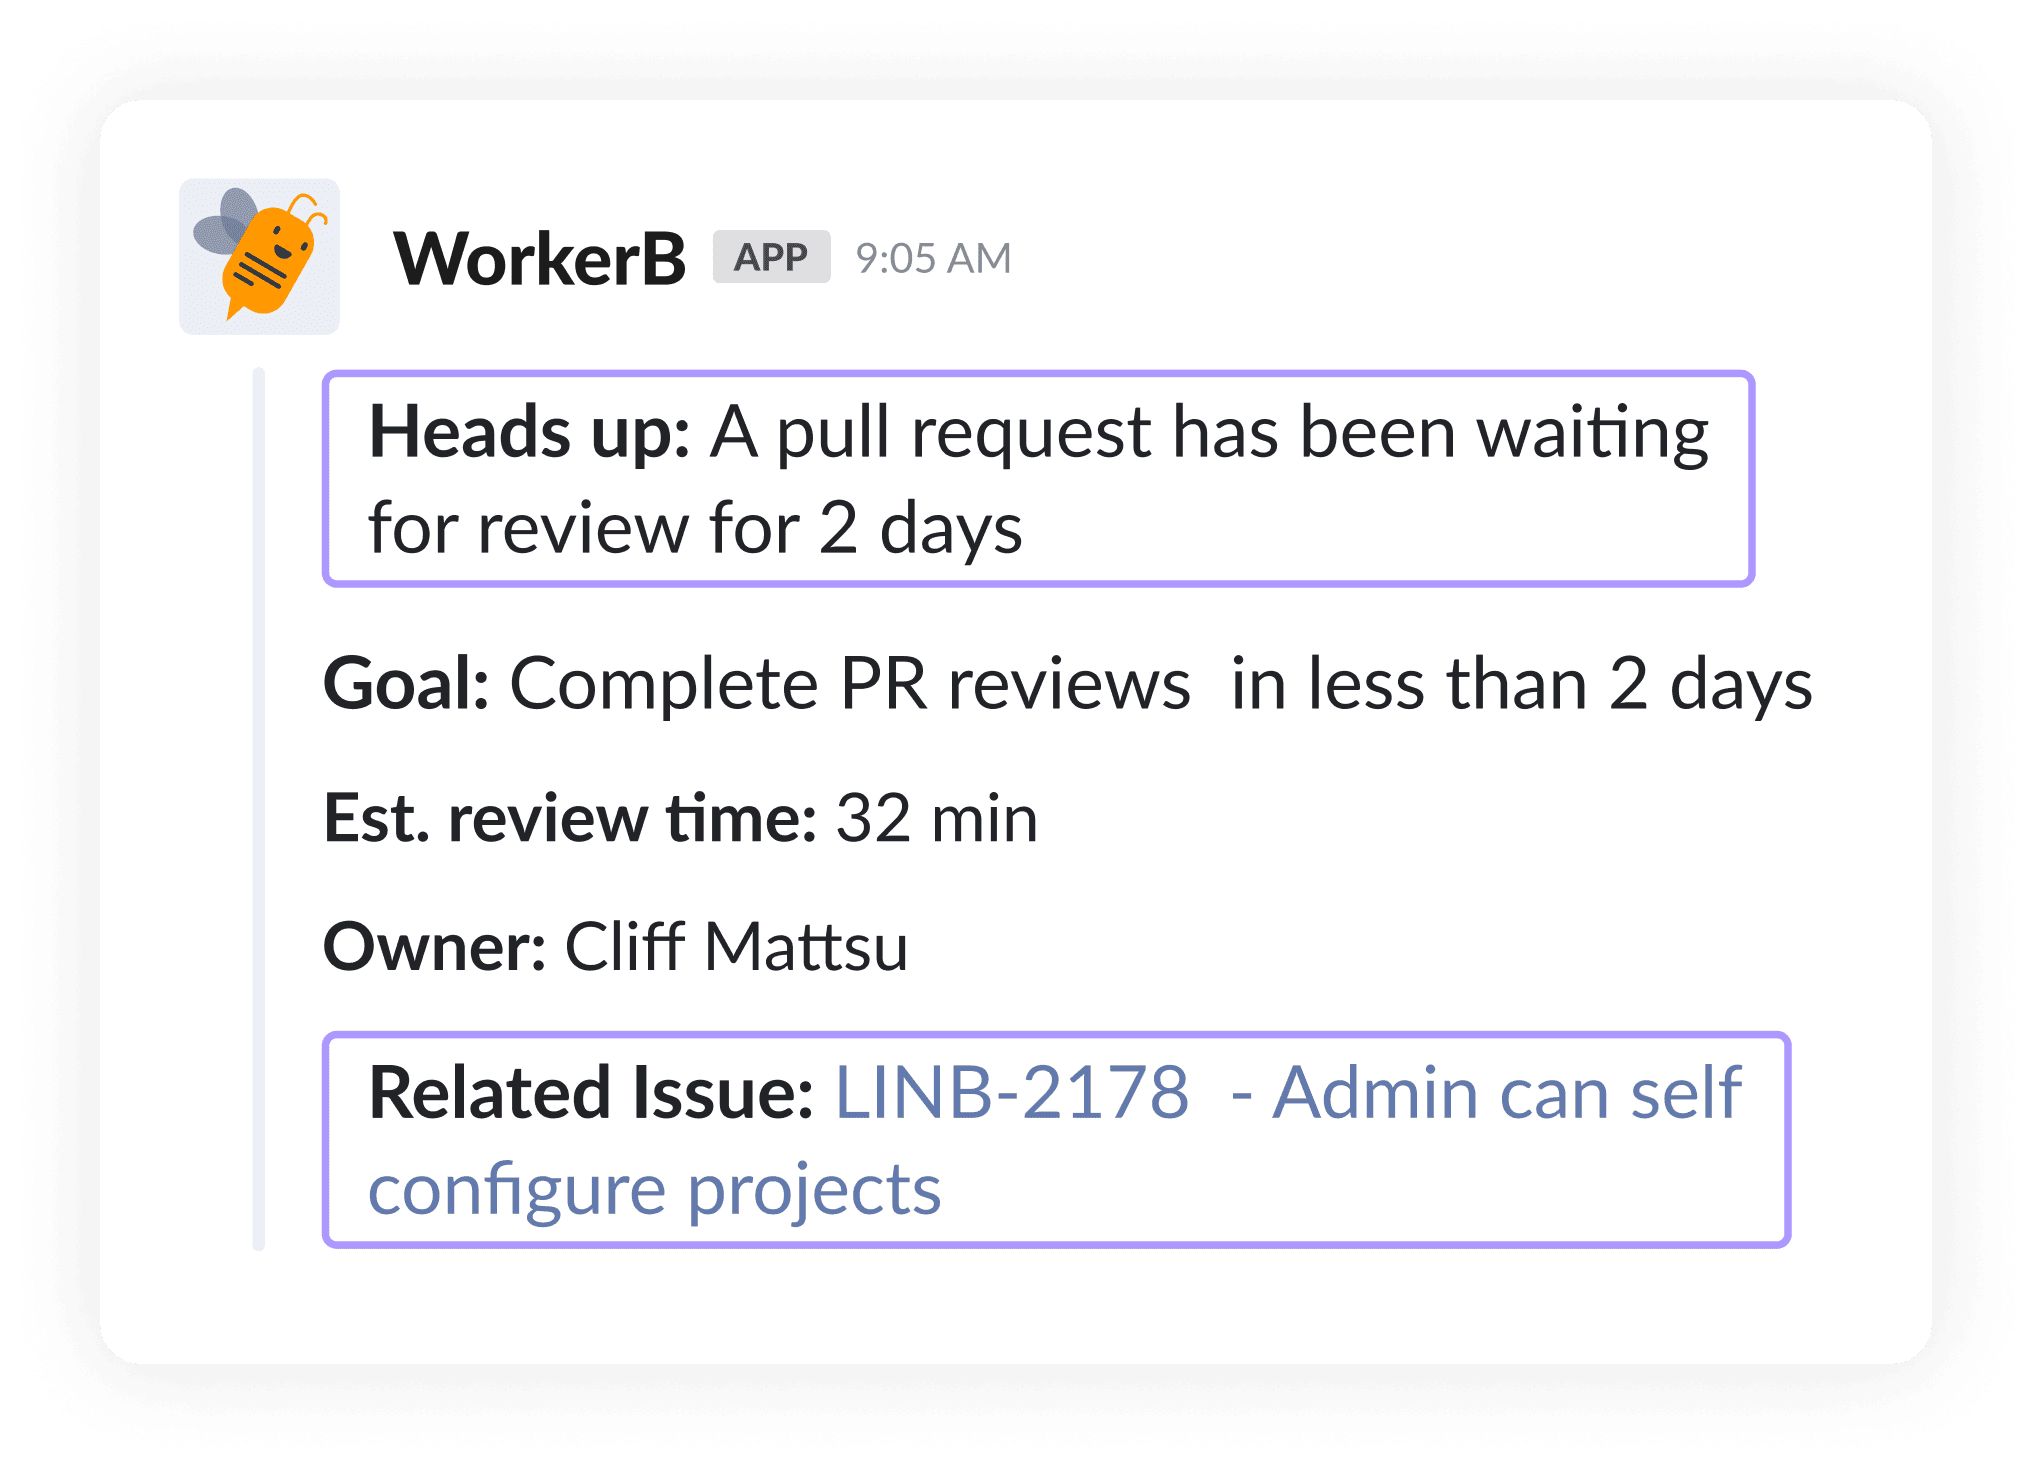
- Slow PR Pickups: The longer code waits for review, the bigger the context switch for all involved participants. Long pickup times and excessive code review notifications reduce developer productivity and negatively impact developer experience. You should optimize review routing and empower engineering teams to better manage the code review process.
- Excessive Rework: Code rework is a leading indicator of team frustration because it is often a symptom of a misalignment between product and development. This misalignment could result from process failures, incomplete requirements, a lack of skills, poor communication, excessive tech debt, poor testing practices, architectural problems, or high code complexity.
Building an Effective Improvement Strategy
After gaining visibility, leveraging benchmarks, and pinpointing bottlenecks, the next step is developing an improvement strategy. This involves setting specific, measurable engineering goals and using automation to maintain focus and consistency.
Steps to Build Your Improvement Strategy:
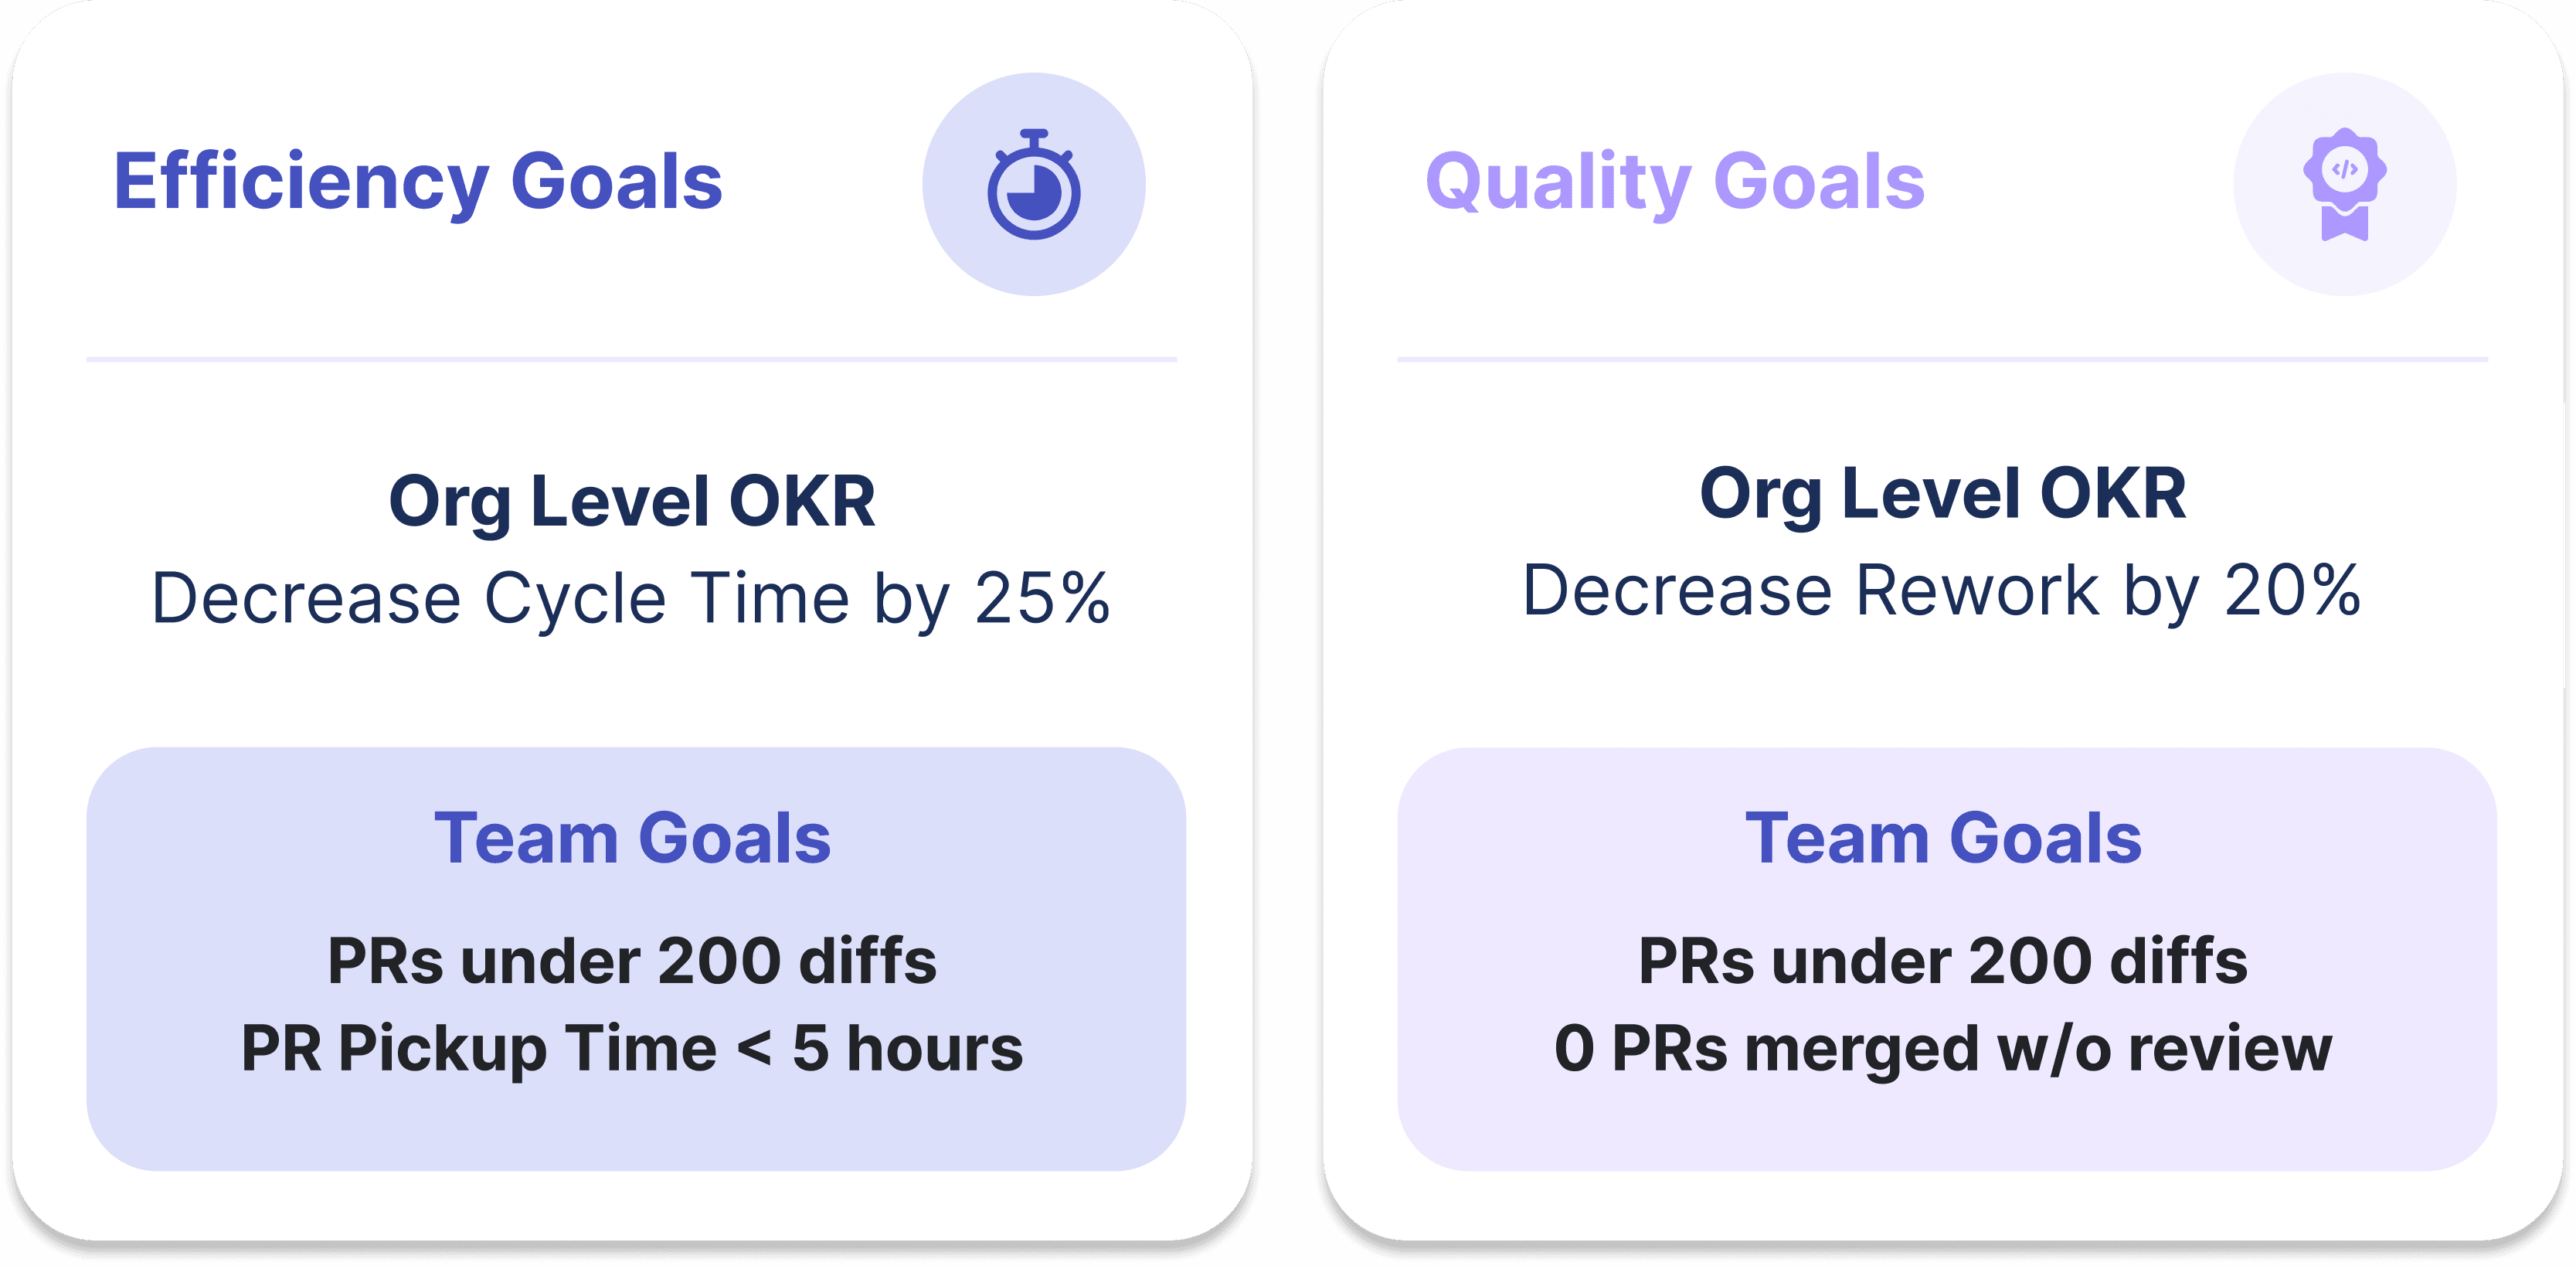
- Set specific goals – focus on one or two key engineering metrics per quarter and use benchmarks to set realistic, achievable targets. An example goal could be to reduce PR review time by 20% within the next quarter.
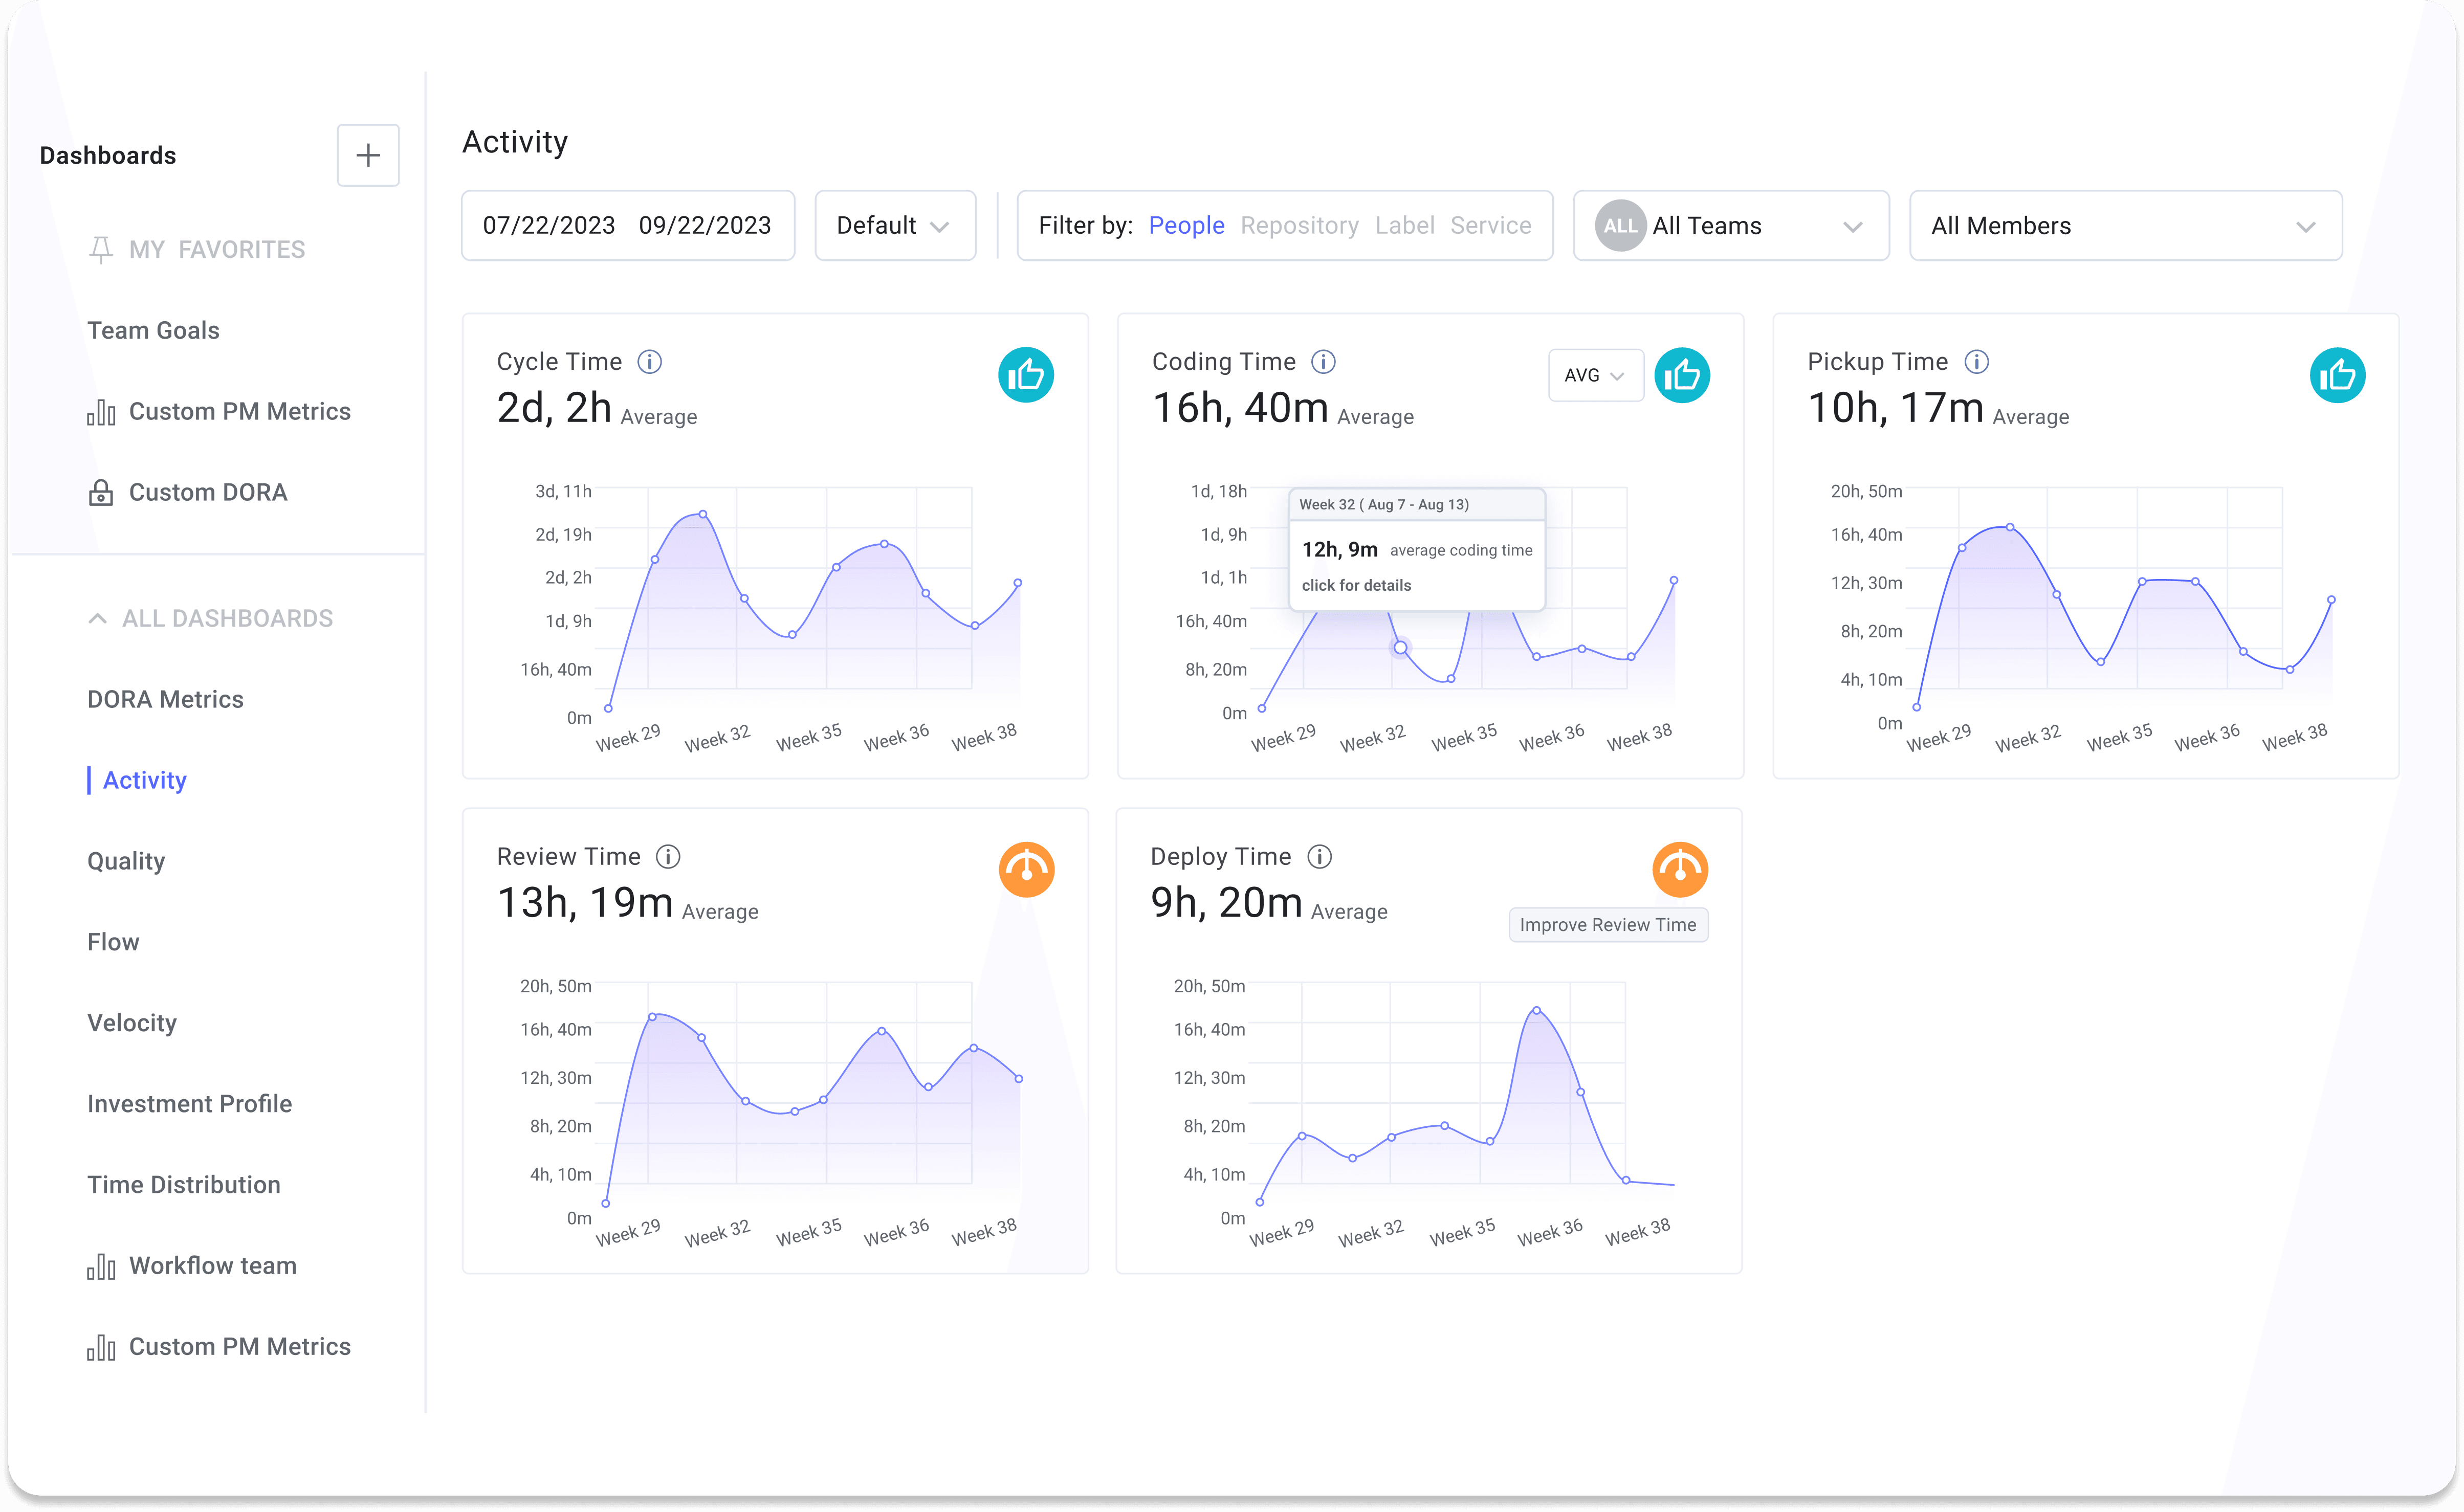
- Create custom dashboards to track your progress. These dashboards should include both leading and lagging indicators to provide a comprehensive view.
- Automate processes wherever possible. Tools like LinearB’s Software Engineering Intelligence Platform can help automate routine tasks and enforce PR policies. Set up automated alerts for key metrics to keep your team focused on improvement goals. For example, you could use automatic notifications for PRs that exceed size limits or have pending reviews.
Pinpointing Bottlenecks with Data Segmentation
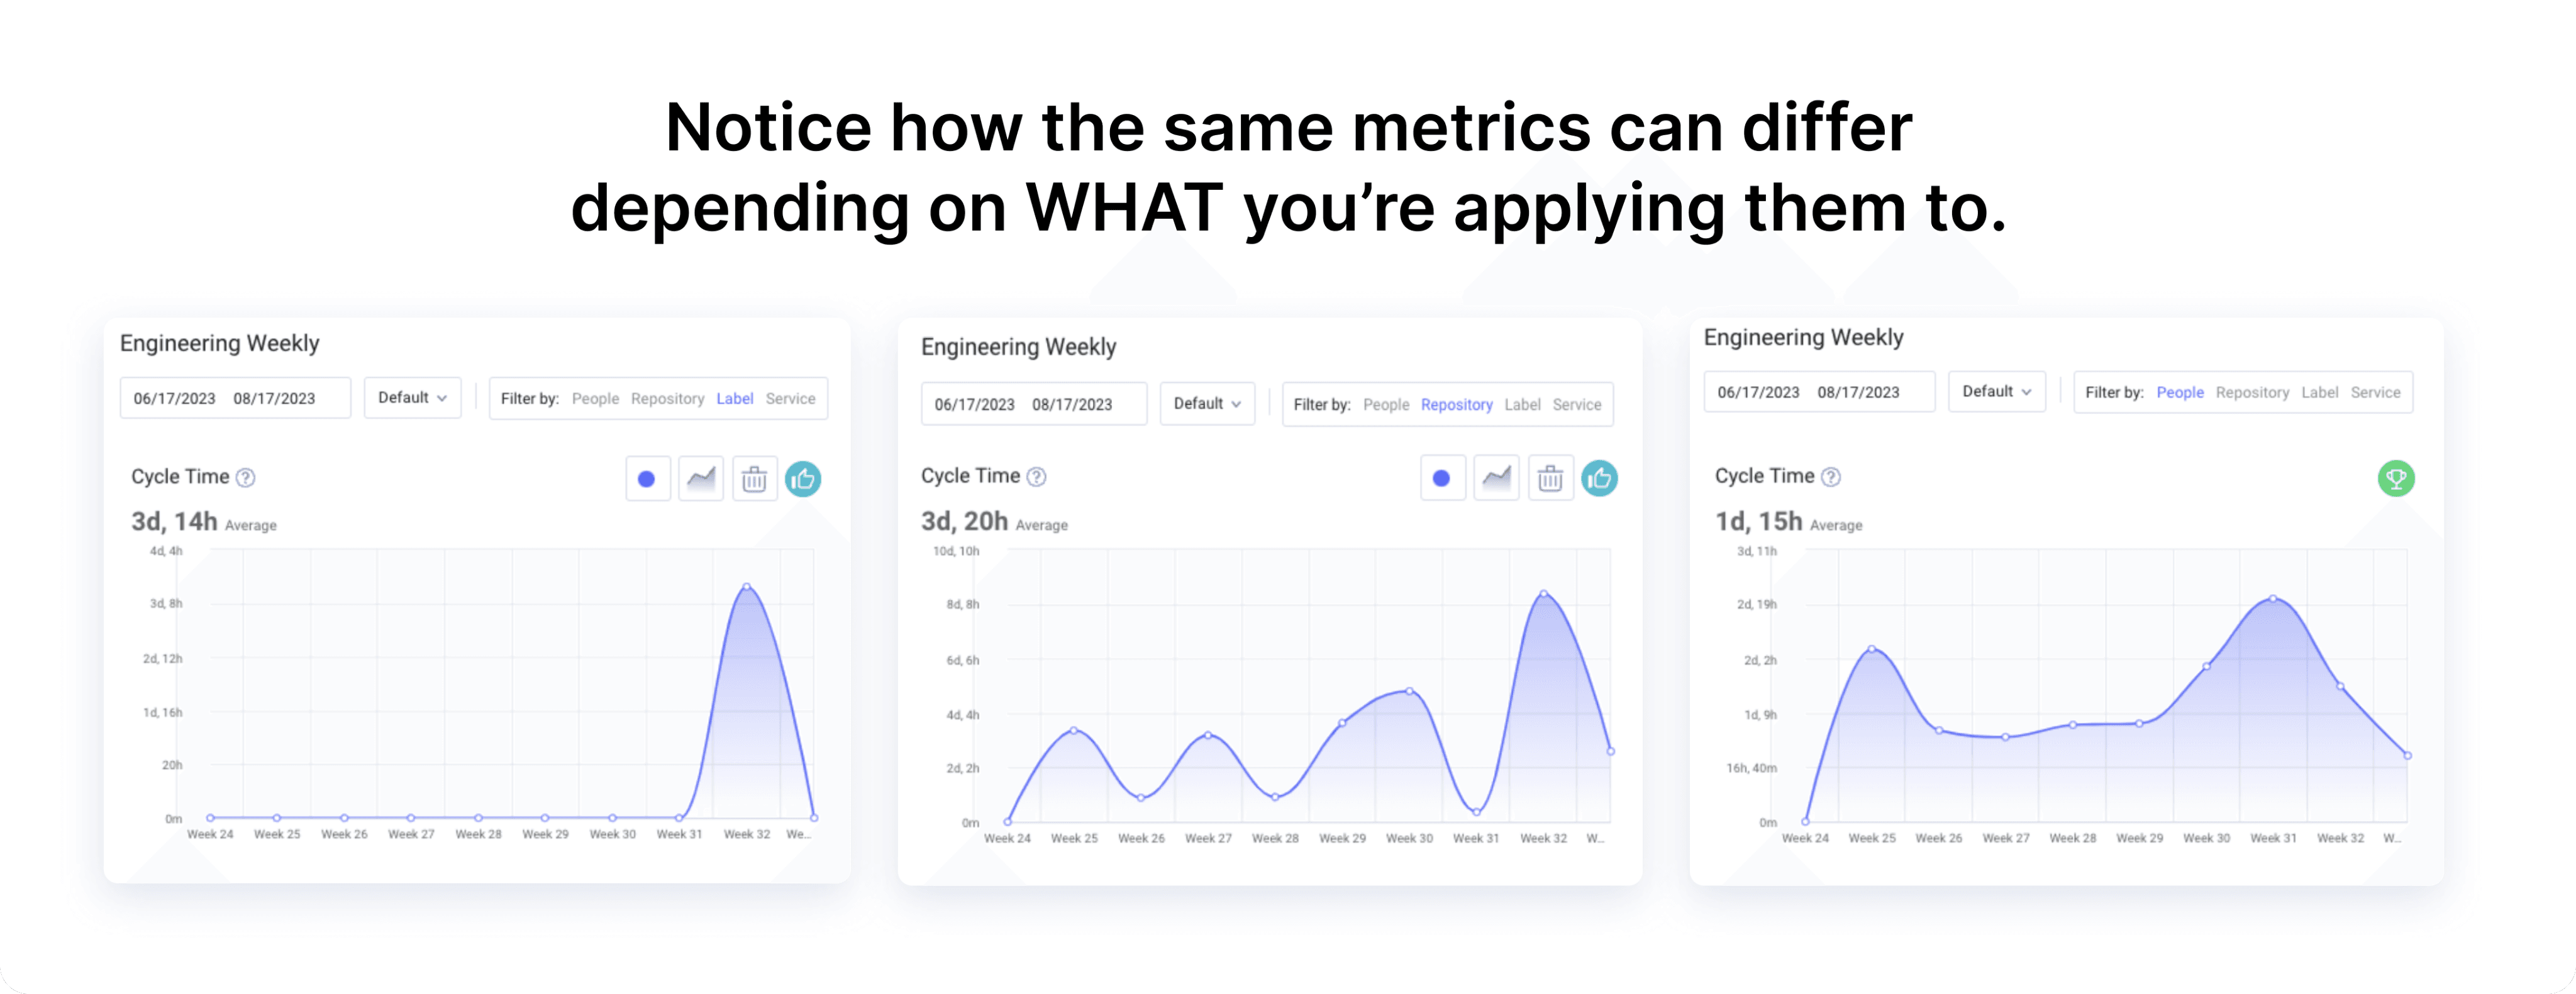
When building your improvement strategy, you need to segment your data to address the right issues with precision and efficiency.
Common Data Segments to Analyze:
- Team-Based Bottlenecks: Identify issues that are specific to certain teams.
- Repository or Code Base Segments: Focus on certain repositories or parts of your codebase that may be problematic.
- Service-Specific Analysis: Analyze services that involve multiple branches and repositories.
- Custom Metrics: Use labels and tags to create custom metrics for targeted analysis.
Pro Tip: Start with a dashboard that includes DORA metrics and leading indicators like PR size and pickup time. This can act as your foundation for recurring team syncs and help identify where improvements are needed.

Once your dashboards and different segmentations are in place, you can start digging into the metrics and find the root causes of operational issues. Granular analysis will help you uncover process bottlenecks and inefficiencies.
Common Bottlenecks to Investigate
This is by no means an exhaustive list, but our customers–and even our internal teams–have mentioned that these are points of friction that they encounter with some frequency. Take a look and see if any of these look familiar. Remember to compare these metrics to Engineering Benchmarks to gain more context and define “good” for your team.
Stuck Issues
Identify tasks or issues that are not progressing due to operational bottlenecks, lack of resources, or because something got lost over the normal course of business.

Engineering Metrics to Investigate:
- PR Pickup Time
- PR Review Time
- Cycle Time
- PR Size (look into spikes and outliers)
- Merge Frequency (look into valleys and outliers)
- Work Breakdown (New Code vs. Rework)
- Planning Accuracy (how is the team executing)
- Capacity Accuracy (how adaptable to change is the team)
- Unplanned Work (and how it impacts Accuracy Scores)
- Operational Goals and Attainment
- Custom Metrics (Like Bugs in Production)
- Resource Allocation
- Investment Strategy (Where is time being spent?)
- Project Forecasting (Insights like lack of git activity, missing PM data, unassigned work, stale issues, and more)
- SEI+ Automation (What’s in place and the impact?)
Overloaded Engineers
Prevent burnout and inefficiency by ensuring developers are taking on the right amount of work, have balanced workloads, and take time to rest and recharge.
Engineering Metrics to Investigate:
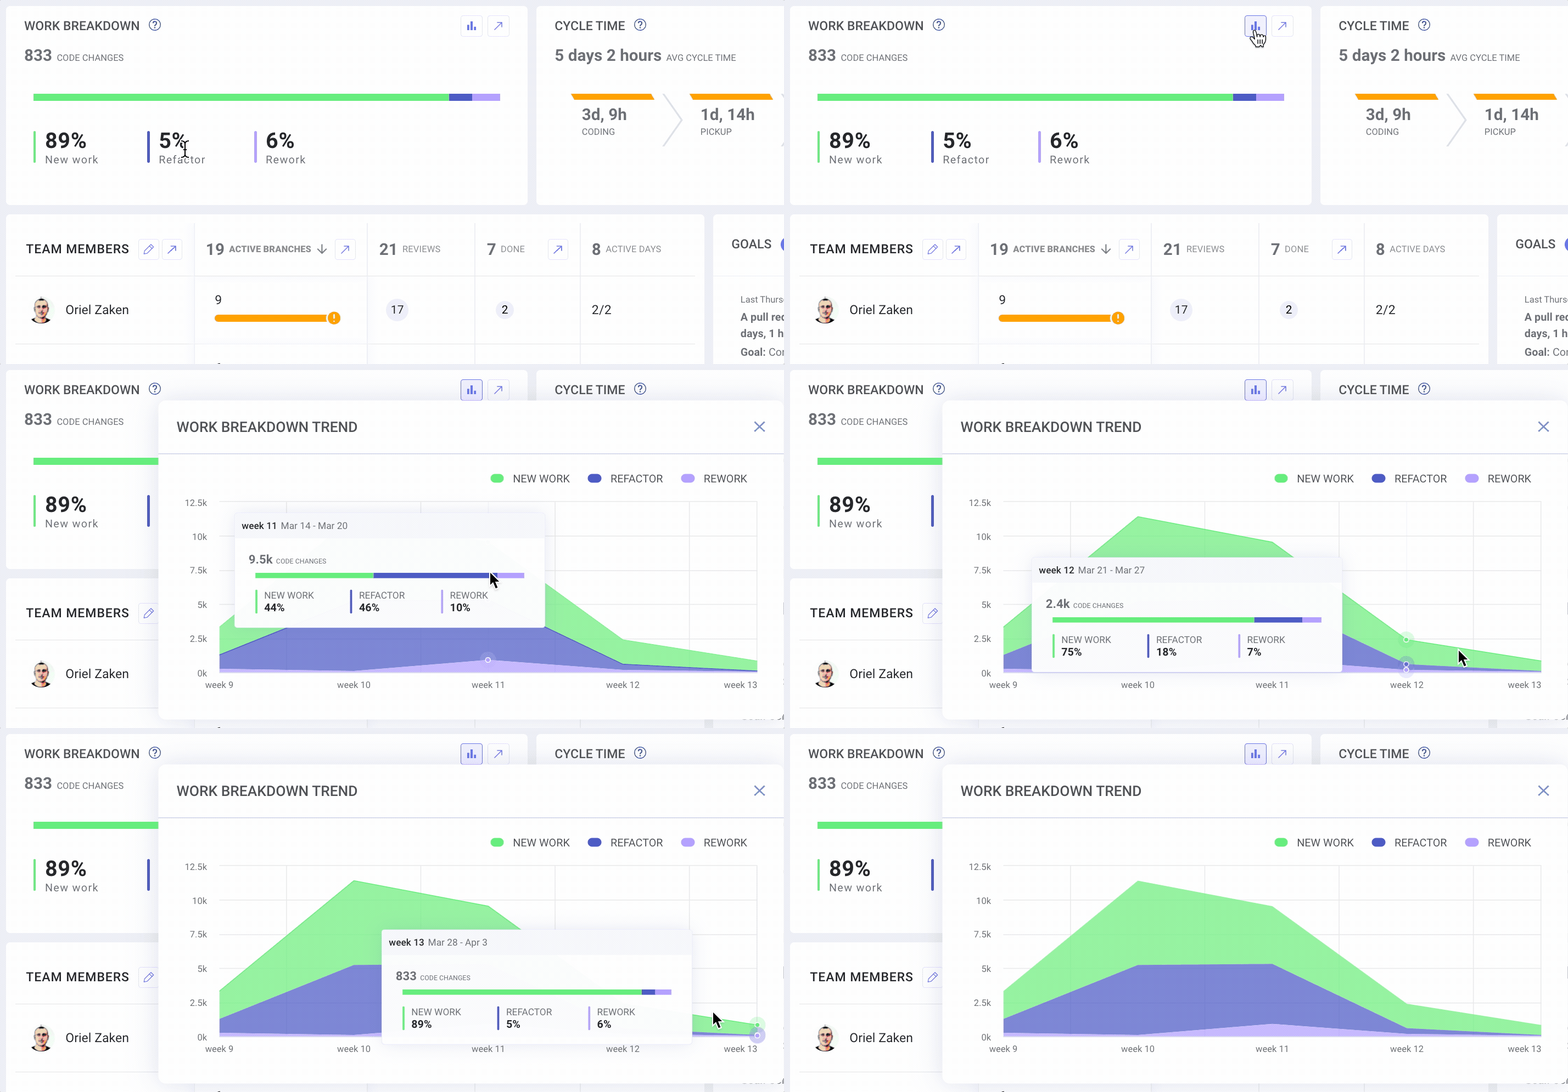
- People Activity (WIP, Active Days, PRs Opened, Reviews, Active Branches)
- Resource Allocation
- Investment Strategy
- Team level Project Forecasting Insights (git activity, resource management and over extended developers)
- Accuracy Scores (is unplanned work bogging the team down)
- Custom Metrics (Like Bugs in Production)
- Developer Coaching Dashboard** (make sure developers have a healthy balance of engaging problems to solve and work to keep the lights on–like bugs and addressing tech debt)
**Coming Soon
Overlooked Reviews
Whether through the natural back and forth of the PR process, lack of visibility, heavy cognitive loads, or lots of context switching, sometimes work falls through the cracks. This common issue can impact quality and slow down code reviews–not to mention the entire development pipeline–because both authors and reviewers have to reorient themselves with the work to be done. This often results in compounded delays, lots of frustration, and shallow reviews (“LGTM” on 300 diffs isn’t a review).
Engineering Metrics to Investigate:
- PR Pickup Time
- PR Size (small PRs are picked up and reviewed faster and more accurately)
- Review Depth
- SEI+ Automation (What’s in place and the impact?)
- Team Activity (Who’s opening PRs and who’s reviewing them?)
- Team Goals (Review Depth, Pickup Time, Review Time, PR Size)
- Resource Allocation (Are there enough people on the project to get it done)
Conclusion
Building your engineering metrics program is how you can drive continuous improvement and achieve business objectives. By setting clear goals, benchmarking against industry standards, and using effective reporting, engineering leaders can:
- Boost developer productivity
- Improve developer experience
- Predictably deliver mission-critical projects
Leveraging Software Engineering Intelligence Platforms like LinearB will streamline these processes, giving you the visibility and automation needed to succeed and fulfill the dual mandate of operational excellence and business impact.
By focusing on visibility, benchmarking, and targeted improvements, your engineering team can not only meet but exceed its performance goals, driving significant value for your business.
Want to learn more about building an engineering metrics program? Download the Engineering Leader’s Building a Metrics Program

