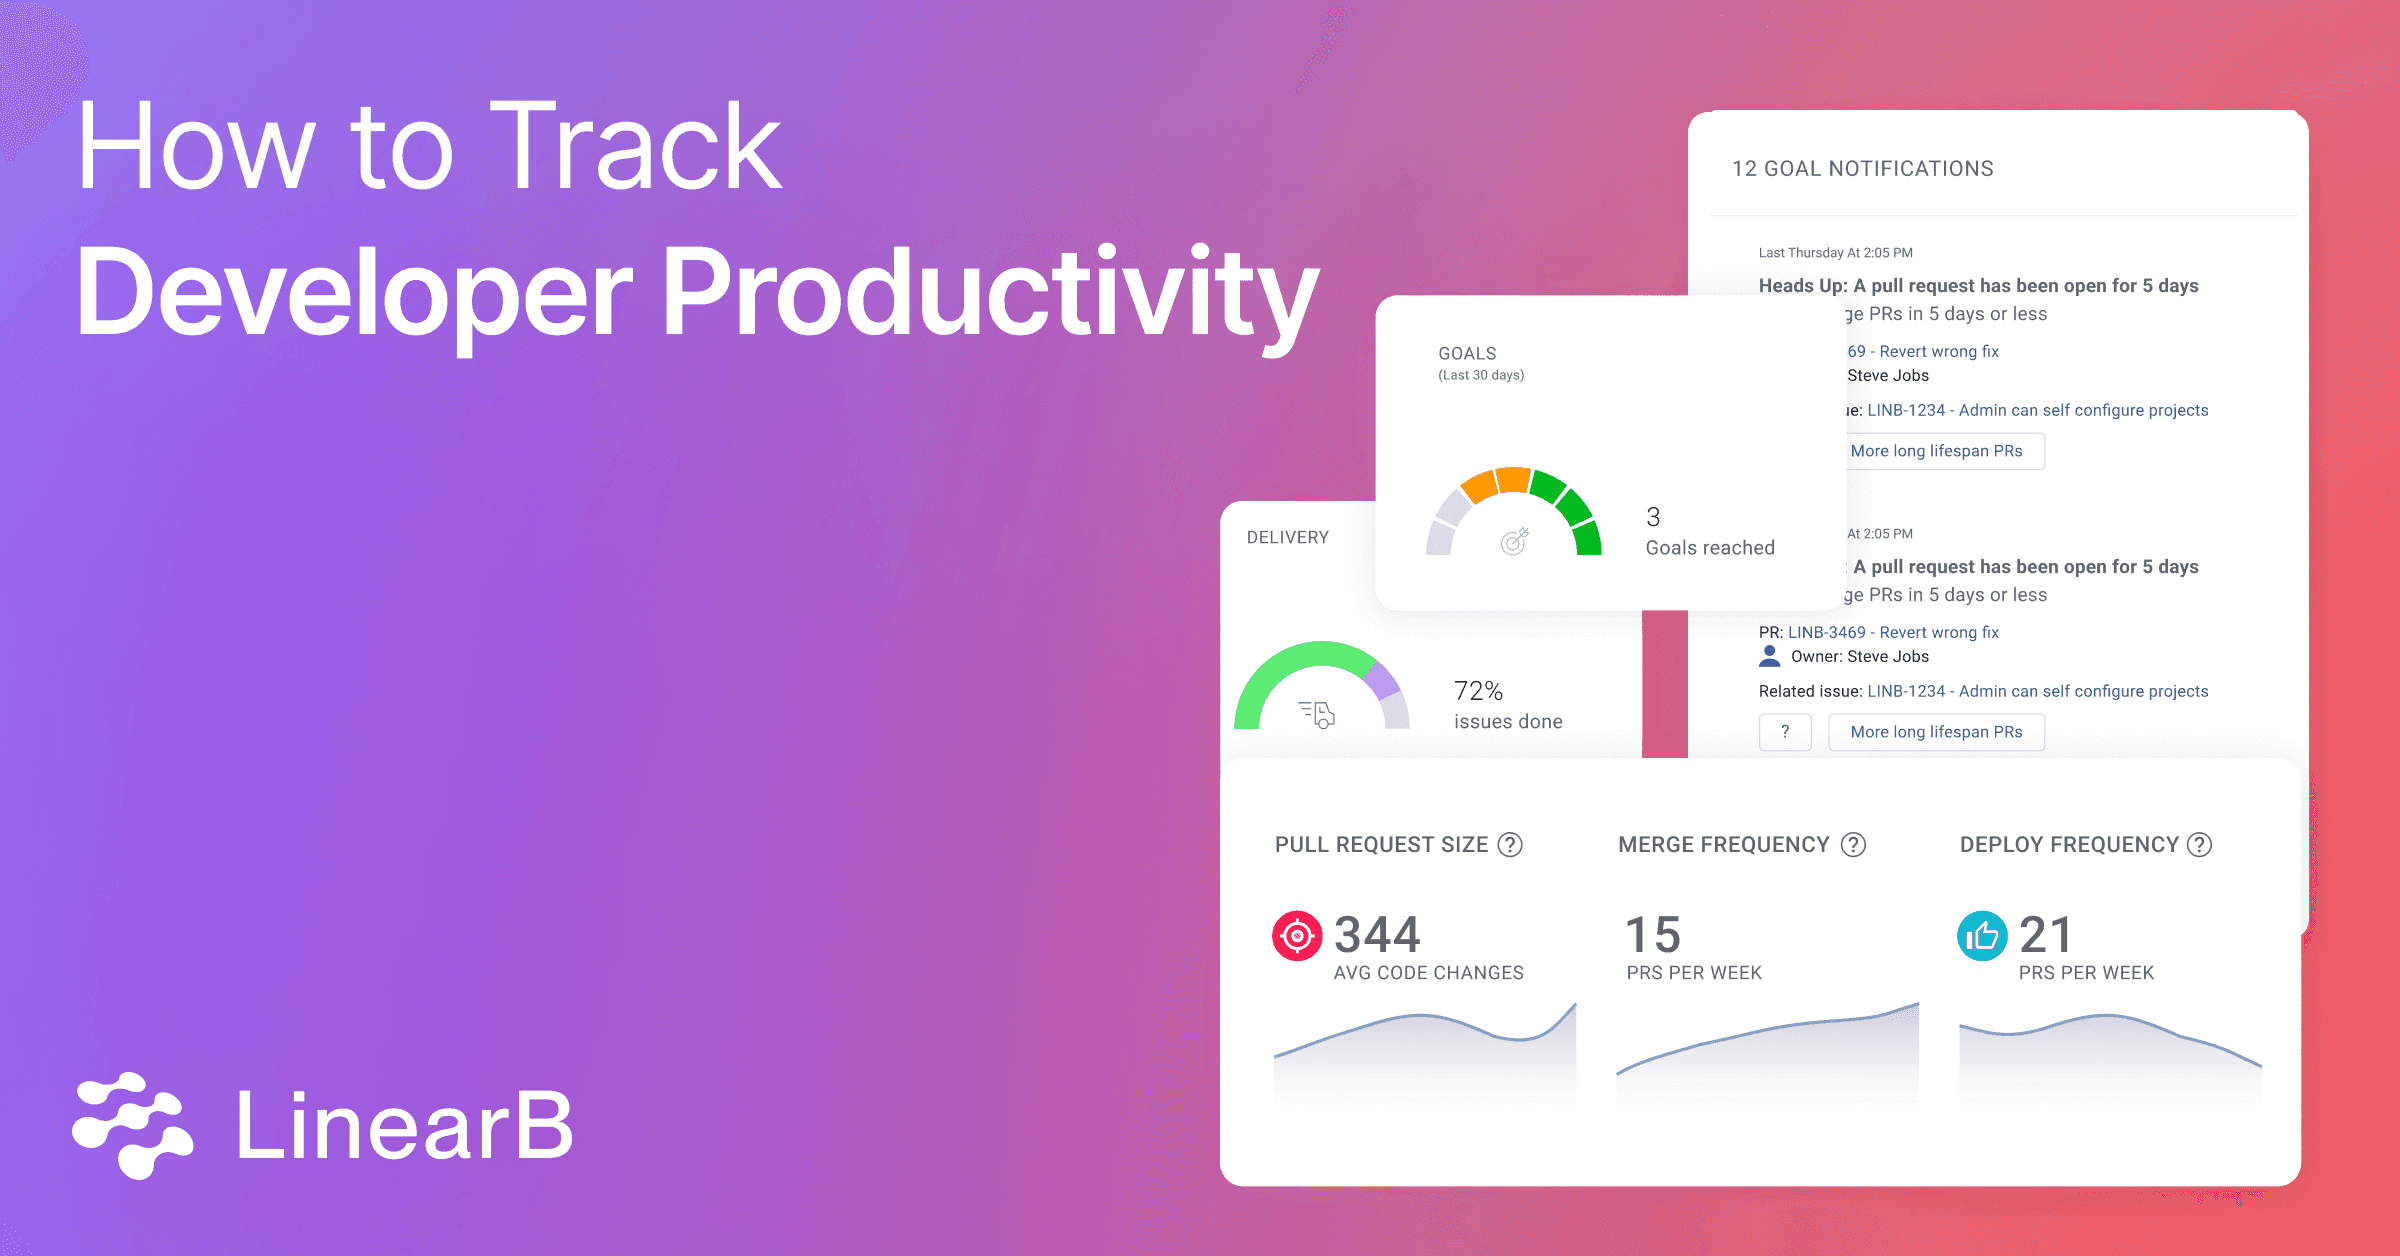
In this economy, you’re undoubtedly getting pressure from your execs about how to track developer productivity. And you need to figure out how to do more with less.
So how do you reassure your stakeholders that you have a grasp on your developer productivity, where it needs focus, and how you’re going to improve it? It’s crucial to monitor the right productivity metrics because you can’t improve what you don’t measure.
This article will define developer productivity, address some common myths surrounding it, and cover ways to measure it. Let’s dive right in.
Defining Developer Productivity
Developer productivity refers to an engineering org’s effectiveness and efficiency in releasing high-quality code that delivers value. Tracking productivity involves a variety of metrics, and choosing the wrong metrics to define productivity in an engineering org is a common pitfall.
Let’s take a look at other common myths and misconceptions around measuring developer productivity.
Common Myths About Dev Productivity
Myth 1 – Activity = Productivity
In many companies, productivity is measured by the number of projects, features, or lines of code developers can deliver. More output equals more success. However, these measurements don’t consider the quality of the code or how closely the activity aligns with the project's defined scope.
Writing a large amount of code does not necessarily equate to productivity. True productivity is creating code that solves problems, adds value, and integrates well into the existing system. It’s the difference between quantity and quality.
If you are not measuring the quality of those tasks or how the activity aligns with the broader business goals, you may not be productive at all. You may be completing work that isn’t useful or creating more work via technical debt that you’ll have to pay back later. Tasks should be purposeful and aligned with broader goals. For more on this, check out the Engineering Leader’s Guide to Goals and Reporting.
Myth 2 – Individual Productivity = Team Productivity
Many software firms count the lines of code developers write to measure their productivity. But that’s not really ideal. Pushing developers to write more code doesn’t help that code get released to production any sooner.
Software development is a team sport. And if you start stack ranking devs by individual metrics to determine productivity, you’ll actually tank it. Instead, you need to focus on outcomes.
Team-based metrics like merge frequency and deployment frequency (more on these later 👇) are better measures of the whole organization's productivity. At the same time, you’ll be promoting efficient processes that speed up development time.
Check out this chat with LinearB CEO and Co-founder Ori Keren, and Spot AI’s Kelly Vaughn to learn more about their perspective on how to measure developer productivity the right way.
Myth 3 – One Metric to Rule Them All
This idea that there’s “one metric that matters,” and it can be used to score teams on their output and compare teams across an organization—well, it just isn’t true. And not only is not true, it’s extremely dangerous. LinearB COO, Dan Lines, has very strong opinions on how agile velocity has been viewed this way.
 Find out why agile velocity is the most dangerous metric for software developers. Look at 12 alternative metrics instead.
The truth is that engineering projects are multi-dimensional. You can’t uniformly measure all developers, all teams, and all types of output the same.
Myth 4 – Only Managers Need to Measure Productivity
This myth likely comes from the misuse of productivity metrics by leaders or managers. Unfortunately, it’s all too common for engineering productivity to be poorly measured and misused.
But it’s important that your developers have insight into their own productivity. Ideally, they leverage it to make adjustments to their work, such as taking control of their calendar and focus time. And research shows that high productivity is directly correlated to developer experience (i.e. feeling satisfied and happy with work).
Developer Productivity and the SPACE Framework
The goal of the SPACE framework was to bust these myths and guide engineering organizations to a more holistic way of measuring developer productivity. Nicole Forsgren and a research team from Microsoft and GitHub used the acronym SPACE to define 5 dimensions of developer productivity:
- S: Satisfaction and well-being
- P: Performance
- A: Activity
- C: Communication and collaboration
- E: Efficiency and flow
It’s imperative for engineering leaders—and even executives—to understand that developer productivity is influenced by a wide range of factors and that problems in any of these areas will impact outcomes.
How To Track Developer Productivity
Without the proper tool, quantifying developer productivity can be a daunting task. But there are three things you need to get started: 1) to correlate data from your Git, project management, incident, and CI/CD tools, 2) focus on a core set of metrics, and 3) be able to benchmark your metrics against industry standards.
Let’s dig into each of these.
Correlate Data From Your Git and Project Management Tools
The typical mistake engineering leaders made trying to track developer productivity is trying to get all the data from their project management tool. Unfortunately, all Jira reports have crucial limitations:
- they can only leverage Jira data
- they require good hygiene to really be useful, and
- getting all the need-to-know information in a single executive report takes a lot of work
Project management data may show you that an issue or project is behind schedule or how your team has performed over time. But it doesn’t provide you enough context to answer the “why.”
By correlating project management & Git activity, LinearB's Software Engineering Intelligence Platform gives you a consolidated view of your productivity and a new depth of insights—presented in a way that every stakeholder can understand.
Start With the Basic Metrics
Developer productivity should be measured in both quantitative and qualitative ways. There are 3 main categories of metrics you should start with: DORA metrics, developer experience metrics and effectiveness metrics.
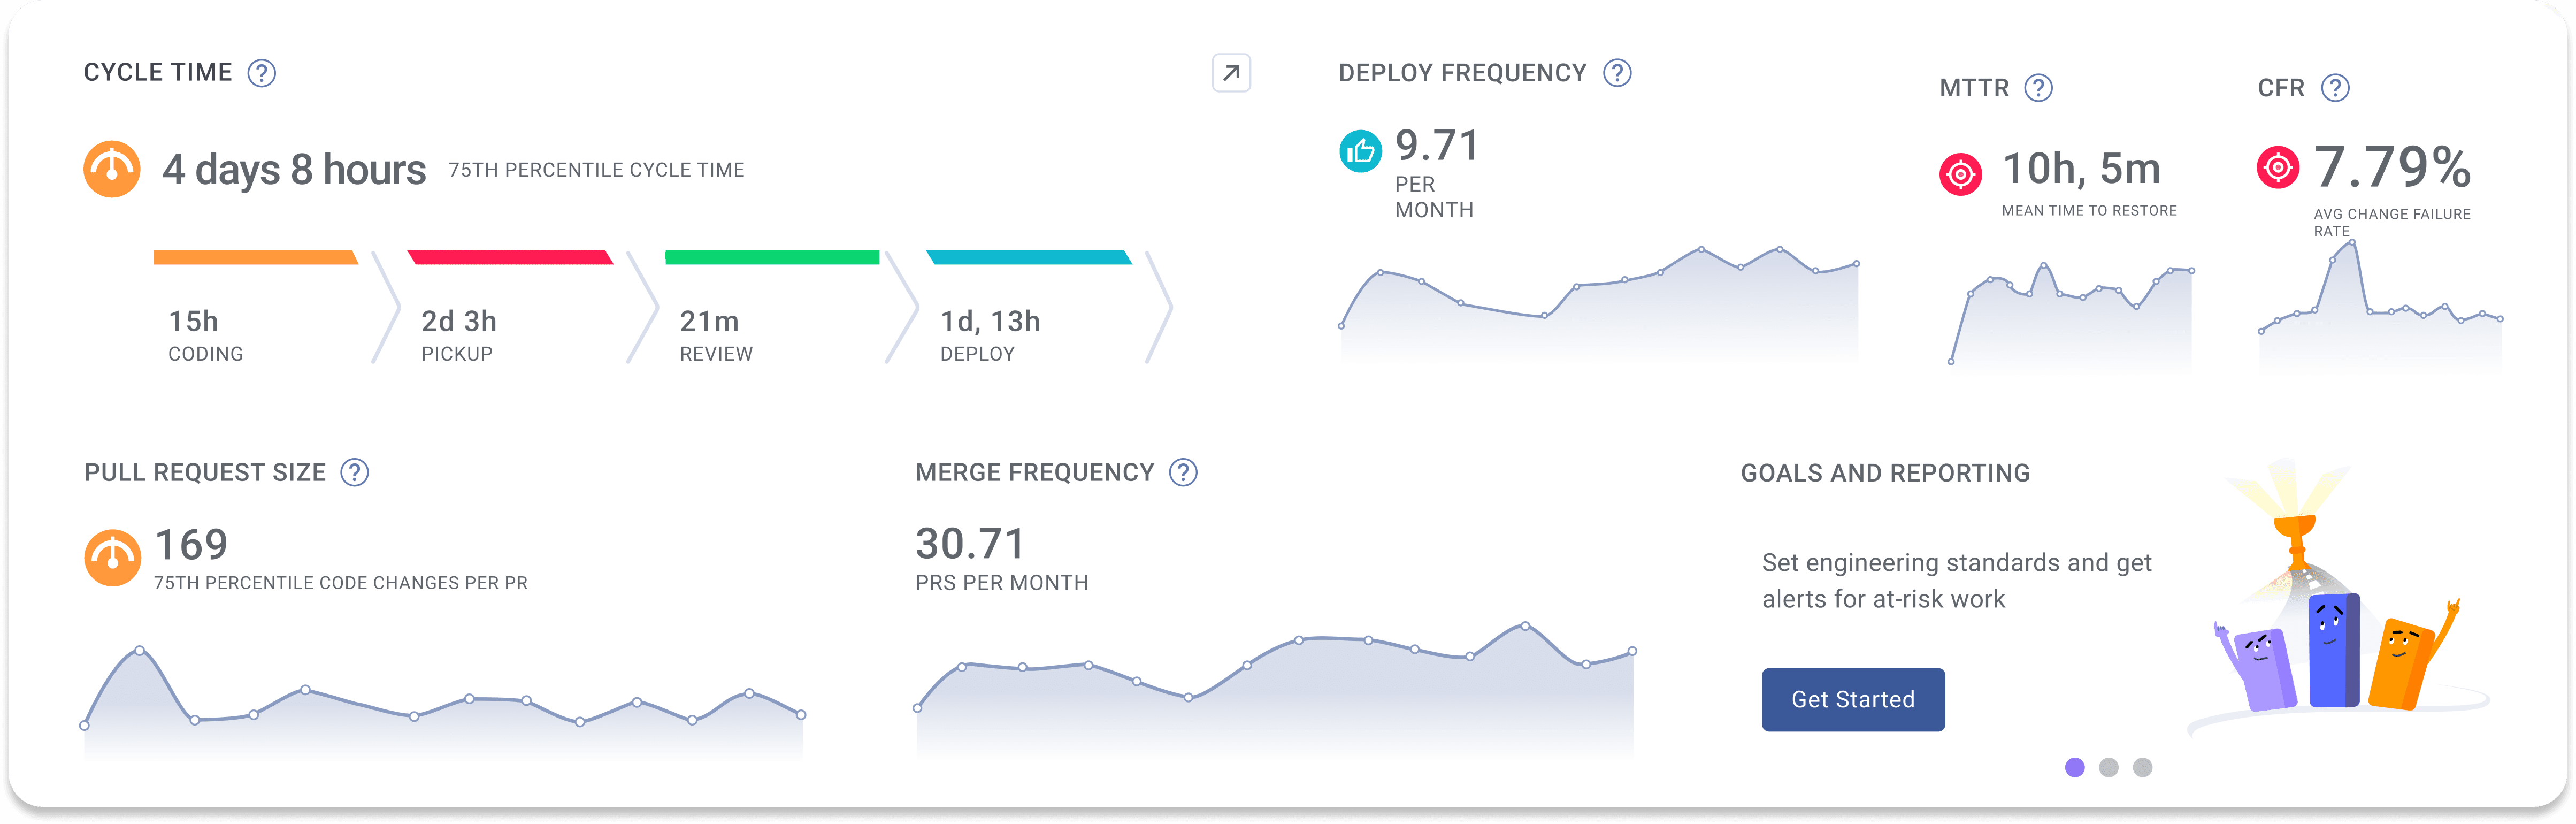
DORA Metrics
The DevOps Research and Assessment (DORA) group conducted one of the most influential studies on the topic of developer productivity. Over the course of nine years, they polled thousands of DevOps leaders and engineers to determine the four most important metrics for measuring team velocity and the stability of software development projects. Those four metrics are:
- Deployment Frequency – Measures how often code deploys into production. And it’s typically reported in deployments per day or deployments per week.
- Mean Lead Time for Changes (aka cycle time) – Calculates the average time from first commit to production release. It’s divided into 4 distinct phases: coding time, pickup time, review time, and deploy time. And it gives you a better understanding of bottlenecks and inefficiencies in your workflow.
- Mean Time to Recovery (MTTR) – Measures the average time recovering from a production failure or outage. It can be defined alternatively as the time between the report being created and the fix being deployed to production.
- Change Failure Rate – Tracks the percentage of code changes or deployments that lead to failures in production. Changes that result in a rollback, in production failing, or in production having a bug all contribute to this metric.
LinearB provides DORA metrics right out of the box so you can discover your DORA metrics in minutes. Get started today!
Developer Experience Metrics
Metrics that measure developer experience (DevEx) can also provide insight into productivity. While there may be some ambiquity in measuring developer satisfaction, there are plenty of quantitative markers that can help you determine the morale and engagement of developers, which directly impacts their productivity and overall job satisfaction. Developer experience metrics include:
- Idle or Wait Time: Otherwise known as developer toil, this metrics collection shows the time between the various phases of the pull request process. Idle time is the killer of productivity as it splits focus, creates a high cognitive load, and drives further slowdowns in the PR process
- Task Balance: Ensuring a healthy mix of tasks, including both bug fixes and engaging new challenges, to keep developers motivated and interested.
- Skill Expansion: Encouraging developers to explore new parts of the codebase and expand their skill sets, promoting continuous learning and growth.
- Knowledge Expansion: Continuously expanding knowledge of the codebase and learning new programming languages and technologies.
- Coding vs. Code Review: Balancing time spent on writing code with reviewing and providing meaningful feedback on others’ code to maintain high code quality standards.
- Unplanned and Added Work: Unplanned work is a normal part of any engineering organization. A healthy amount of planning and scoping flexibility is good, but it needs to be addressed when it begins to impact the delivery of roadmap items promised to the business.
- WIP: Managing work-in-progress (WIP) to avoid overloading developers, helping them maintain focus and avoid burnout. When your team is overstretched or balancing too many projects, errors and fatigue jeopardize productivity. Monitor the active branches and individual dev’s WIP load to help prevent burnout and mistakes.
Effectiveness Metrics
Developer productivity should also be measured by looking at how well engineering deliverables align with the needs of the business. Effectiveness metrics analyze this dimension of developer productivity and involve doing the right tasks that align with business goals. This has a profound impact on delivery timelines and project forecasting, and includes metrics like:
- Investment profile: This chart breaks down the work by issue types. It helps you determine if the engineering team is investing in the right types of work. Armed with this info, you can better balance competing priorities and strike a balance between creating new features and maintaining existing systems (keeping the lights on).
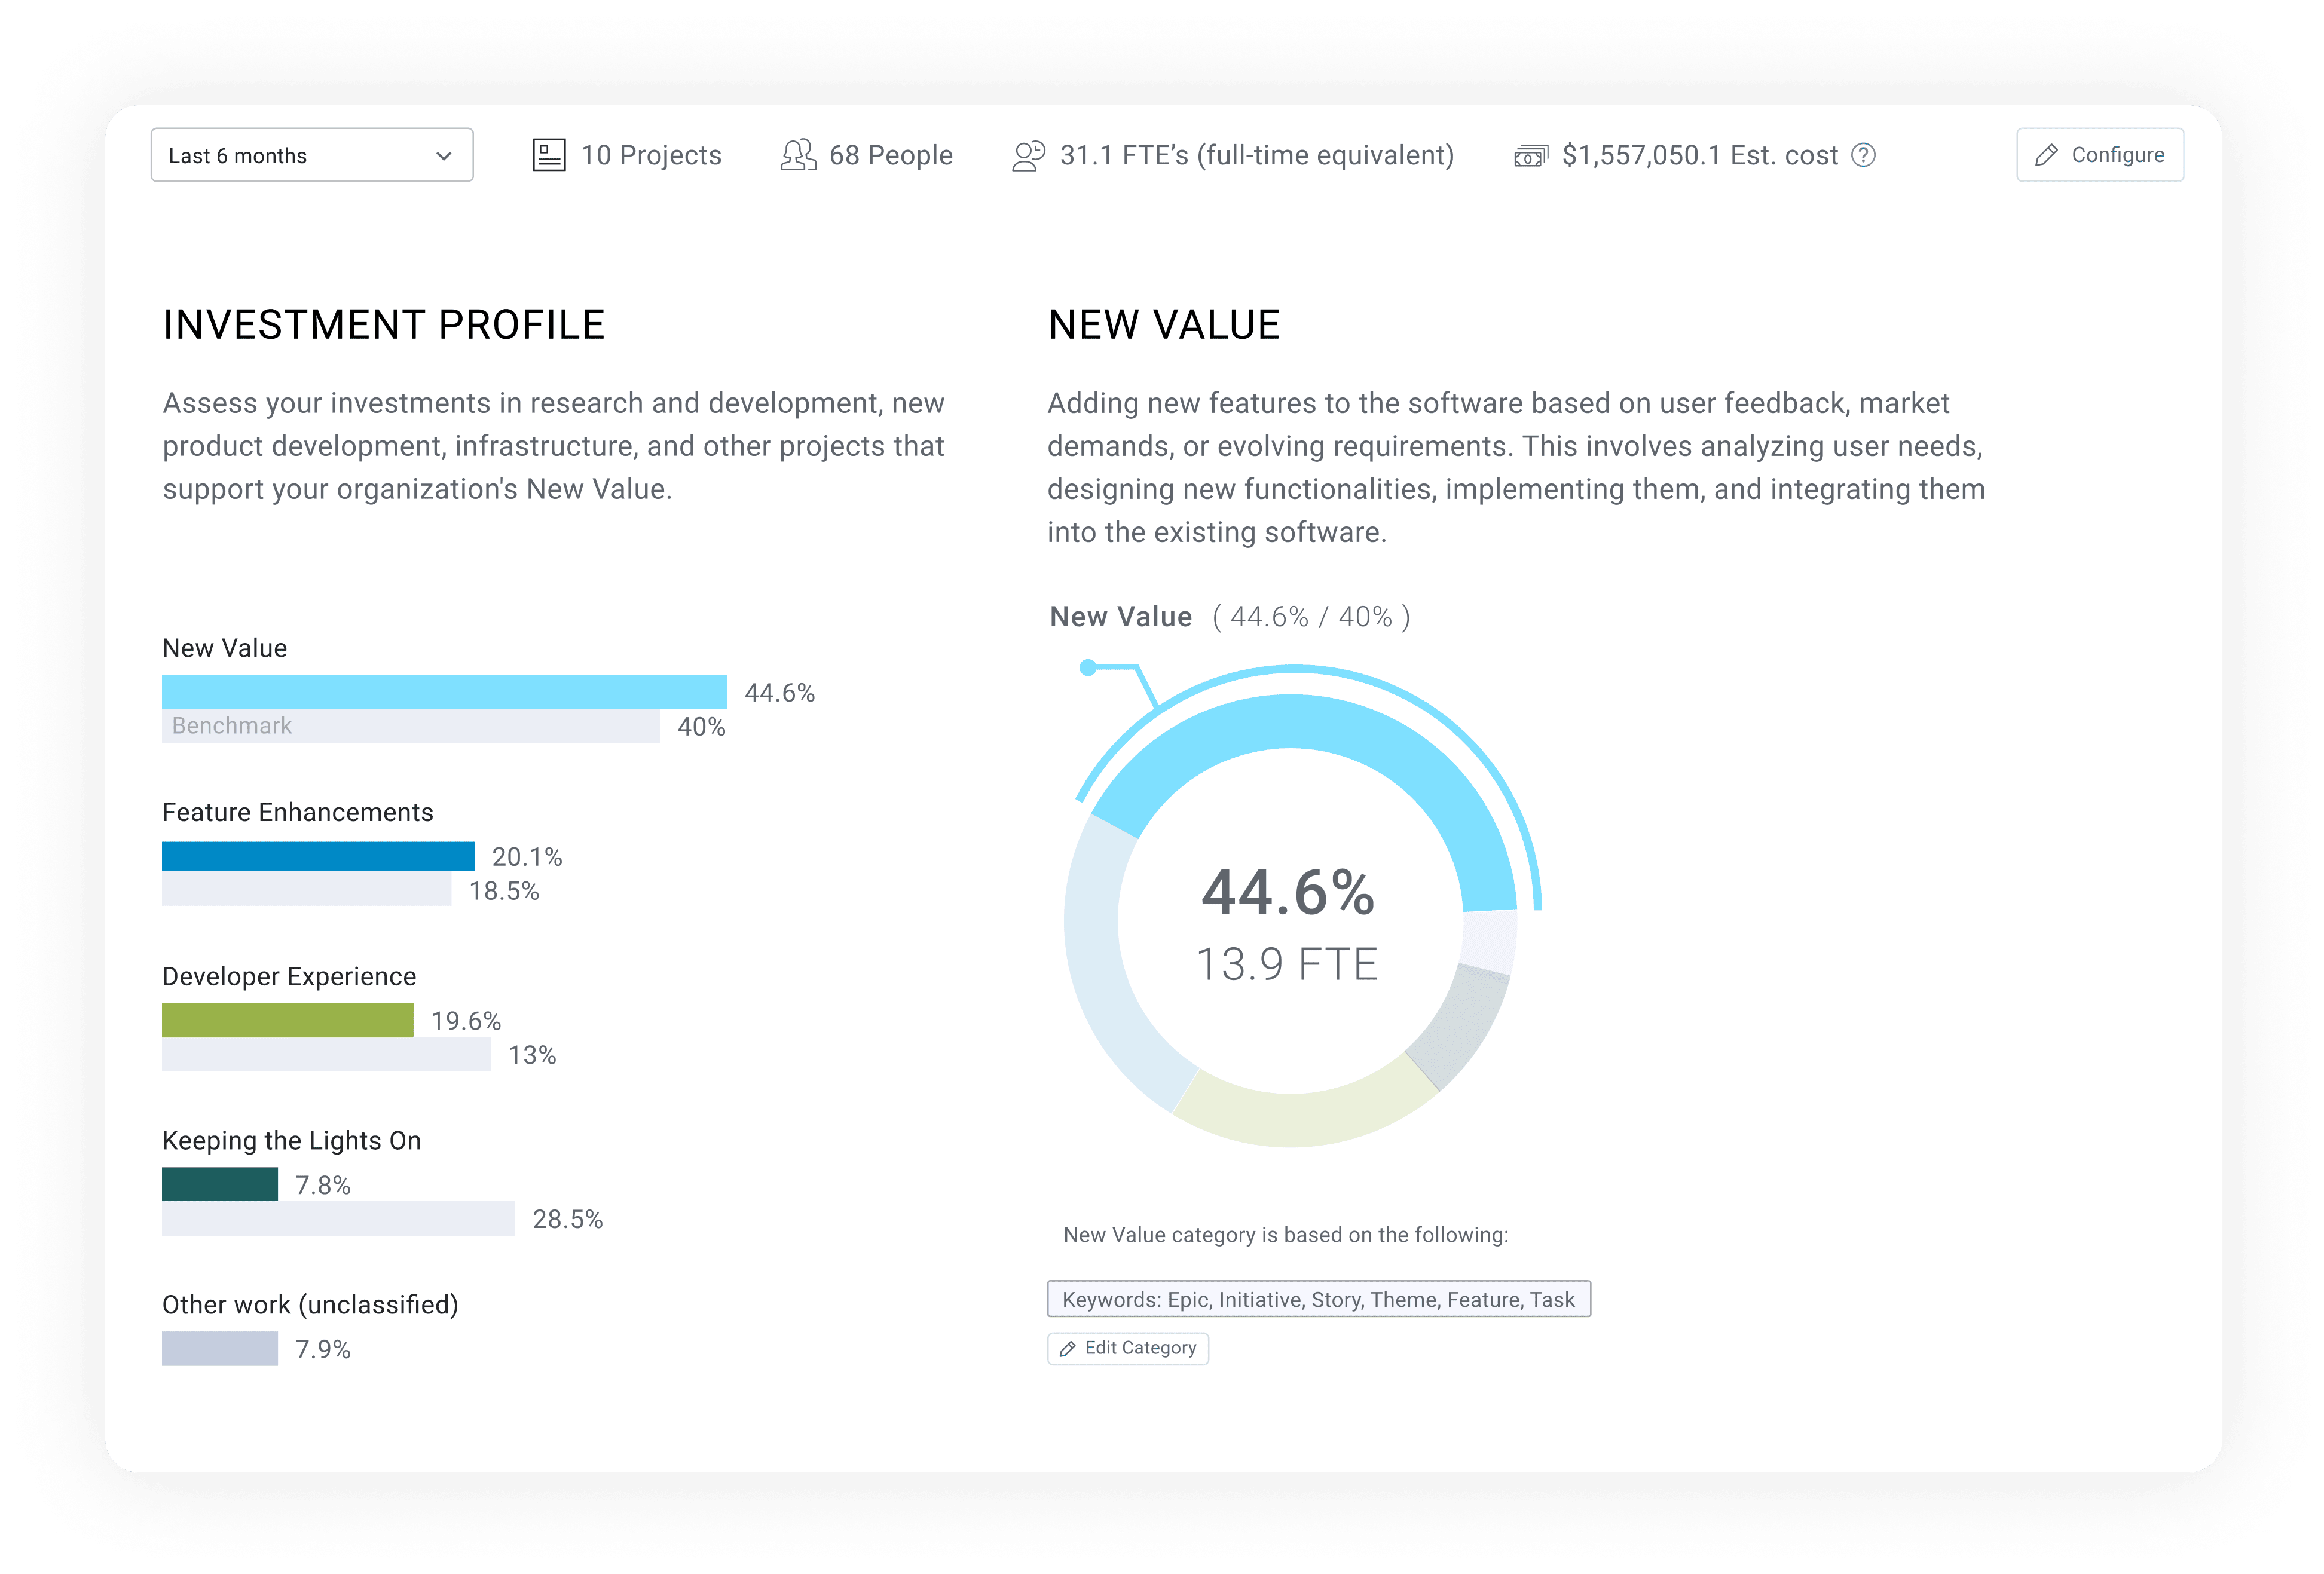
- Resource allocation: Resource allocation reports connect engineering projects and strategic epic investment to people effort in a simplified view that every stakeholder can understand. This context makes discussions about assigning the right people and the correct amount of people to projects easy.
- Accuracy Scores: Focusing on scoped work (Planning Accuracy) while maintaining operation flexibility to adapt to the regular ebb and flow of engineering organizations (Capacity Accuracy).
High Capacity Accuracy (85% - 115%) | Low Capacity Accuracy (<80%) | |
High Planning Accuracy (75% - 96%) | Your project and or team is doing extremely well! Keep it up! If other projects are not trending so well, consider moving some resources around | Your team scoped the iteration well, but they aren’t necessarily responding to normal changes and fluctuations Work on adapting to the needs and priorities of the business |
Low Planning Accuracy (<70%) | Execution is good, but you’re focusing on the wrong things Scope creep and unplanned work is taking up too much time Talk to PM about added work and prioritize your planned work | You’re taking on too much work – splitting focus and increasing delay risks You need to scope down and focus on your planned work Would be a good time to inquire about additional resources if possible |
- Meaningful Contributions: Making significant contributions to one’s business unit or area of ownership, ensuring that work has a tangible impact–this is informed by both resource allocation and investment strategy.
- Consistency: While predictability and keeping promises to the business is important, so is operational consistency. Teams should strive for consistent and steadily improving accuracy scores as well as cycle time to ensure accurate timeline forecasts and kept promises.
Benchmark Your Developer Productivity Against Industry Standards
Once you have baseline developer productivity metrics like the ones above, you’ll want to compare your teams’ performance toothers in your industry and then use this information to pinpoint areas that need improvement.
Our Engineering Metrics Benchmarks study provides you with the first report of this kind. After analyzing almost 2K engineering teams and over 3.6M pull requests, we identified four tiers (Elite, Strong, Fair, Needs Focus) for 15 engineering metrics.
These benchmarks are baked into our developer productivity platform, so right out of the box you can track your developer productivity and create working agreements about what needs to improve.
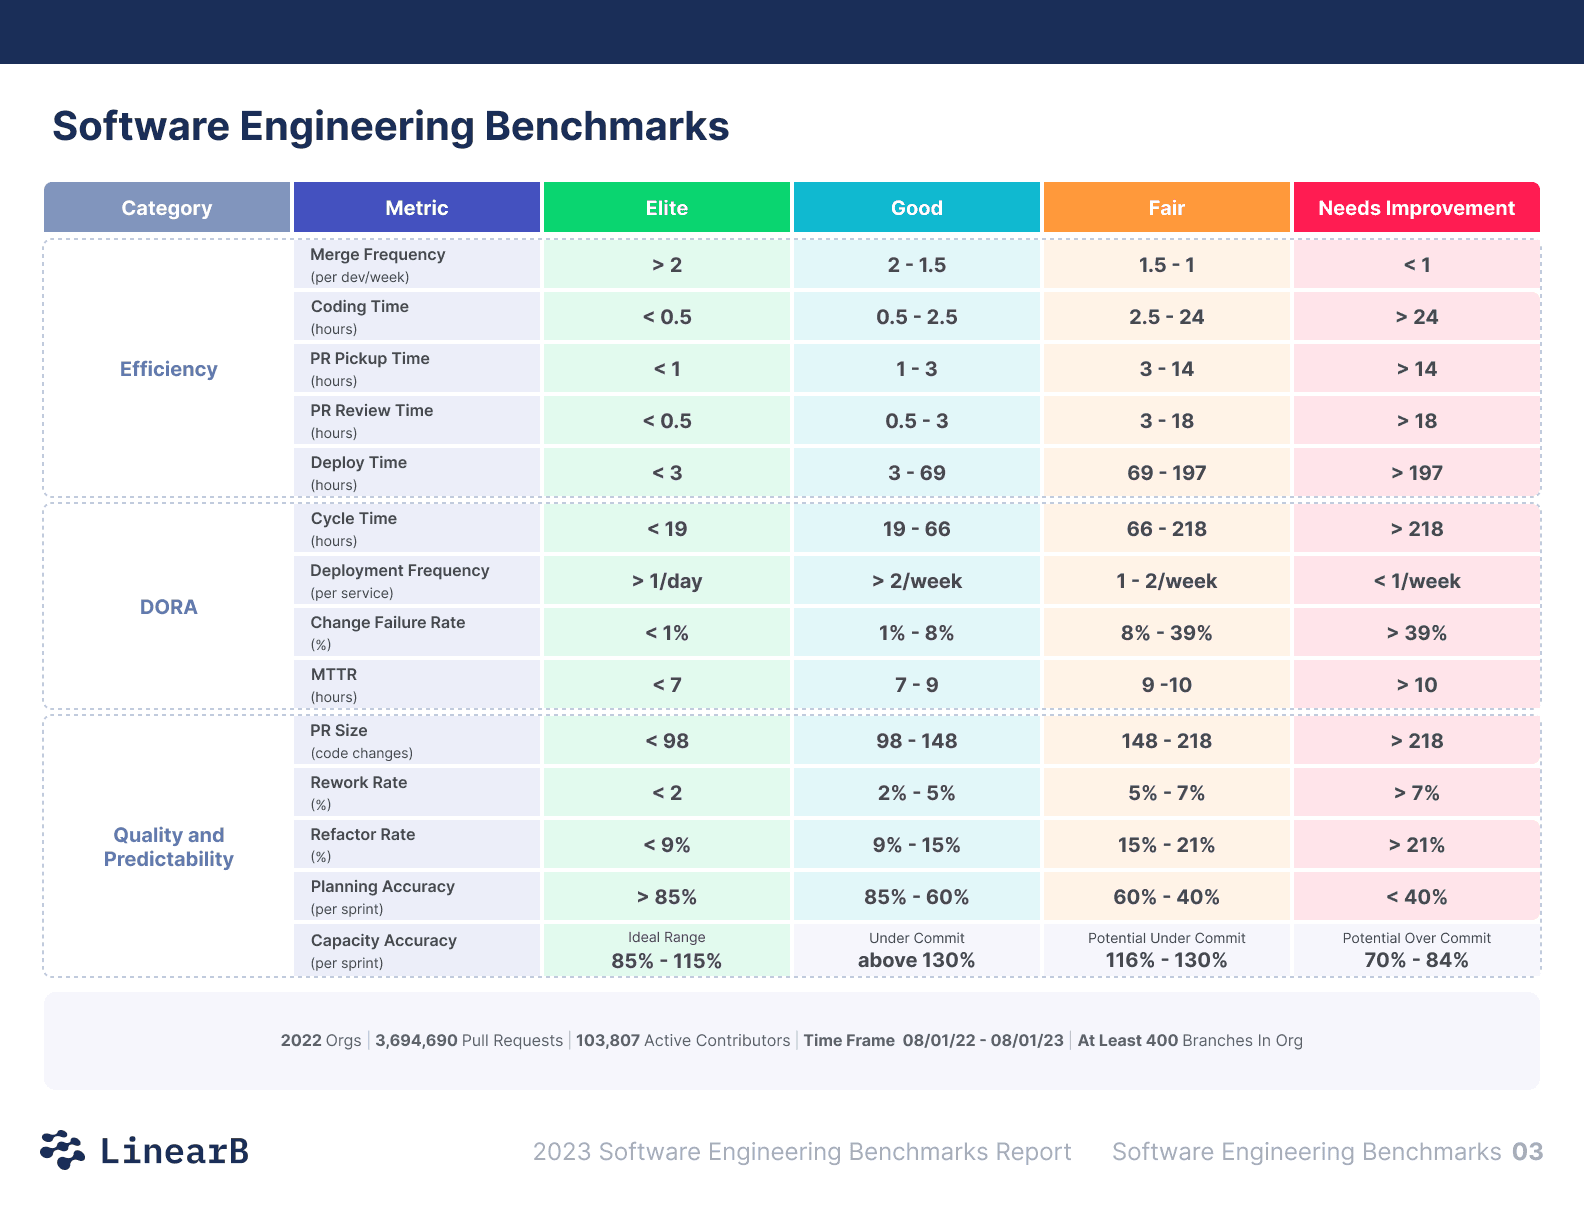
Want to learn more about being an elite engineering team? Download our 2024 Engineering Benchmarks Report here.
Start Improving Developer Productivity Today
Now that you know how to track developer productivity and identify areas for improvement, you need a platform that can also help you improve. Improving developer productivity starts with developer workflow optimization, which means helping developers shave time off non-coding tasks through automation and get back to doing what makes them happy, coding.
LinearB’s Software Engineering Intelligence platform includes two types of developer workflow automation tools: WorkerB and gitStream. Paired with our benchmarks and Team Goals features, this creates an easy-to-follow 3-step recipe for developer productivity improvement in a single tool.
But don’t take our word for it. Check out how our customer, Syngenta, uses LinearB to increase developer productivity and predictability.