DORA metrics help engineering teams identify delivery bottlenecks, reduce customer-impacting failures, and drive continuous improvement. This guide explains how to track, benchmark, and improve all four DORA metrics using Software Engineering Intelligence platforms to make data-driven decisions that increase engineering productivity and business value.
Is your engineering team struggling with slow delivery cycles? Are production failures creating customer trust issues? Or maybe you're just wondering why your developers spend more time putting out fires than building new features.
You're not alone. Engineering leaders everywhere face these challenges and the DORA metrics framework provides a proven, data-driven approach to identify and fix these critical delivery bottlenecks.
In this comprehensive guide, you'll discover:
- What DORA metrics are and why they're the gold standard for DevOps performance
- How to accurately track each metric across your development toolchain
- Actionable strategies to improve your scores and reach elite performance levels
- How Software Engineering Intelligence platforms like LinearB can automate the entire process
What is DORA? (DevOps Research & Assessment Explained)
The DevOps Research and Assessment (DORA) program defines metrics that help organizations measure and improve their software delivery performance. Gene Kim, Jex Humble, and Nicole Forsgren founded the organization in 2015, and Google Cloud acquired DORA in 2018.
The primary output of DORA's research is four key metrics that measure software delivery performance. These metrics, known collectively as the DORA metrics, have become the industry standard for evaluating DevOps productivity. Every year, the DORA research team publishes the State of DevOps Report, which contains benchmarks and performance indicators for DevOps teams. They update their metrics definitions as part of this report.
What are the Four DORA Metrics?
DORA metrics provide a quantitative way to measure your software delivery performance, focusing on four key areas that balance speed and stability
Deployment Frequency
Deployment frequency measures how often your organization successfully releases to production. Higher deployment frequency correlates with greater agility and faster time-to-market.
Change Lead Time
Change Lead Time is the time it takes for a commit to get into production. Shorter lead times mean your organization can respond faster to market changes and customer needs.
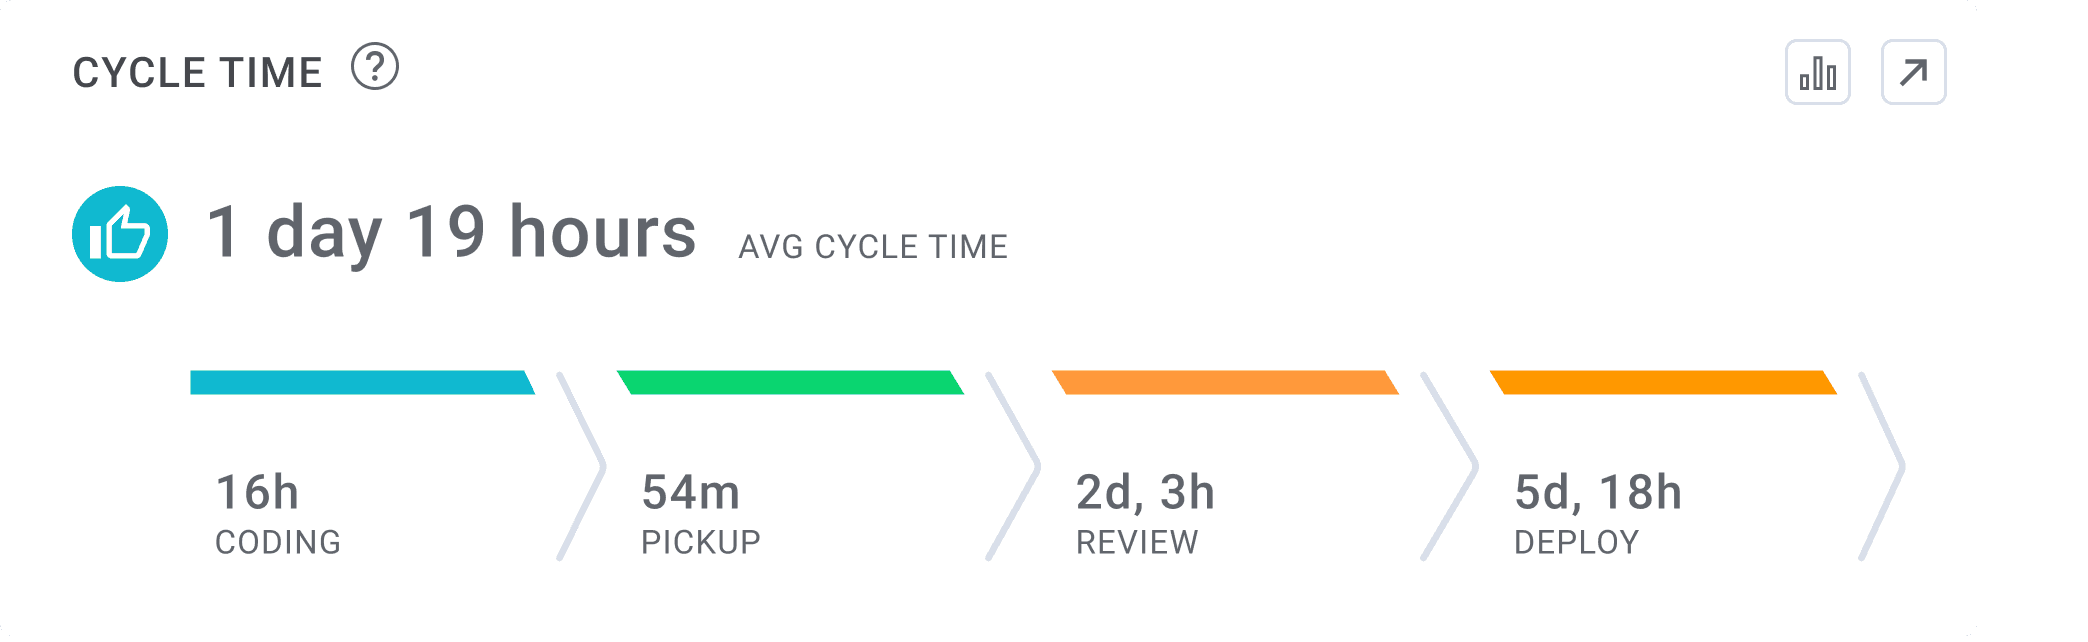
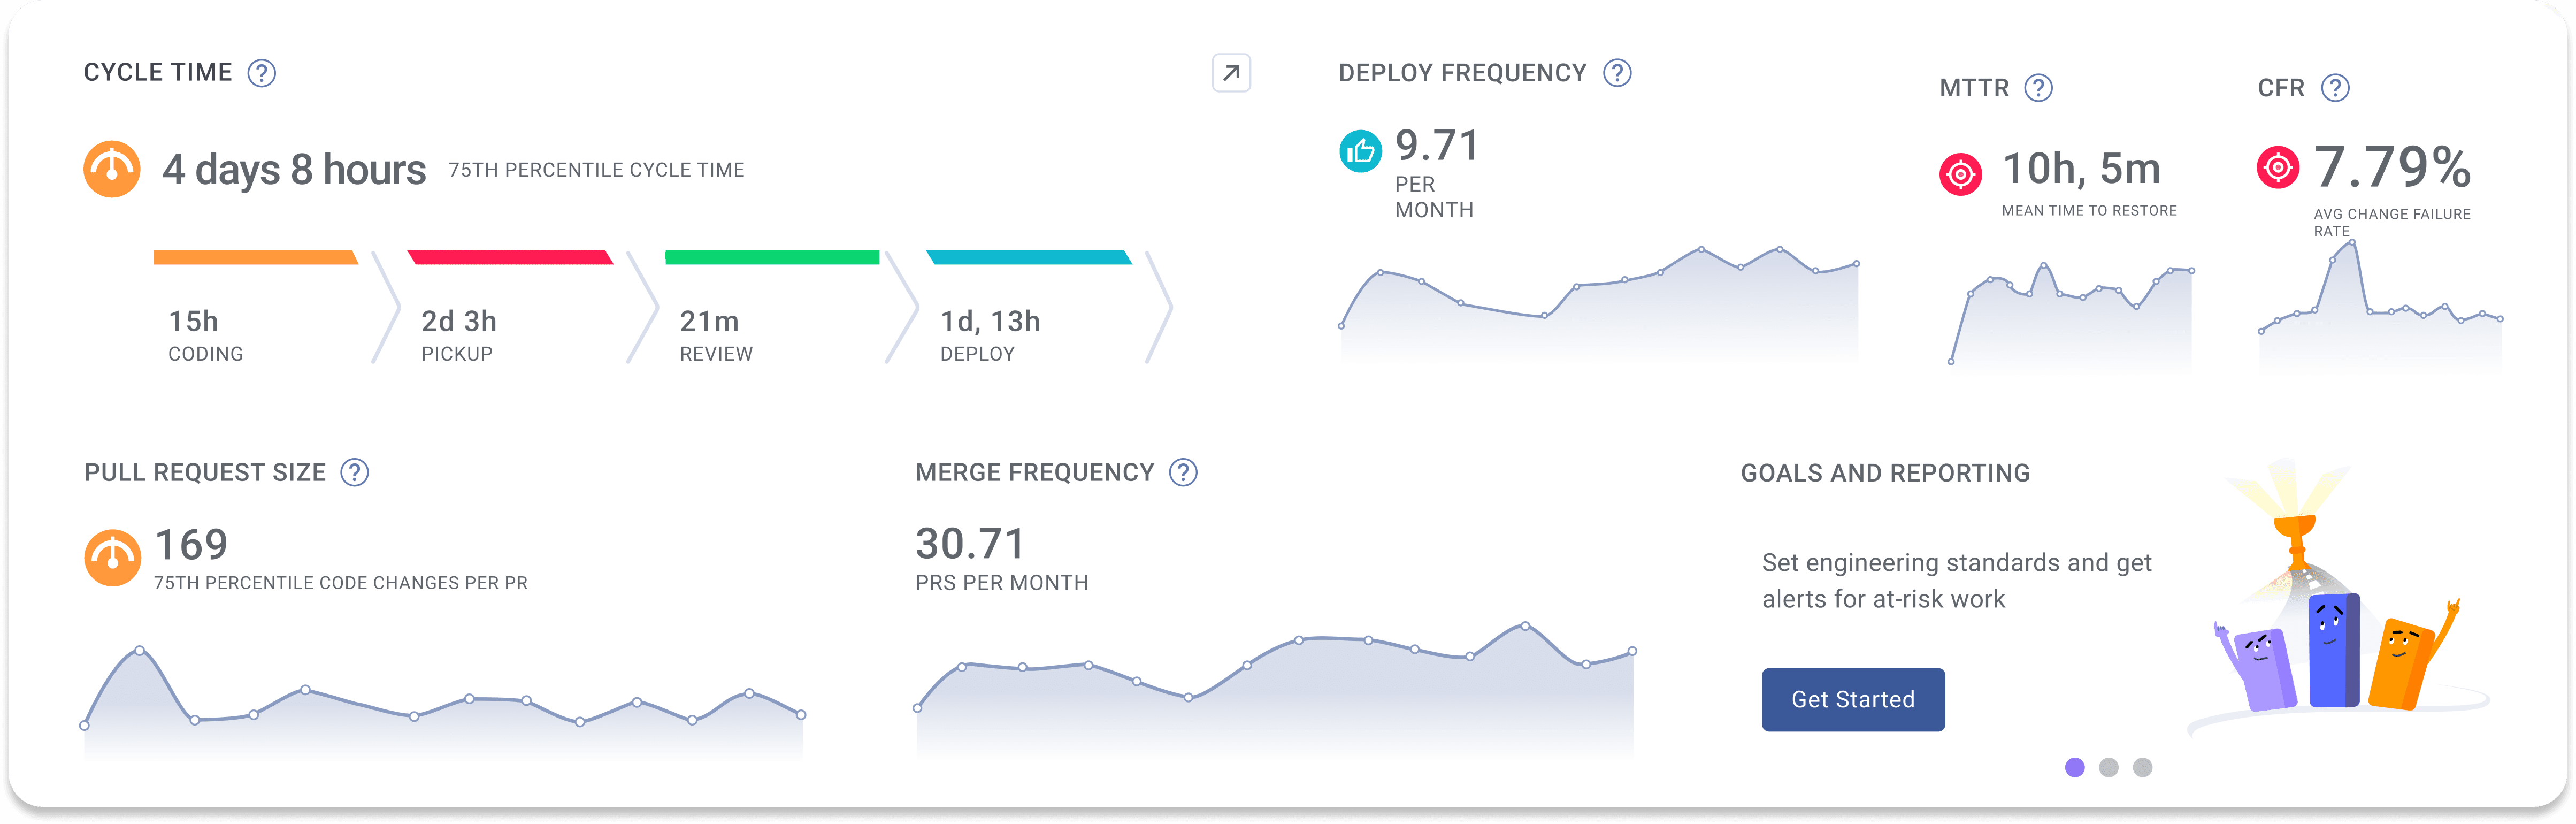
Change Lead Time (sometimes called Cycle Time) breaks down into these critical components:
- Coding time: The period between the first commit to a branch and opening a PR to merge this branch into the primary branch.
- Pickup time: The time between PR creation and the start of code review.
- Review time: The period between the start of code review and when the code is merged.
- Deploy time: The time between code being ready to merge and when your CD system deploys it to production.
Change Fail Percentage (CFP)
CFP measures the rate of deployments that lead to a failure in production, and it is sometimes expressed as Change Failure Rate (CFR). Lower failure rates indicate higher quality releases and less time spent on unplanned work.
Failed Deployment Recovery Time (FDRT)
FDRT measures how long it takes to recover from a failure in production, it is often expressed as Mean Time To Restore (MTTR) which measures the average FDRT over time. Faster recovery times reduce customer impact and business disruption.
Together, these four metrics offer a balanced view of your engineering performance, allowing you to track and improve both the speed and reliability of your software delivery process.
Why Should You Track DORA Metrics, and What is the Business Case?
Are you wondering why so many high-performing engineering organizations focus on DORA metrics? The answer is simple these metrics directly correlate with business outcomes.
Teams that excel at DORA metrics are:
- 2x more likely to exceed their organizational performance goals
- 1.8x more likely to report better customer satisfaction
- Significantly more effective at streamlining operational efficiency
Whether you're building products for end users or creating internal tools, reliably delivering software directly impacts your bottom line.
DORA metrics help you answer critical questions about your engineering effectiveness:
- Are we quickly delivering value to customers? (Deployment Frequency, Change Lead Time)
- Are quality issues slowing us down? (Change Fail Percentage)
- How resilient is our delivery pipeline? (Failed Deployment Recovery Time)
- Where are our biggest delivery bottlenecks? (Change Lead Time)
By tracking these metrics, you can pinpoint exactly where your engineering process needs improvement. Are code reviews creating a bottleneck? Are deployments failing due to inadequate testing? DORA metrics provide the visibility to make informed decisions about process improvements and investment opportunities.
How to Track DORA Metrics Across Your DevOps Toolchain
The biggest challenge in tracking DORA metrics is correlating data across multiple tools in your software development process. You need to connect data from your git repositories, project management tools, incident response platforms, and CI/CD services.
Git Repositories (GitHub, GitLab, BitBucket)
Your git repos contain the bulk of your DORA metrics data. Commits, code reviews, and merge pipelines all provide essential data for tracking Change Lead Time. Additionally, Change Fail Percentage and Failed Deployment Recovery Time both require git metadata as part of their calculations.
Project Management Tools (Jira, Shortcut, Azure Boards)
Your project management system provides context about the inputs and outputs of your engineering team and helps measure the business impact of developer activities. For many organizations, project management data defines the start of their Change Lead Time and establishes what constitutes a "failure" for Change Fail Percentage.
Incident Management Platforms (PagerDuty, DataDog)
Your incident management platform contains timestamps for when an incident starts, when someone initiates resolution efforts, and when the issue is resolved. Without this data, it's impossible to accurately track how your team recovers from failure.
Deployment Tools (GitHub Actions, GitLab CI, CircleCI, Harness)
All four DORA metrics require deployment data, and one of the biggest challenges is accounting for variability in deployment processes across different teams and tools. Every organization defines "done" differently whether it's code deployed to production, added to a release, or committed to a pre-production environment.
Using Software Engineering Intelligence to Automate DORA Tracking
While manually measuring these metrics is possible, the process is time-consuming and error-prone. Most high-performing organizations use automated tools that integrate with their existing CI/CD pipelines.
Software Engineering Intelligence (SEI) platforms like LinearB connect these data sources to provide:
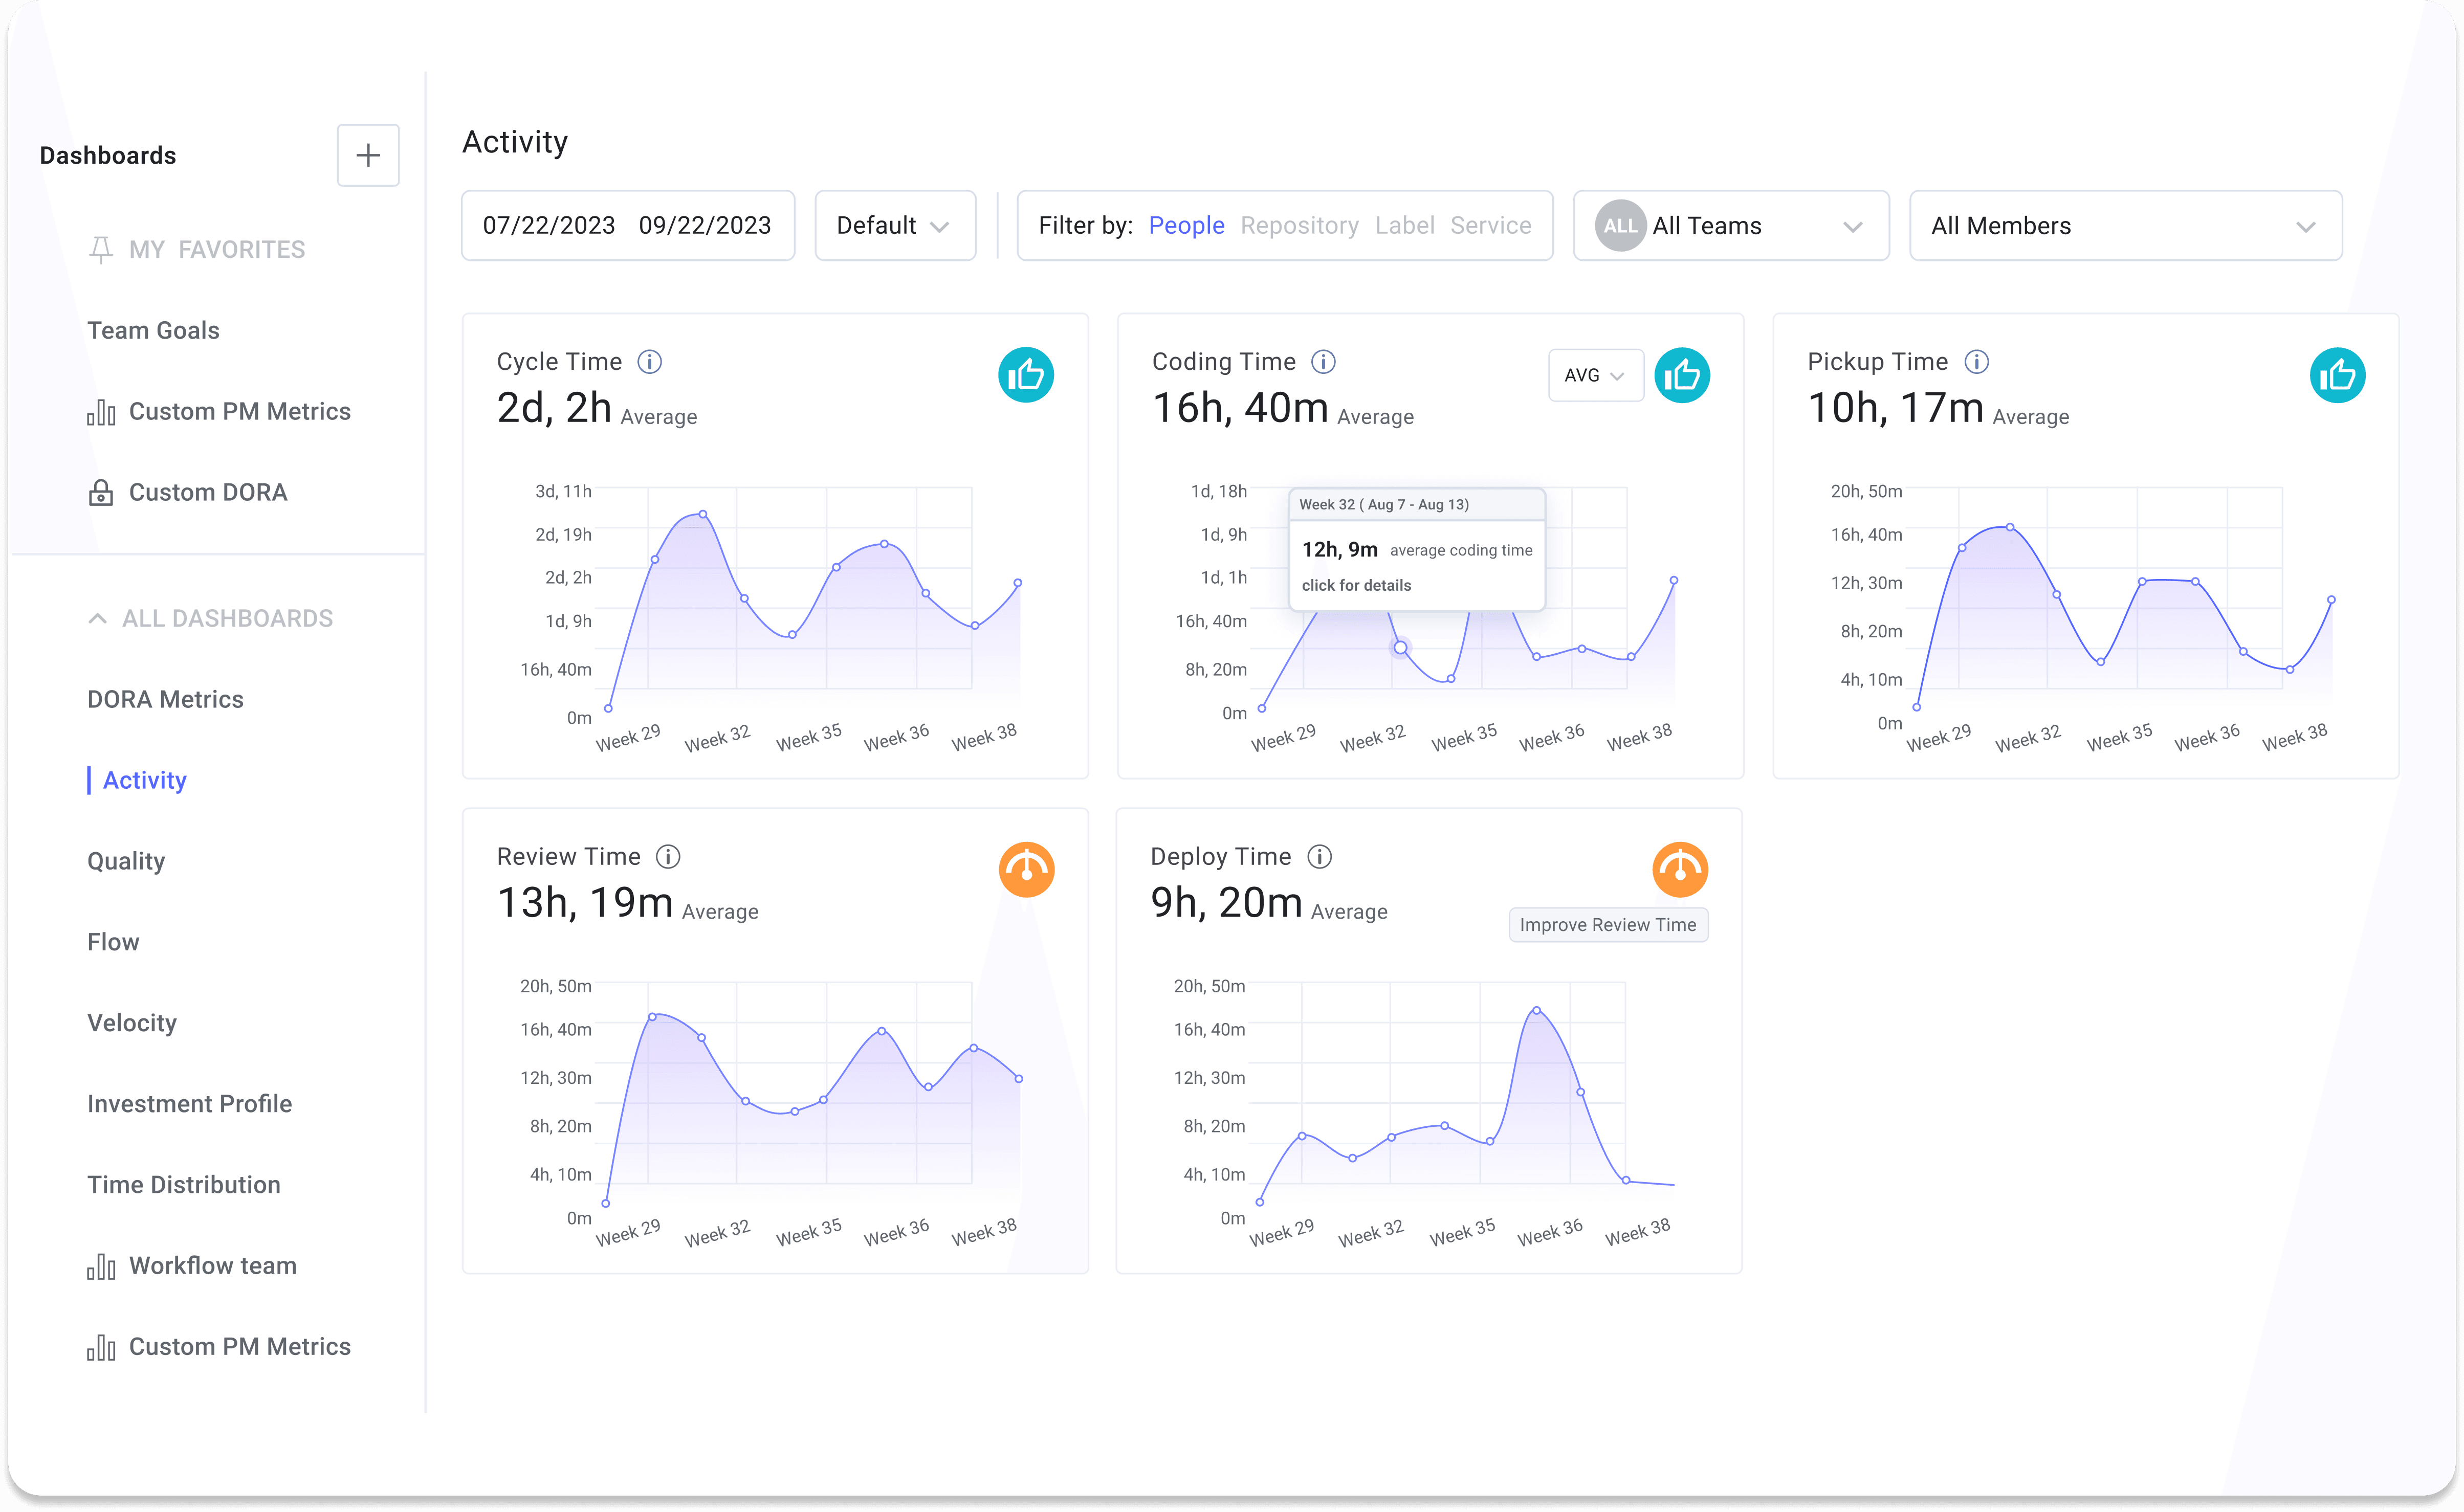
- Real-time DORA metrics dashboards that can be filtered by team, project, or repository
- Automated bottleneck detection that identifies workflow inefficiencies
- Personalized notifications that help developers stay on track with team goals
- Trend analysis that shows improvement (or regression) over time
DORA vs. SPACE vs. DevEx vs. DX Core 4: Understanding the Frameworks
Engineering leaders often ask which framework they should use to measure and improve developer productivity. Each framework serves different purposes and can be combined for a more comprehensive approach.
DORA: Software Delivery Performance
Focus: Software delivery capabilities
Best for: Organizations going through digital transformation, adopting DevOps practices, or needing to benchmark delivery capabilities
Key metrics: Deployment Frequency, Change Lead Time, Change Fail Percentage, Failed Deployment Recovery Time
Strengths:
- Provides clear benchmarks (Elite, High, Medium, Low performers)
- Based on rigorous research data from thousands of companies
- Easy to understand and communicate to stakeholders
- Focuses on outcomes rather than individual developer output
Limitations:
- Measures delivery capabilities, not developer productivity directly
- Doesn't capture developer experience or satisfaction
- Limited insights into root causes of bottlenecks
- Doesn't address collaboration or communication aspects
SPACE: Holistic Developer Productivity
Focus: Comprehensive definition of developer productivity
Best for: Organizations developing a balanced understanding of productivity and identifying gaps in their current metrics
Key dimensions: Satisfaction and well-being, Performance, Activity, Communication and collaboration, Efficiency and flow
Strengths:
- Provides a balanced, holistic view of productivity
- Includes both workflow and perception metrics
- Addresses often-overlooked aspects like developer satisfaction
- Offers flexibility to create metrics suitable for your context
Limitations:
- Abstract framework rather than prescriptive metrics
- May feel "squishy" to leaders used to quantitative measures
- Can be difficult to understand due to its breadth
- Requires more effort to implement from scratch
Learn more about the SPACE Framework here →
DevEx: Developer Experience
Focus: Developer-centric approach to productivity improvement
Best for: Platform engineering teams, engineering leaders looking to reduce friction and improve developer experience
Key dimensions: Feedback loops, Cognitive load, Flow state
Strengths:
- Focuses on the lived experiences of developers
- Identifies high-impact areas for productivity improvement
- Provides a framework for categorizing friction points
- Connects perception and workflow metrics
Limitations:
- Relies heavily on survey data, which requires careful implementation and is subject to bias
- Surveys need thoughtful deployment to ensure actionable insights
- May face resistance from leaders unfamiliar with developer experience concepts
Core 4: Unified Metrics Framework
Focus: Streamlined metrics suite that combines elements from all frameworks
Best for: Organizations wanting a ready-to-implement, balanced approach to productivity measurement
Key dimensions: Speed, Effectiveness, Quality, Impact
Strengths:
- Includes both technical and business impact metrics
- Counterbalances metrics to prevent optimization tradeoffs
Limitations:
- Incorporates proprietary metrics that can’t be validated without vendor support.
- Includes diffs per engineer metric, which requires careful implementation
- Most of the metrics overlap with other frameworks like DORA
- Relatively new compared to established frameworks
Choosing the Right Framework(s)
Rather than viewing these frameworks as competing alternatives, consider how they complement each other:
- For digital transformation: Start with DORA to establish delivery benchmarks
- For holistic understanding: Use SPACE to identify gaps in your productivity definition
- For improving developer experience: Apply DevEx to understand and address friction points
Many organizations successfully use multiple frameworks together, with SPACE providing the mental model, DORA offering delivery metrics, DevEx guiding experience improvements, and Core 4 providing a streamlined implementation approach.
Limitations of Existing Frameworks
It's important to recognize that no metrics framework can be universally applied to all situations. Each organization has unique contexts, challenges, and goals that may require customized approaches to measurement.
All of the frameworks discussed above have gaps in coverage, missing valuable metrics that many engineering organizations find useful:
- Planning and capacity accuracy: How accurately teams estimate and deliver on planned work
- Rework percentage: Amount of code that needs to be rewritten or fixed after initial implementation
- Review depth and quality: Thoroughness of code reviews and resulting code quality improvements
- Technical debt management: Tracking and addressing accumulated technical debt
- Knowledge sharing: How effectively information flows across engineering teams
- Architecture stability: Frequency and impact of architecture-related issues
- Infrastructure reliability: Uptime, performance, and resilience of development infrastructure
- Cross-team dependencies: How effectively teams manage dependencies on other teams
The most effective approach is to start with a framework that aligns closest with your immediate goals, supplement it with metrics from other frameworks to address gaps, and continually evolve your measurement strategy as your organization matures. Remember that metrics are meant to guide improvement, not serve as targets themselves focus on the outcomes they represent rather than the numbers in isolation.
Learn how to move Beyond DORA Frameworks to run a comprehensive data-driven engineering practice →
How to Improve Your DORA Metrics (Practical Strategies)
Tracking metrics is just the beginning. Here are practical, actionable strategies for systematically improving each DORA metric.
How to Increase Deployment Frequency
High deployment frequency results from well-scoped code changes, streamlined merge processes, and efficient CI/CD pipelines. Teams with high deployment rates enjoy greater project predictability and increased user trust.
Three ways to improve deployment frequency:
- Release early and often by shipping smaller, more manageable chunks of code. Set team goals to limit PR size, and use automation to flag large PRs that might slow down your pipeline.
- Automate your merge process with policy-as-code that sets clear expectations. Reduce manual reviews where possible and implement intelligent routing to get PRs to the right reviewers faster.
- Strengthen your CI/CD pipeline with parallel testing and infrastructure optimization. Look for bottlenecks in your build system, testing framework, or deployment process.
Read our complete guide on improving deployment frequency →
How to Reduce Change Lead Time
Change Lead Time offers the most direct opportunities for improving engineering efficiency because it represents the full journey of getting software to your customers.
Three ways to improve Change Lead Time:
- Benchmark your performance against industry standards to identify the biggest bottlenecks in your workflow.
- Streamline your merge pathways by automating manual tasks, unblocking low-risk changes, and routing PRs to code experts who can review them quickly.
- Optimize your CI/CD tooling to automate scanning, testing, and build requirements. Use programmable workflows to empower teams while providing guardrails.
Learn how to master Lead Time for Changes →
How to Reduce Change Failure Percentage
Change Failure Percentage directly impacts your product's reliability and customer trust. High failure rates also reduce developer productivity as teams manage rollbacks and hotfixes that disrupt their planned work.
Three ways to improve Change Failure Percentage:
- Standardize testing practices across your engineering organization. Use automation to maintain consistency in unit, integration, and end-to-end testing.
- Optimize code reviews by ensuring product and engineering experts evaluate all code before it reaches production. Use automated tools to reduce reviewer cognitive load.
- Implement phased deployments with feature flags to gradually roll out new code. Improve your CI/CD automation to identify and roll back risky changes before they impact users.
Discover how to improve Change Failure Percentage →
How to Improve Failed Deployment Recovery Time
Fast recovery from failures is critical for maintaining business continuity and customer trust. The less time your team spends fixing broken deployments, the more time they have to build new features.
Three ways to improve Failed Deployment Recovery Time:
- Equip your team with the right tools and training to respond to incidents quickly. Invest in stress testing and pre-emptive fortification as reliability improves.
- Conduct blameless post-mortems after each failure to identify root causes. Build a culture of continuous improvement that turns incidents into learning opportunities.
- Automate incident response to quickly organize response teams and notify stakeholders when their support is needed.
Learn strategies to reduce Failed Deployment Recovery Time →
Case Study: How Syngenta Used DORA Metrics to Transform Engineering Performance
Let's look at a real-world success story that demonstrates the power of implementing DORA metrics effectively.
The Challenge: Scaling Engineering Operations
Syngenta, a global leader in agricultural technology, faced significant challenges as they scaled their engineering organization from 150 to 400 developers:
- Global collaboration issues across distributed teams
- System complexity spanning 4 platforms and 11 consumer apps
- Inefficient workflows with idle time and handoffs between asynchronous teams
- Lack of visibility into engineering efficiency and effectiveness
The team needed clear answers to fundamental questions:
- "Are we working efficiently?"
- "Are we working effectively?"
- "Are we working safely?"
The Solution: Software Engineering Intelligence + DORA Metrics
Syngenta implemented a metrics program centered on DORA metrics and other leading indicators through LinearB's Software Engineering Intelligence (SEI+) platform. Their approach focused on:
- Data-driven decision making: Tracking core engineering health metrics
- Programmable workflows: Automating routine tasks to reduce friction
- Developer experience: Maintaining productivity while enforcing standards
- Shared ownership: Empowering teams to identify and address bottlenecks
The Results: Dramatic Improvement in Just Six Months
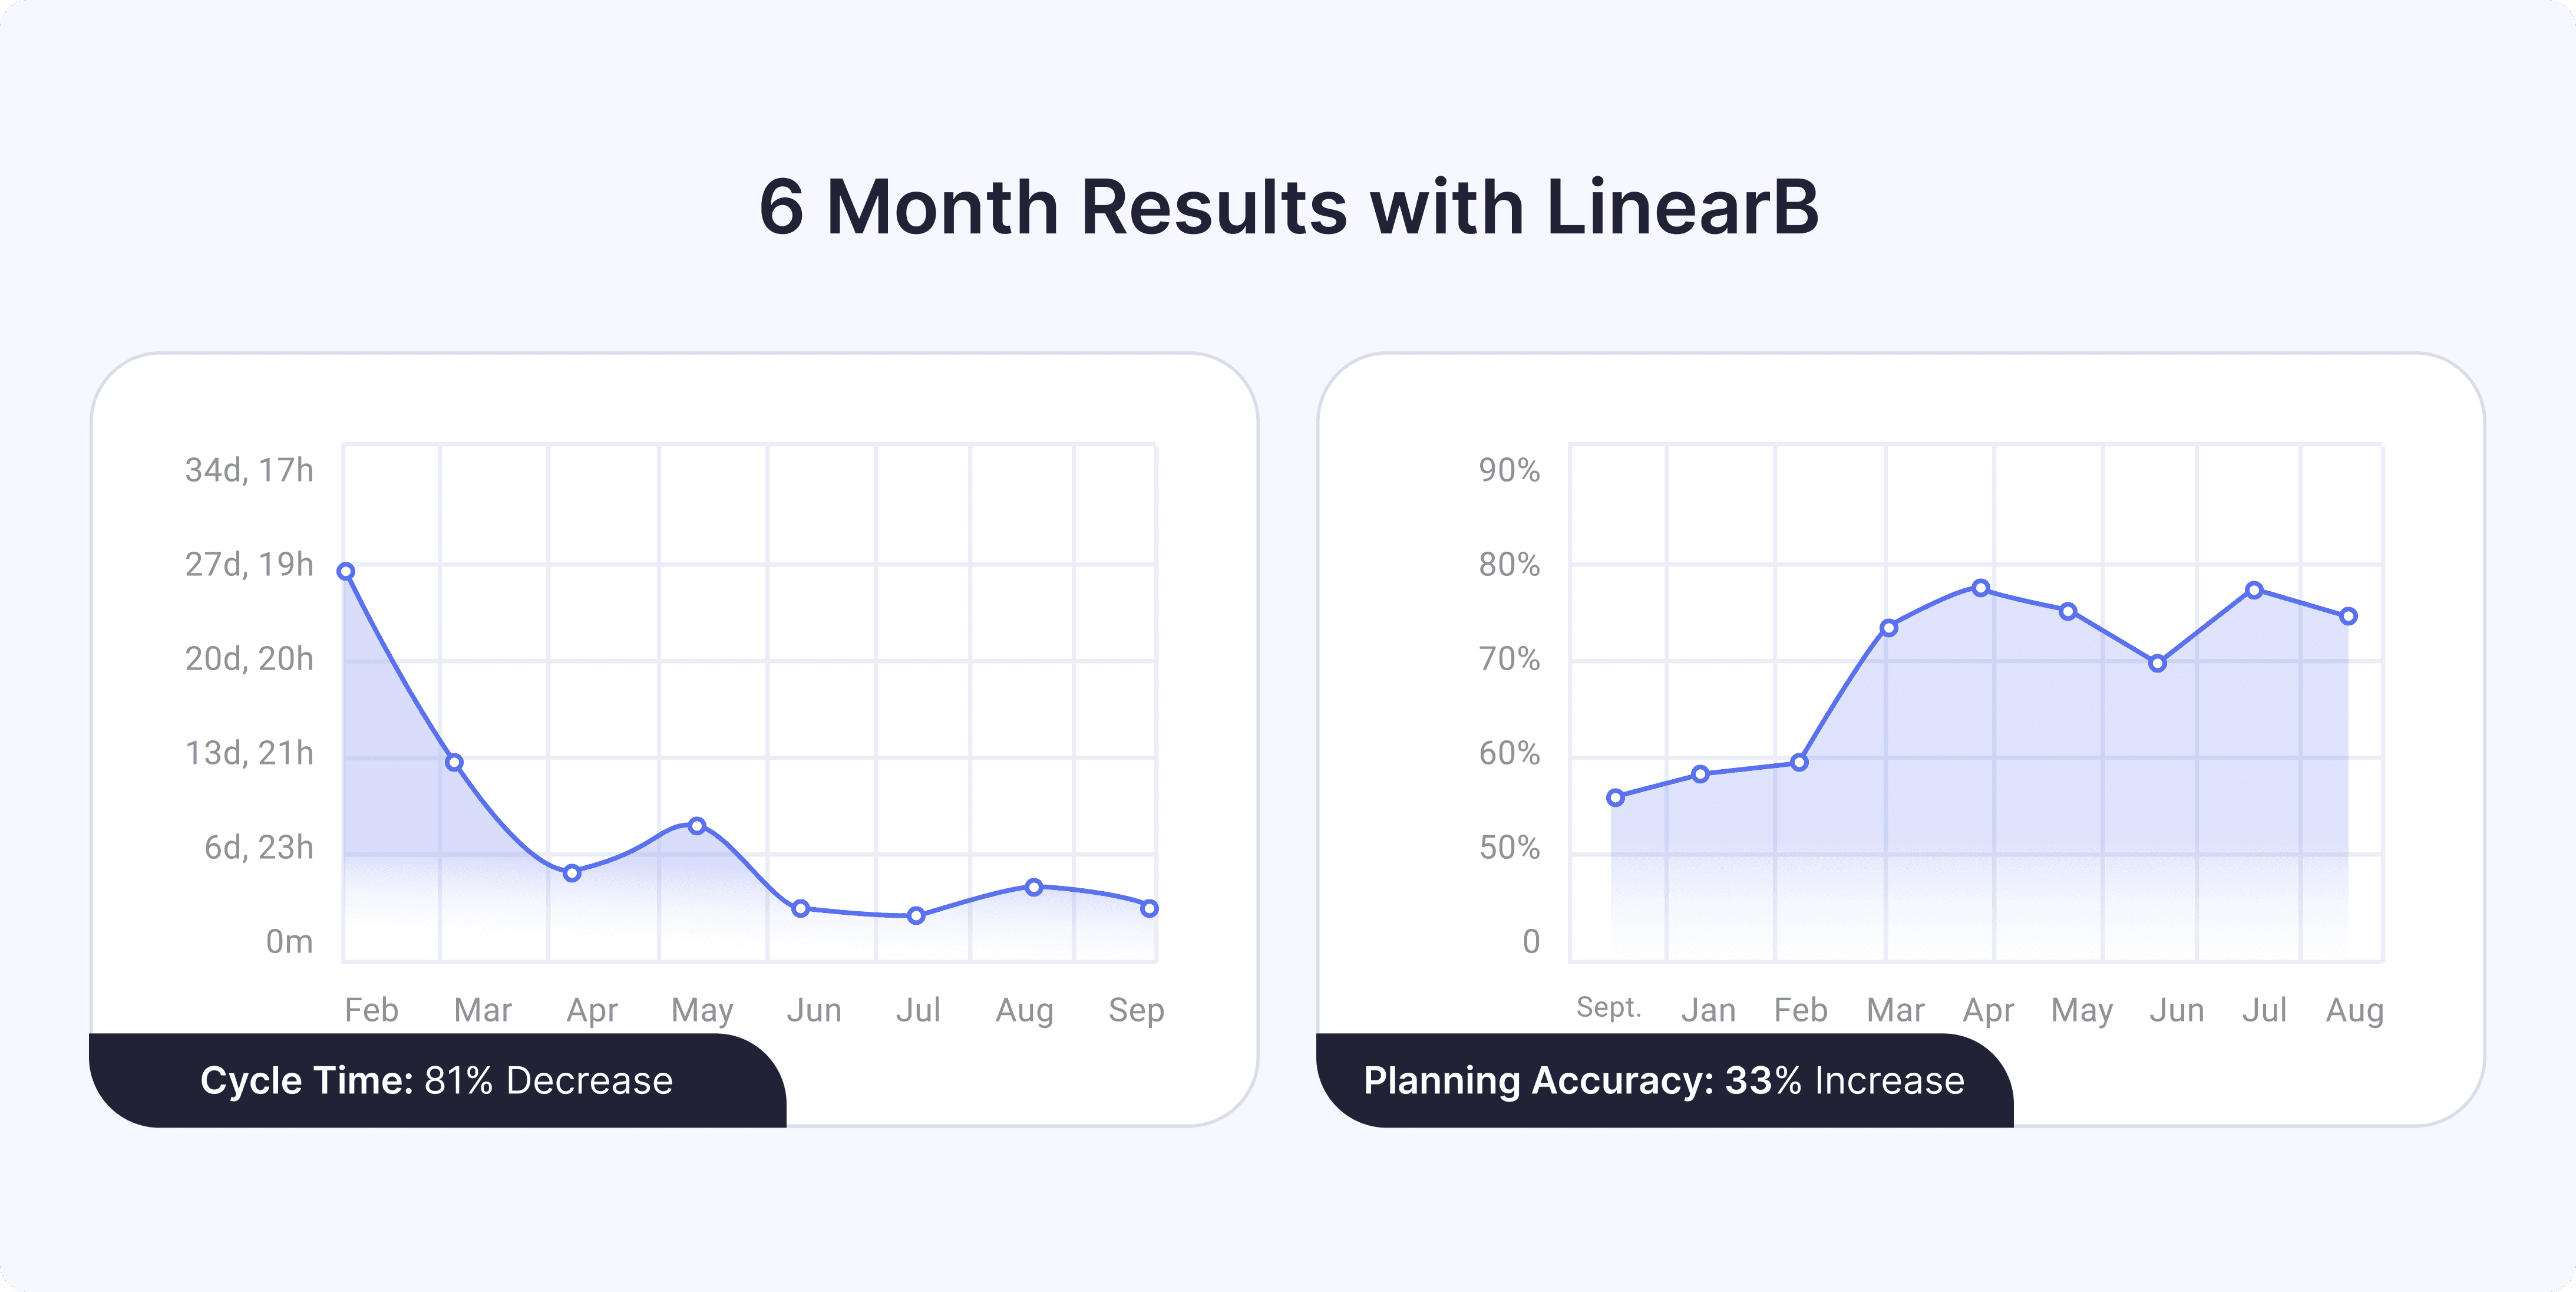
By implementing DORA metrics and workflow automation, Syngenta achieved remarkable results:
- 81% reduction in Cycle Time (Change Lead Time)
- 33% increase in Planning Accuracy
- Significant decrease in PR pickup and review times
- More predictable project delivery
Beyond the metrics, Syngenta experienced cultural and organizational benefits:
- Greater ownership among engineering teams
- Higher planning and execution success rates
- Establishment of operational rigor with shared definitions of "done"
- More proactive risk communication
- A transparent, sharing-focused culture
What makes Syngenta's story particularly impressive is that they achieved these improvements while simultaneously scaling their engineering organization by more than 2.5x.
"The visibility into these foundational KPIs including the DORA framework helped us ask ourselves—and answer—fundamental questions about our engineering organization." — Jason Krohn, Global Head of Delivery, Syngenta
This case study demonstrates that with the right approach, organizations can make dramatic improvements in their DORA metrics regardless of size or complexity.
Read the full case study with Syngenta here →
What Does Elite DORA Metrics Performance Look Like? (Benchmarks)
Every year, LinearB publishes the Engineering Benchmarks Report, which analyzes data from more than 3,000 engineering teams across industries, locations, and company sizes. This report provides a solid foundation for evaluating your organization's DORA metrics performance.
The following table breaks down current industry benchmarks:
Metric | Elite | Good | Fair | Needs Improvement |
| Deployment Frequency (per service) | > 1 | 1-0.5 | 4-0.15 | < 1.5 |
| Change Lead Time (hours) | < 26 | 26-80 | 81-167 | > 167 |
| Change Fail Percentage (%) | < 1% | 1-4% | 5-23% | > 23% |
| Failed Deployment Recovery Time (hours) | < 6 | 6-11 | 12-30 | > 30 |
| Coding time (hours) | < 1 | 1-4 | 5-23 | > 23 |
| Pickup time (mins/hours) | < 75 mins | 75mins-5 hours | 6-16 | > 16 |
| Review time (hours) | < 3 | 3-13 | 14-24 | > 24 |
| Deploy time (hours) | < 6 | 6-95 | 96-248 | > 248 |
Download your copy of the 2025 Engineering Benchmarks Report here
How to Habitualize DORA Metrics for Continuous Improvement
DORA metrics provide a robust framework for measuring and improving software delivery performance, but their real value lies in driving continuous improvement. Here are proven habits that successful engineering teams develop to leverage DORA metrics:
- Set team-level goals for key metrics like pickup time, review time, and PR size, and use automated notifications to keep work on track.
- Schedule monthly metrics reviews where engineering leaders share wins and challenges and collaborate to unblock developer workflows.
- Empower managers to check DORA metrics weekly to identify team members who need additional support.
- Implement workflow automation to optimize code reviews, which are often the biggest source of Change Lead Time inefficiencies.
Remember that improving DORA metrics is not an end goal but a means to deliver quality software more efficiently. These metrics help engineering leaders make data-driven decisions that improve their ability to provide value to customers.
Measuring DORA Metrics Isn’t Enough: You Need to Drive Improvement
DORA metrics provide a vital window into the performance of your software delivery process, but they’re only the beginning. Tracking Deployment Frequency, Change Lead Time, Change Fail Percentage, and MTTR offers clarity on what’s happening in your pipeline, but not why it’s happening or how to fix it. To turn DORA metrics from dashboards into drivers of business value, engineering leaders must go a step further: using these insights to implement changes that meaningfully improve developer productivity and outcomes.
DORA Metrics Are Lagging Indicators—You Need Leading Ones Too
While DORA excels at measuring delivery performance, it doesn’t show what actions to take. These metrics are calculated after code hits production. If your Change Fail Percentage is too high or your Lead Time is lagging, DORA alone won’t reveal whether the problem stems from bloated PRs, inconsistent reviews, overloaded teams, or ineffective tooling. To close the loop, you must monitor leading indicators like:
- PR size and maturity
- Cycle time breakdowns (coding, pickup, review, deploy)
- Merge frequency
- Cognitive load and WIP limits
These metrics help identify bottlenecks before they hurt delivery. For example, reducing PR size often results in faster pickups, quicker reviews, and fewer defects—improving Change Lead Time and Change Fail Percentage simultaneously.
Visibility Alone Doesn’t Improve Productivity. You Need Action
DORA gives you the “what,” but improvement comes from acting on the “why.” True gains in developer productivity come when you:
- Set data-backed goals tied to root causes, not just DORA scores
- Automate toil-heavy workflows like code review assignment, CI/CD triggers, and risk identification
- Correlate operational data (e.g., cycle time) with business outcomes (e.g., value delivery, retention)
- Enhance DevEx by reducing idle time, context switching, and unbalanced workloads
Engineering teams often stall after visualizing DORA metrics. Progress only occurs when those insights are connected to structured improvement initiatives and backed by platform support for automation and measurement.
The Path to Productivity Gains
To transform DORA metrics into productivity gains, organizations must operationalize improvement across three dimensions:
- Efficiency: Optimize processes through smaller PRs, faster reviews, and streamlined deploys.
- Effectiveness: Align engineering efforts with business goals using planning accuracy, investment mix, and resource allocation.
- Experience: Improve DevEx by eliminating friction, reducing wait times, and ensuring work variety and balance.
By combining DORA’s delivery metrics with upstream signals and workflow automation, high-performing organizations systematically improve productivity rather than simply viewing dashboards.
DORA Metrics FAQ
What are the four DORA metrics?
The four DORA metrics are Deployment Frequency (how often you deploy code), Change Lead Time (how long it takes for code to reach production), Change Failure Percentage (how often deployments cause failures), and Failed Deployment Recovery Time (how quickly you can recover from failures). Together, they measure both the speed and stability of your software delivery process.
Why were DORA metrics created?
DORA metrics were developed through rigorous research by the DevOps Research and Assessment (DORA) team founded by Gene Kim, Jez Humble, and Nicole Forsgren in 2015. Their goal was to identify key indicators that correlate with high-performing software teams, based on data from thousands of organizations.
How do DORA metrics relate to business outcomes?
Research shows teams that excel at DORA metrics are 2x more likely to exceed organizational performance goals, 1.8x more likely to report better customer satisfaction, and significantly more effective at streamlining operational efficiency. These metrics directly impact your ability to deliver value quickly and reliably.
Measurement & Benchmarks
What is a good benchmark for DORA metrics?
Elite performing teams deploy multiple times per day, have Change Lead Times under 26 hours, maintain a Change Failure Percentage below 1%, and recover from failures in less than 6 hours. However, context matters what's "elite" for a regulated financial institution may differ from a SaaS startup.
How should you start tracking DORA metrics?
Begin by connecting data from your git repositories, project management tools, incident management platforms, and CI/CD systems. While manual tracking is possible, most organizations benefit from using a Software Engineering Intelligence platform that automates data collection and analysis.
How do you calculate Change Lead Time accurately?
Change Lead Time measures the time from the first commit to production deployment. For accuracy, break it down into components: coding time (first commit to PR creation), pickup time (PR creation to first review), review time (first review to merge), and deploy time (merge to production).
How do you calculate Change Fail Percentage?
Change Fail Percentage is calculated by dividing the number of deployments that lead to a degradation in service by the total number of deployments in a given time period. For example, if 2 out of 50 deployments cause incidents, your CFP is 4%.
Can DORA metrics be used in agile environments?
Yes, DORA metrics complement agile methodologies by providing quantitative measures of delivery performance that can be tracked across sprints and releases. They help agile teams identify systemic bottlenecks and measure the impact of process improvements.
How do DORA metrics relate to developer productivity?
DORA metrics are indicators of team productivity, not individual developer performance. They help identify systemic issues in your engineering process that may be preventing developers from delivering their best work. Focus on improving the system rather than evaluating individual contributors.
Learn more about measuring and accelerating developer productivity here→
What are the most common challenges in improving DORA metrics?
Common challenges include: connecting disparate data sources, establishing consistent definitions across teams, overcoming organizational resistance to measurement, maintaining balance between speed and stability metrics, and turning insights into action. A systematic approach with clear ownership typically yields the best results.
How long does it take to see improvements in DORA metrics?
With focused effort and the right tooling, teams typically see measurable improvements within 1-3 months. Lower-performing teams often achieve the most dramatic early gains. Sustained improvement requires continuous commitment and a culture of experimentation.
How do DORA metrics compare to other frameworks like SPACE or DevEx?
DORA focuses on delivery capabilities, while SPACE provides a more holistic view of productivity, and DevEx centers on developer experience. Rather than viewing these as competing alternatives, consider how they complement each other. DORA offers concrete delivery metrics, SPACE fills gaps in productivity definition, and DevEx guides experience improvements.
Are DORA metrics applicable to all types of software development?
While the principles apply broadly, implementation details may vary. For example, mobile teams deploying through app stores may need modified Deployment Frequency definitions. Infrastructure teams may focus more on Change Fali Percentage than deployment speed. Adapt the metrics to your context while maintaining their core intent.
How should DORA metrics influence engineering investment decisions?
Use DORA metrics to identify your biggest bottlenecks and prioritize investments accordingly. If Change Lead Time is slow due to long review cycles, invest in review automation and expertise matching. If recovery times are high, prioritize monitoring and rollback capabilities. Let data guide your improvement roadmap.
Can DORA metrics be gamed or misused?
Like any metric, DORA can be gamed if used improperly. Avoid setting them as targets tied to performance evaluations. For example, teams might deploy trivial changes to boost frequency or declare incidents resolved prematurely to improve recovery time. Focus on the outcomes these metrics represent, not the numbers themselves.
Ready to Track and Improve Your DORA Metrics?
LinearB's Software Engineering Intelligence platform automatically tracks all four DORA metrics across your entire engineering organization, helping you identify bottlenecks, set achievable goals, and measure improvement over time.