As an engineering VP or manager, you don’t have consistent metrics to show the business what your teams are working on. Plus, it’s hard to prove that what they’re working on aligns with business needs. What you need is a way to quantify your engineering org’s efficiency so you can justify scaling your team up, and that means using DevOps metrics.
By using DevOps DORA metrics and key performance indicators (KPIs), you can effectively gauge your DevOps effectiveness and success—trust us, this is tried and true.
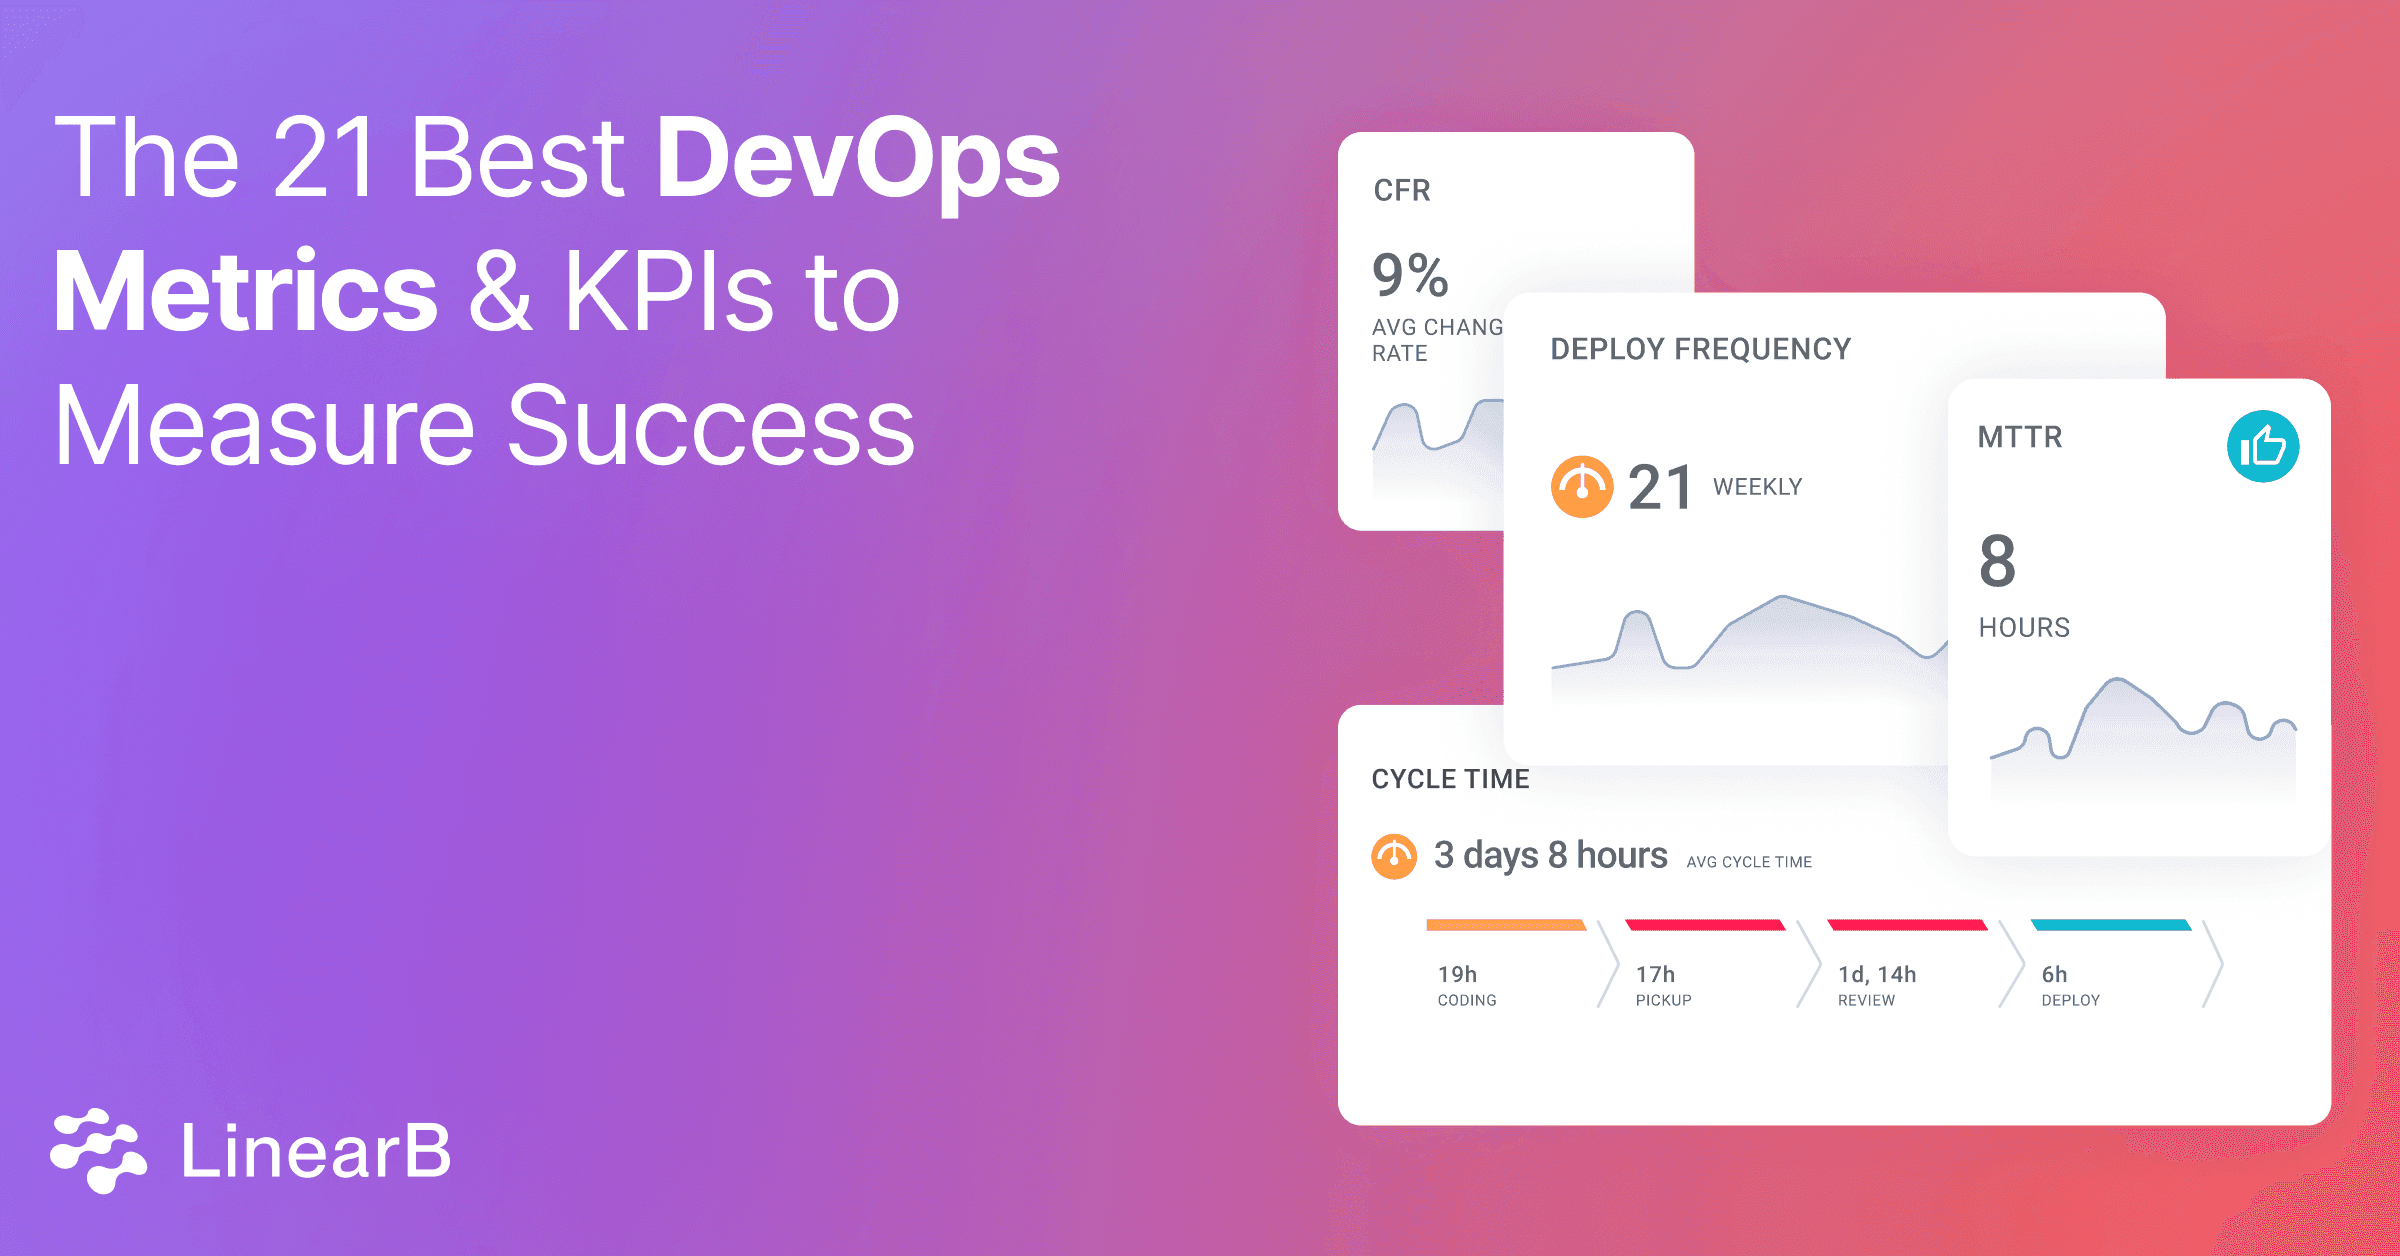
What Are DevOps Metrics?
DevOps metrics are specific data points that show you how well a DevOps software development pipeline is operating. These stats are quantitative assessment tools that help you evaluate your DevOps’ effectiveness.
You can use DevOps metrics to measure, benchmark, and improve team operations and technical skills. Moreover, these metrics provide key insight that DevOps teams can use to pinpoint and address any process bottlenecks quickly
If you want to discover bottlenecks to continuously improve teams’ performance, you can always rely on DevOps Research and Assessments (DORA) metrics—deployment frequency, cycle time, change failure rate, and mean time to restore. They have become the standard method engineering leaders use to get a high-level overview of how their organizations are performing. They’re also a great starting point for setting up an engineering metrics program.
But DORA metrics aren’t a perfect solution because they’re lagging indicators and they don’t tie directly to business outcomes. Too much focus on DORA metrics ignores the bigger picture. So let’s look at a few key DevOps Metrics you should include with the 4 DORA metrics.
Top 21 DevOps KPIs
DevOps DORA metrics are plentiful, so you need to narrow in on the key performance indicators relevant to your business needs. We’ve compiled this list of 21 DevOps KPIs to help you with measuring DevOps success.
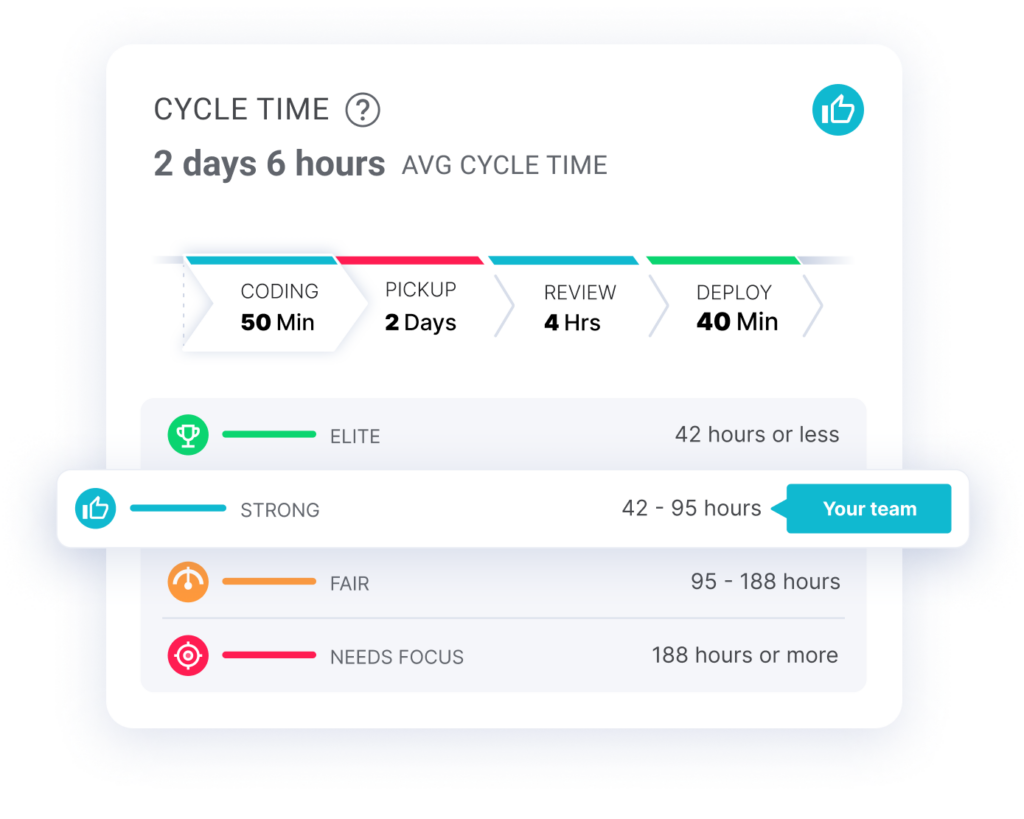
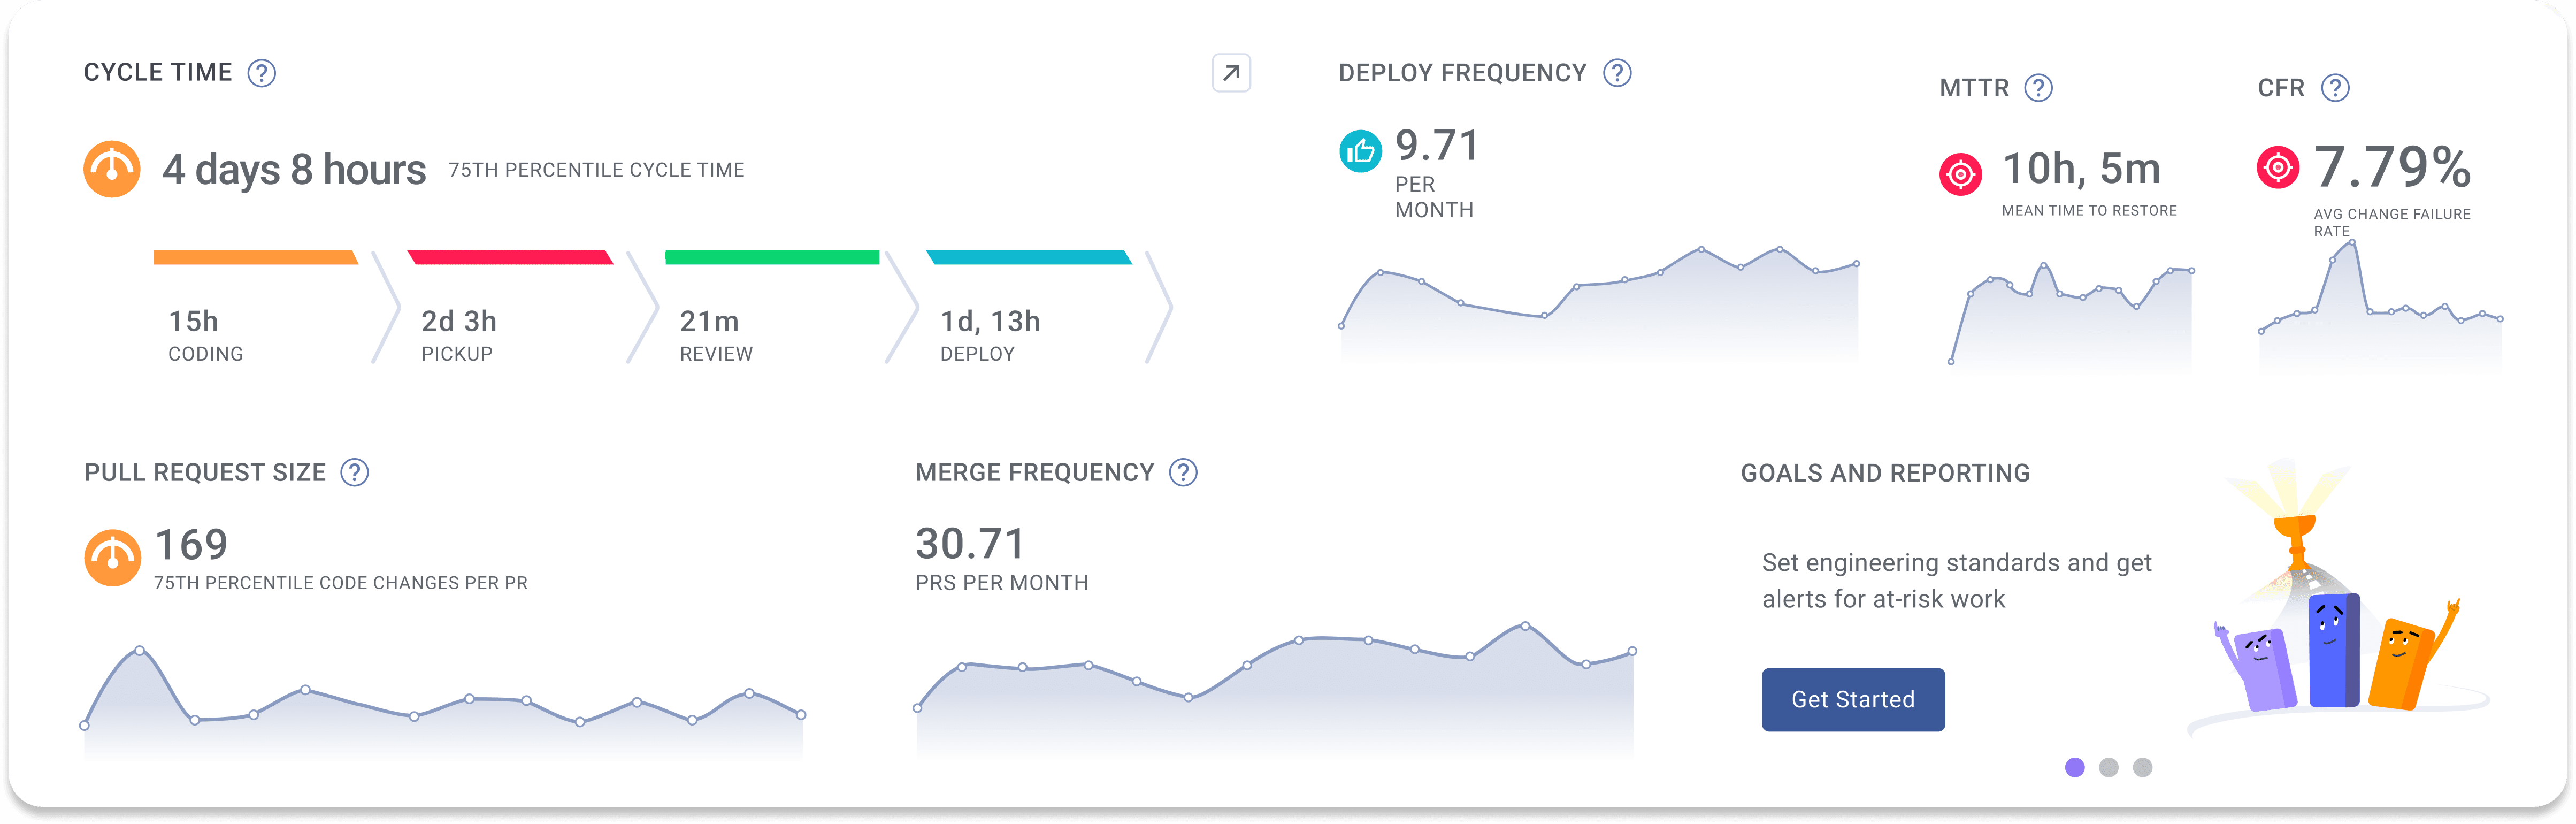
1. Cycle Time
Cycle time measures the amount of time from work started to work delivered, typically from first commit to release to production. It’s also helpful to measure each of the 4 phases of cycle time separately—coding time, pickup time, review time, and deployment time.
Teams with shorter cycle times mean they’re delivering quality code more often. And this means they’re able to deliver more features quickly and reliably.
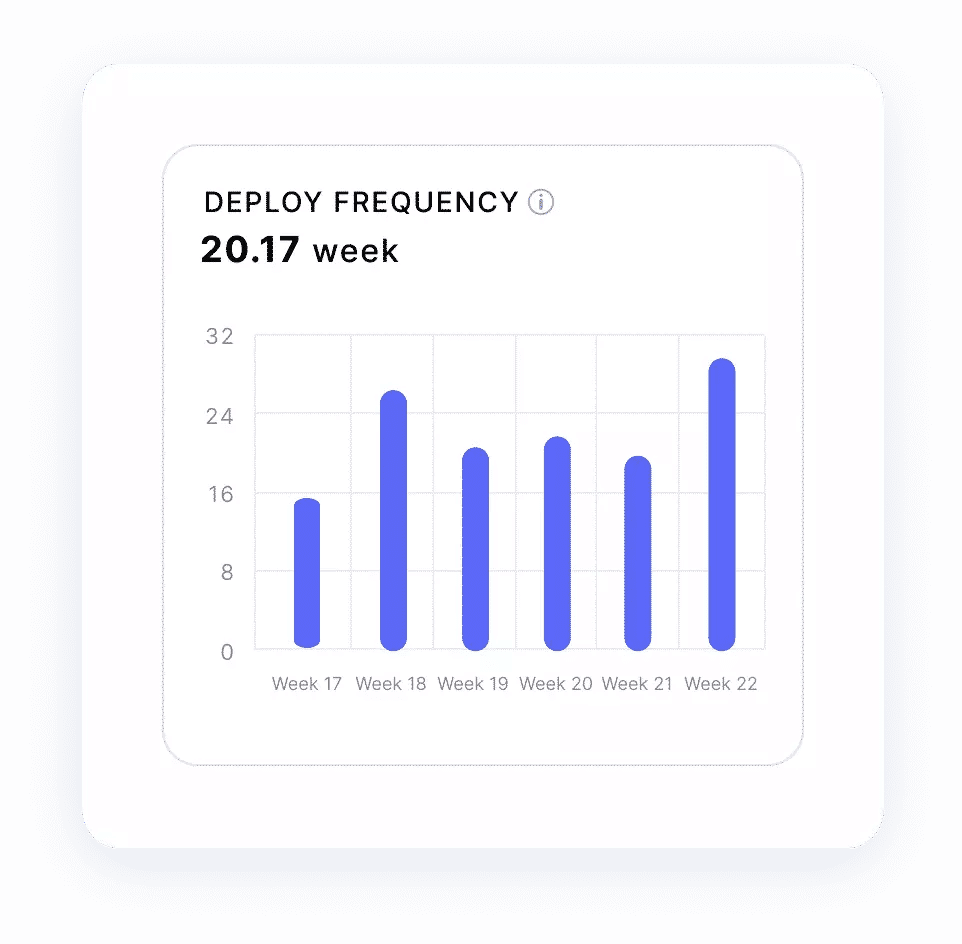
2. Deployment Frequency
Deployment frequency measures how often an organization successfully releases to production. If your teams are deploying often, that signals a healthy and stable CI/CD pipeline. In turn, this improves your user experience and keeps delays low.
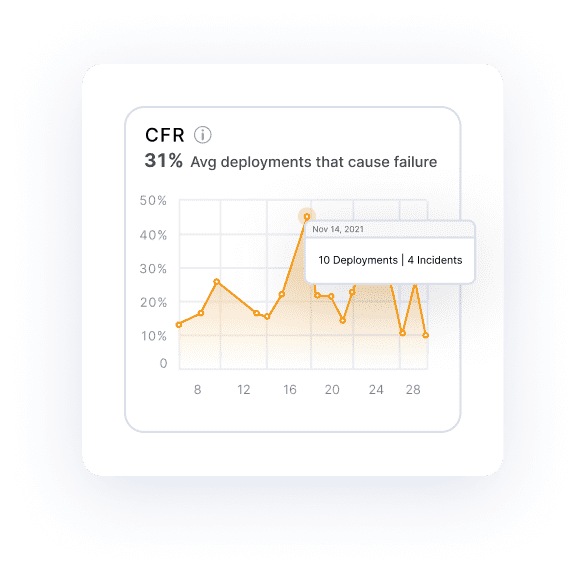
3. Change Failure Rate
Change failure rate (CFR) measures the percentage of failed deployments to production. The best teams have a CFR of just under 15%. In a perfect world, you’d have a CFR of zero–but humans write code and sometimes they make mistakes. That said, the Gen AI revolution is here (87% of companies are likely or highly likely to invest in GenAI tools in 2024) and it can be measured! It’s very possible that a new benchmark for CFR could be set in the near future!
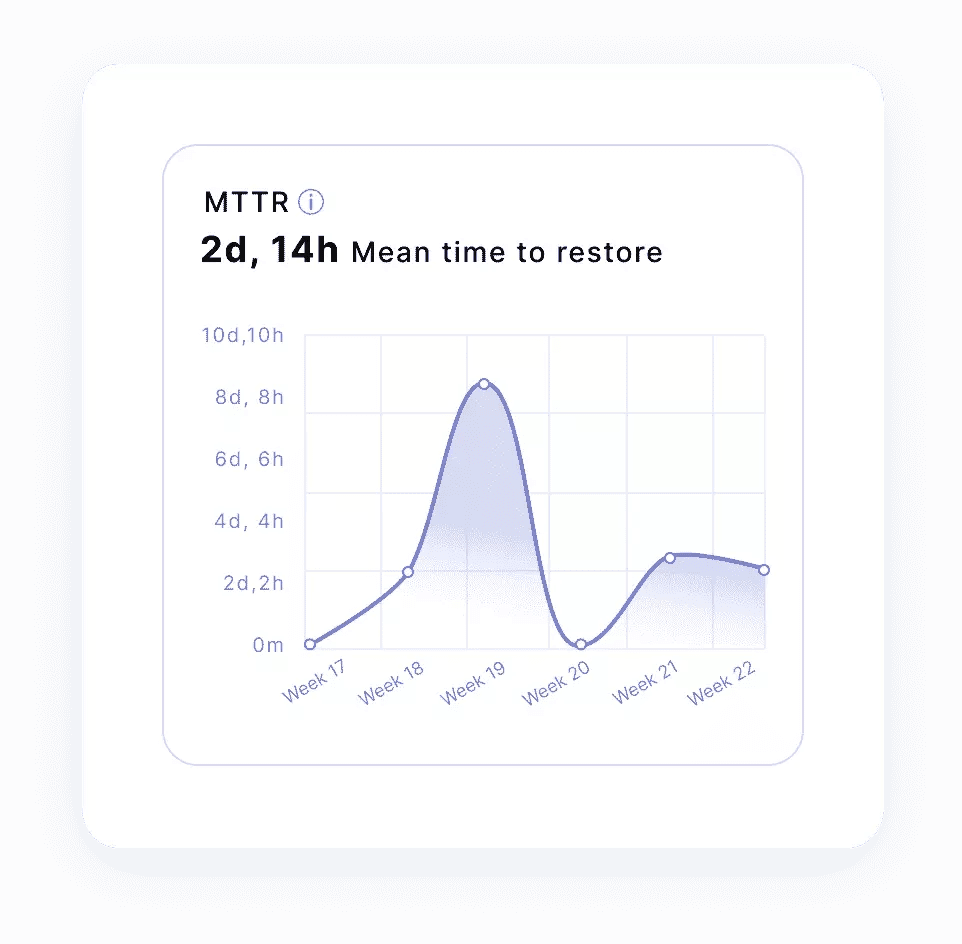
4. Mean Time To Recovery
Mean Time to Recovery (MTTR) measures how long it takes an organization to recover from a failure in production. If your team is quickly able to resolve production bugs or outages, you’ll have a better user experience when things hit the fan. The key to an elite MTTR metric is small PRs that can be easily and quickly scanned. It makes the job of root cause analysis and addressing bugs much easier and faster–all of which contributes to a healthy MTTR.
5. PR Size
Pull request (PR) size is a one of the most important DevOps metrics calculating the average code changes (in lines of code) of a pull request. It’s also one of the most powerful leading indicator metrics out there. It has a huge impact on all four DORA metrics as well as things like merge frequency and overall quality. Large PRs can be a huge bottleneck and impact your team’s efficiency. Why? Large PRs:
- Take more time to review
- Are usually more complex and therefore harder to review
- Sit idle for longer (because they take more time to review)
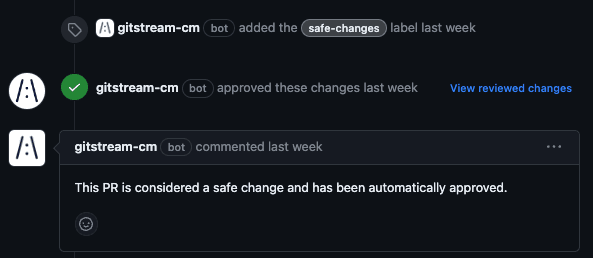
One way to make the PR process more efficient is to automate processes and provide more context for reviewers. gitStream provides automations for many aspects of the PR process including applying helpful labels about code context, automating reviews and approvals for things like docs changes or Dependabot-generated PRs, and helping new developers adhere to best practices.
If you want DORA metrics, leading indicator metrics like PR size and merge frequency, and automation to help you improve (all in one place), sign up for a free LinearB account!
6. Coding Time
The time it takes from the first commit until a pull request is issued. Short coding time correlates to low WIP, small PR size and clear requirements.
7. Pickup Time
The time a pull request waits for someone to start reviewing it. Low pickup time represents strong teamwork and a healthy review process.
8. Review Time
The time it takes to complete a code review and get a pull request merged. Low review time represents strong teamwork and a healthy review process.
9. Approve Time
The time from first comment to the first approval. This metric, along with merge time, is a more granular subsets of review time.
10. Merge Time
The time from the first approval to merge. This metric, along with approve time is a more granular subset of Review Time.
11. Deploy Time
The time from when a branch is merged to when the code is released. Low deploy time correlates to high deploy frequency.
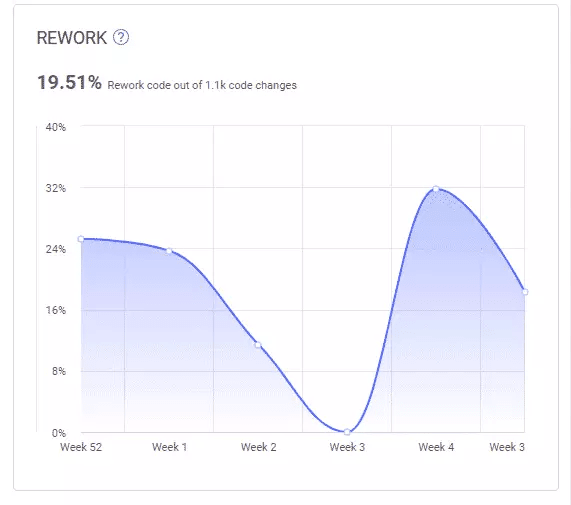
12. Rework Rate
Rework refers to code that is rewritten or deleted shortly after being added to your code base. LinearB considers changes to code that have been in your code-base for less than 21 days as reworked code.
Your rework rate is the percentage of changes that are considered rework for a given timeframe. Ideally, you’d keep this rate as low as possible, as low rework rates mean your teams are writing clean, efficient code and have more time to focus on delivering new features.
13. Refactor Rate
Refactored work represents changes to legacy code. LinearB considers code "legacy" if it has been in your code-base for over 21 days.
14 & 15. Planning Accuracy & Capacity Accuracy
Planning Accuracy is the ratio of the planned and completed issues or story points out of the total issues or story points planned for the iteration. Capacity Accuracy is all completed work (planned or unplanned) as a ratio of planned work. These two scores together – in addition to being a great leading indicator of whether a team will deliver a project on-time or not–also paint a picture of a team’s ability to:
- Scope/plan their iterations
- Execute on those plans
- Adapt to the normal rhythm of engineering work
Nobody loves telling the execs, sales, customer success, and marketing that all their plans have to change because engineering missed a deadline.
It’s inevitable that you’re going to have scope creep and unplanned work each iteration, but keeping a high planning accuracy means you’re delivering on your promises to the rest of the business most of the time.
High Capacity Accuracy (85% - 115%) | Low Capacity Accuracy (<80%) | |
High Planning Accuracy (75% - 95%) | Your project and or team is doing extremely well! Keep it up! If other projects are not trending so well, consider moving some resources around | Your team scoped the iteration well, but they aren’t necessarily responding to normal changes and fluctuations Work on adapting to the needs and priorities of the business |
Low Planning Accuracy (<70%) | Execution is good, but you’re focusing on the wrong things Scope creep and unplanned work is taking up too much time Talk to PM about added work and prioritize your planned work | You’re taking on too much work – splitting focus and increasing delay risks You need to scope down and focus on your planned work Would be a good time to inquire about additional resources if possible |
16. Merge Frequency
Merge Frequency measures the total number of pull requests or merge requests merged by a team over a period of time.
17. PR Maturity
PR Maturity is a ratio of “back-and-forths” on PRs between submitter and reviewer(s). PR Maturity is a proxy for review thoroughness. Generally speaking, small PRs (<250 lines of code changes) that provide reviewers with more context upfront (language, estimated review time, testing) and assigned to the right reviewer will result in more maturity as they usually don’t require lots of handoffs.
18. Issues Linked to Parents
This metric is measured by the percentage of tasks or subtasks within JIRA that are linked to a parent issue, such as an epic or story.
19. Branches Linked to Issues
Branches Linked to Issues is the percentage of code branches associated with specific JIRA issues, providing visibility into the alignment of code changes with planned tasks.
Both Issues Linked to Parents and Branches Linked to Issues are metrics that engineering teams can use as proxies for traceability. Optimizing for these metrics will make it easier for teams to monitor development progress and ensure that each branch or issue is tied to a defined work item.
20. In Progress Issues with Estimation
The proportion of ongoing JIRA tasks that have time or effort estimates assigned.
21. In Progress Issues with Assignees
The percentage of active JIRA tasks that have a designated team member responsible for completing them.
Tracking both In Progress Issues with Estimation & In Progress Issues with Assignees helps teams evaluate planning accuracy and data integrity by ensuring that work in progress has a defined scope and clearly assigned reviewer(s), aiding in predictability and effective workload management.
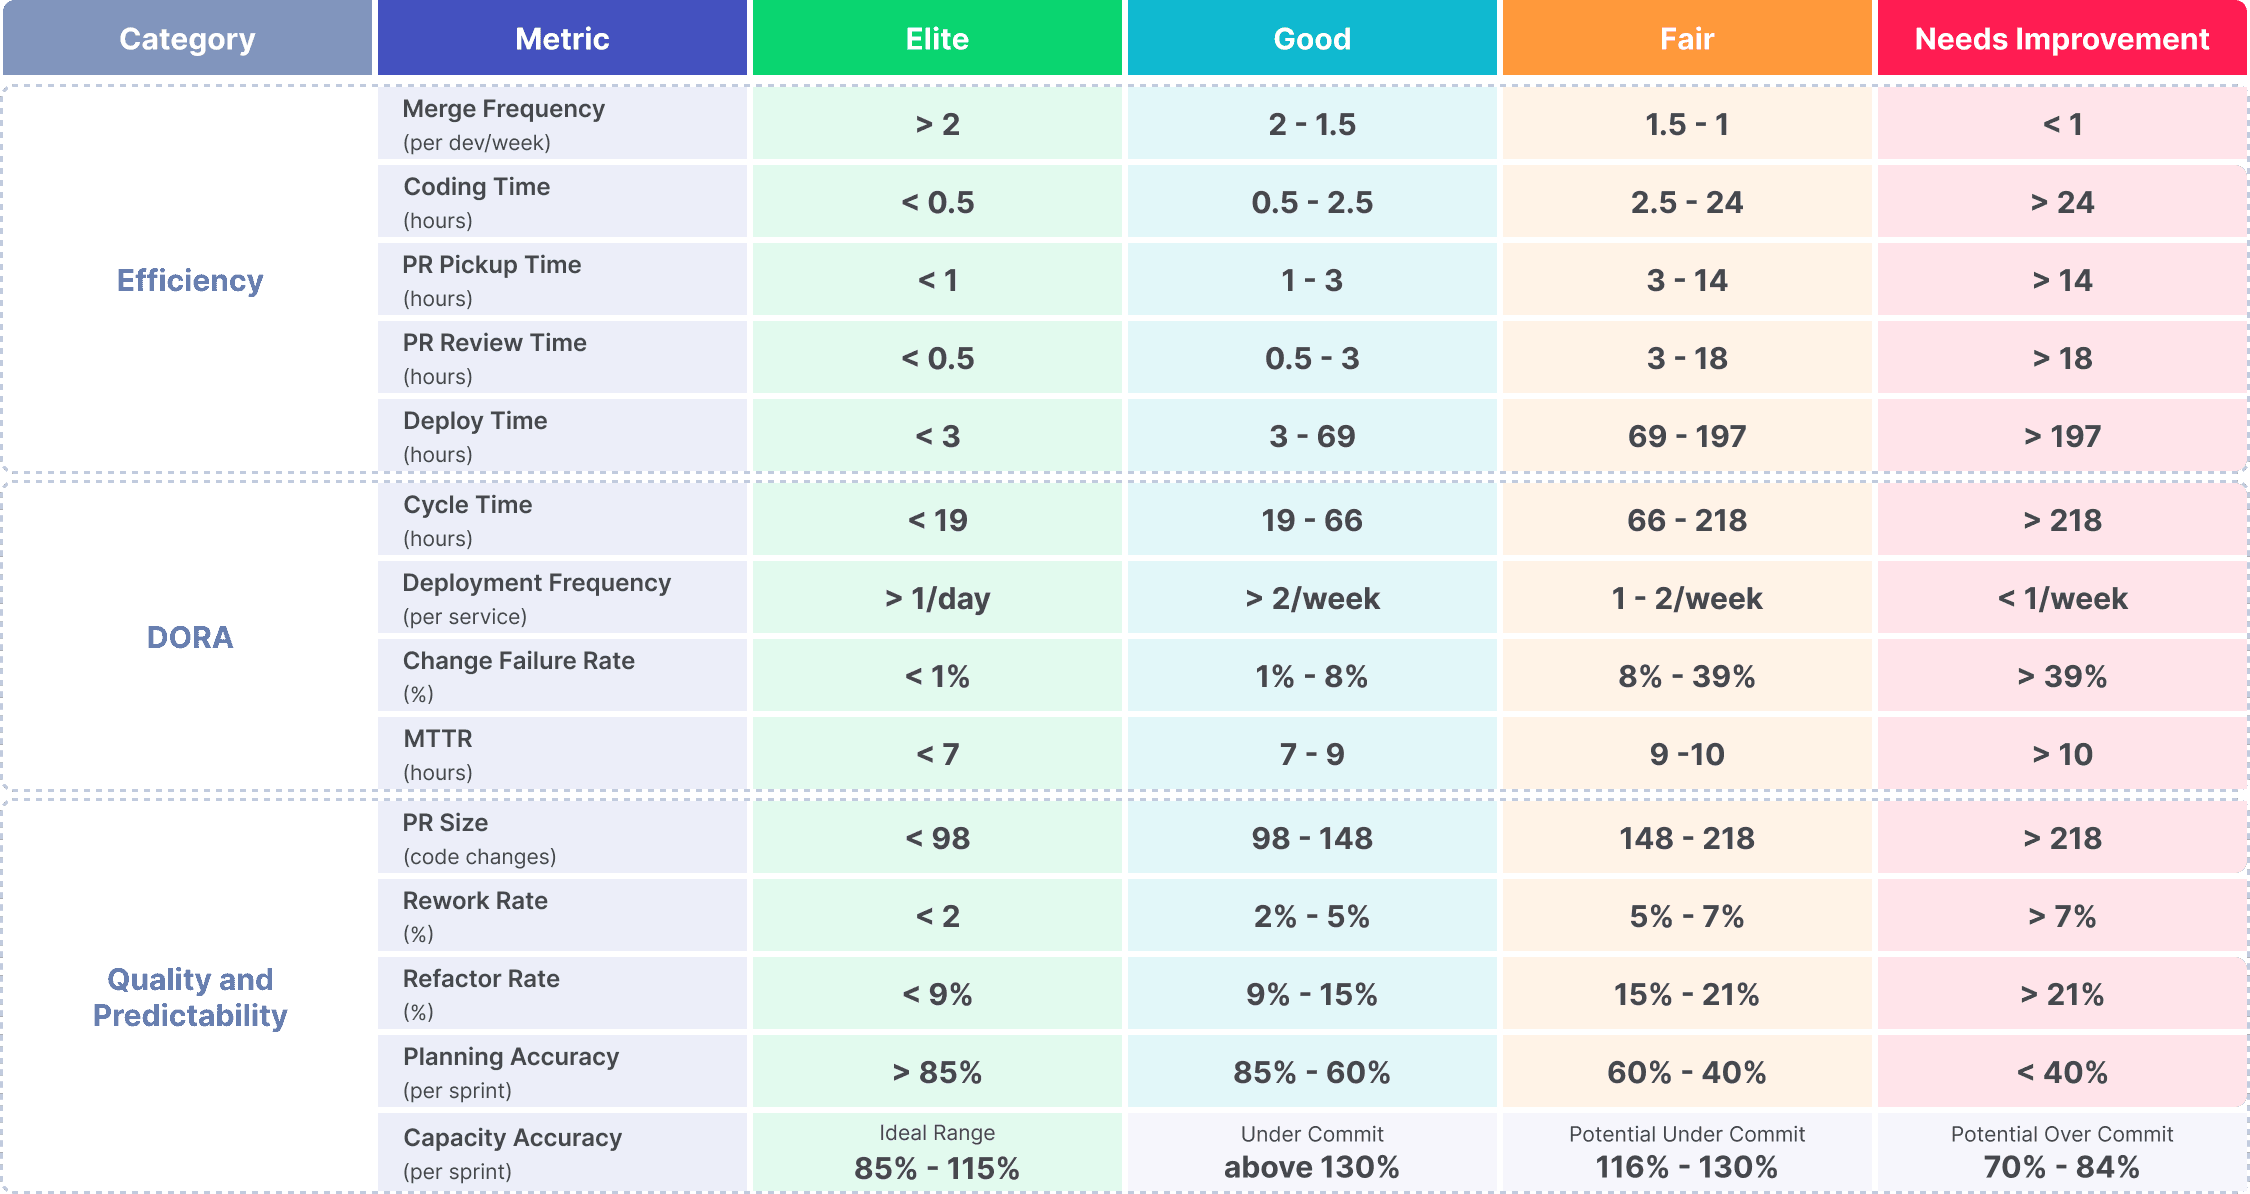
In addition to measuring these 21 DevOps Metrics, knowing how your teams compare against industry standards helps you justify where you need to focus improvement efforts. We studied over 2,000 teams in our Engineering Metrics Benchmarks study to determine what makes engineering teams elite. Then, we incorporated these benchmarks into our analytics dashboards so you can see at a glance how your team is performing and contrast that against the industry average.
Want to learn more about being an elite engineering team? Check out this blog detailing our engineering benchmarks study and methodology.
Improving Your DevOps Metrics and KPIs
Once you’ve identified the key DevOps Metrics to measure your software development process efficiency and benchmarked where your teams stand, you can create an action plan and strategies to improve your numbers.
As we’ve learned with CI/CD, automation is key to dramatic improvement in engineering productivity and team health. So rather than try to micromanage your teams to improve DevOps metrics, provide them with the automation tools that help them self-improve.
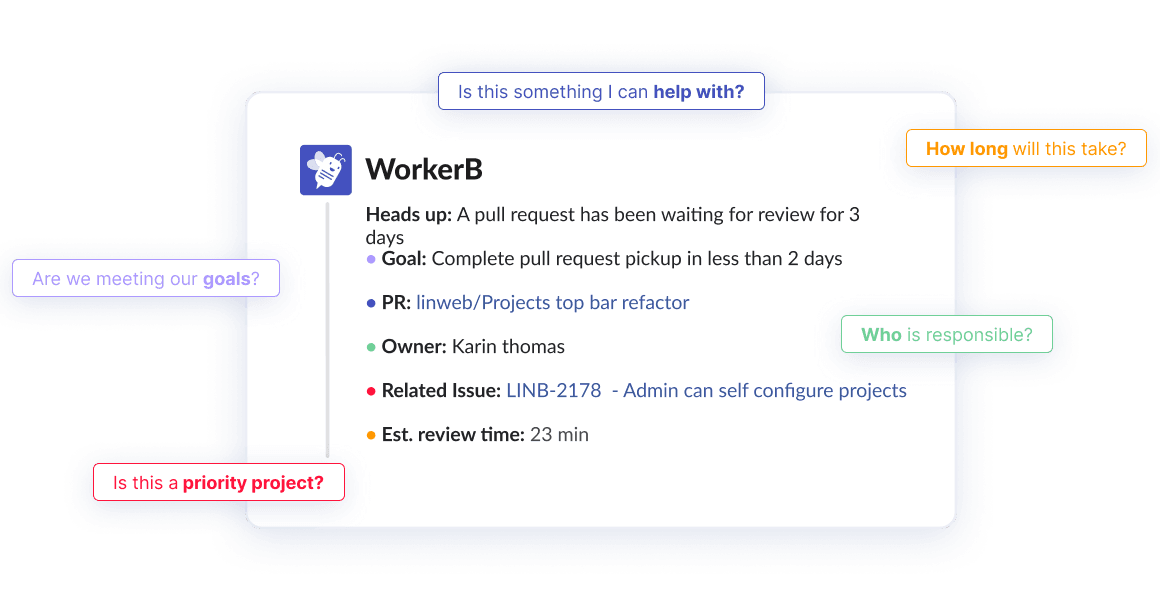
LinearB provides both automated real time alerting and programmable workflow automation at the code review level. The alerts let the team know about work in flight, set operational goals, PRs awaiting review, additional context, and provide one-click automations to remove manual work–like creating Jira tickets and approving small PRs directly from Slack.
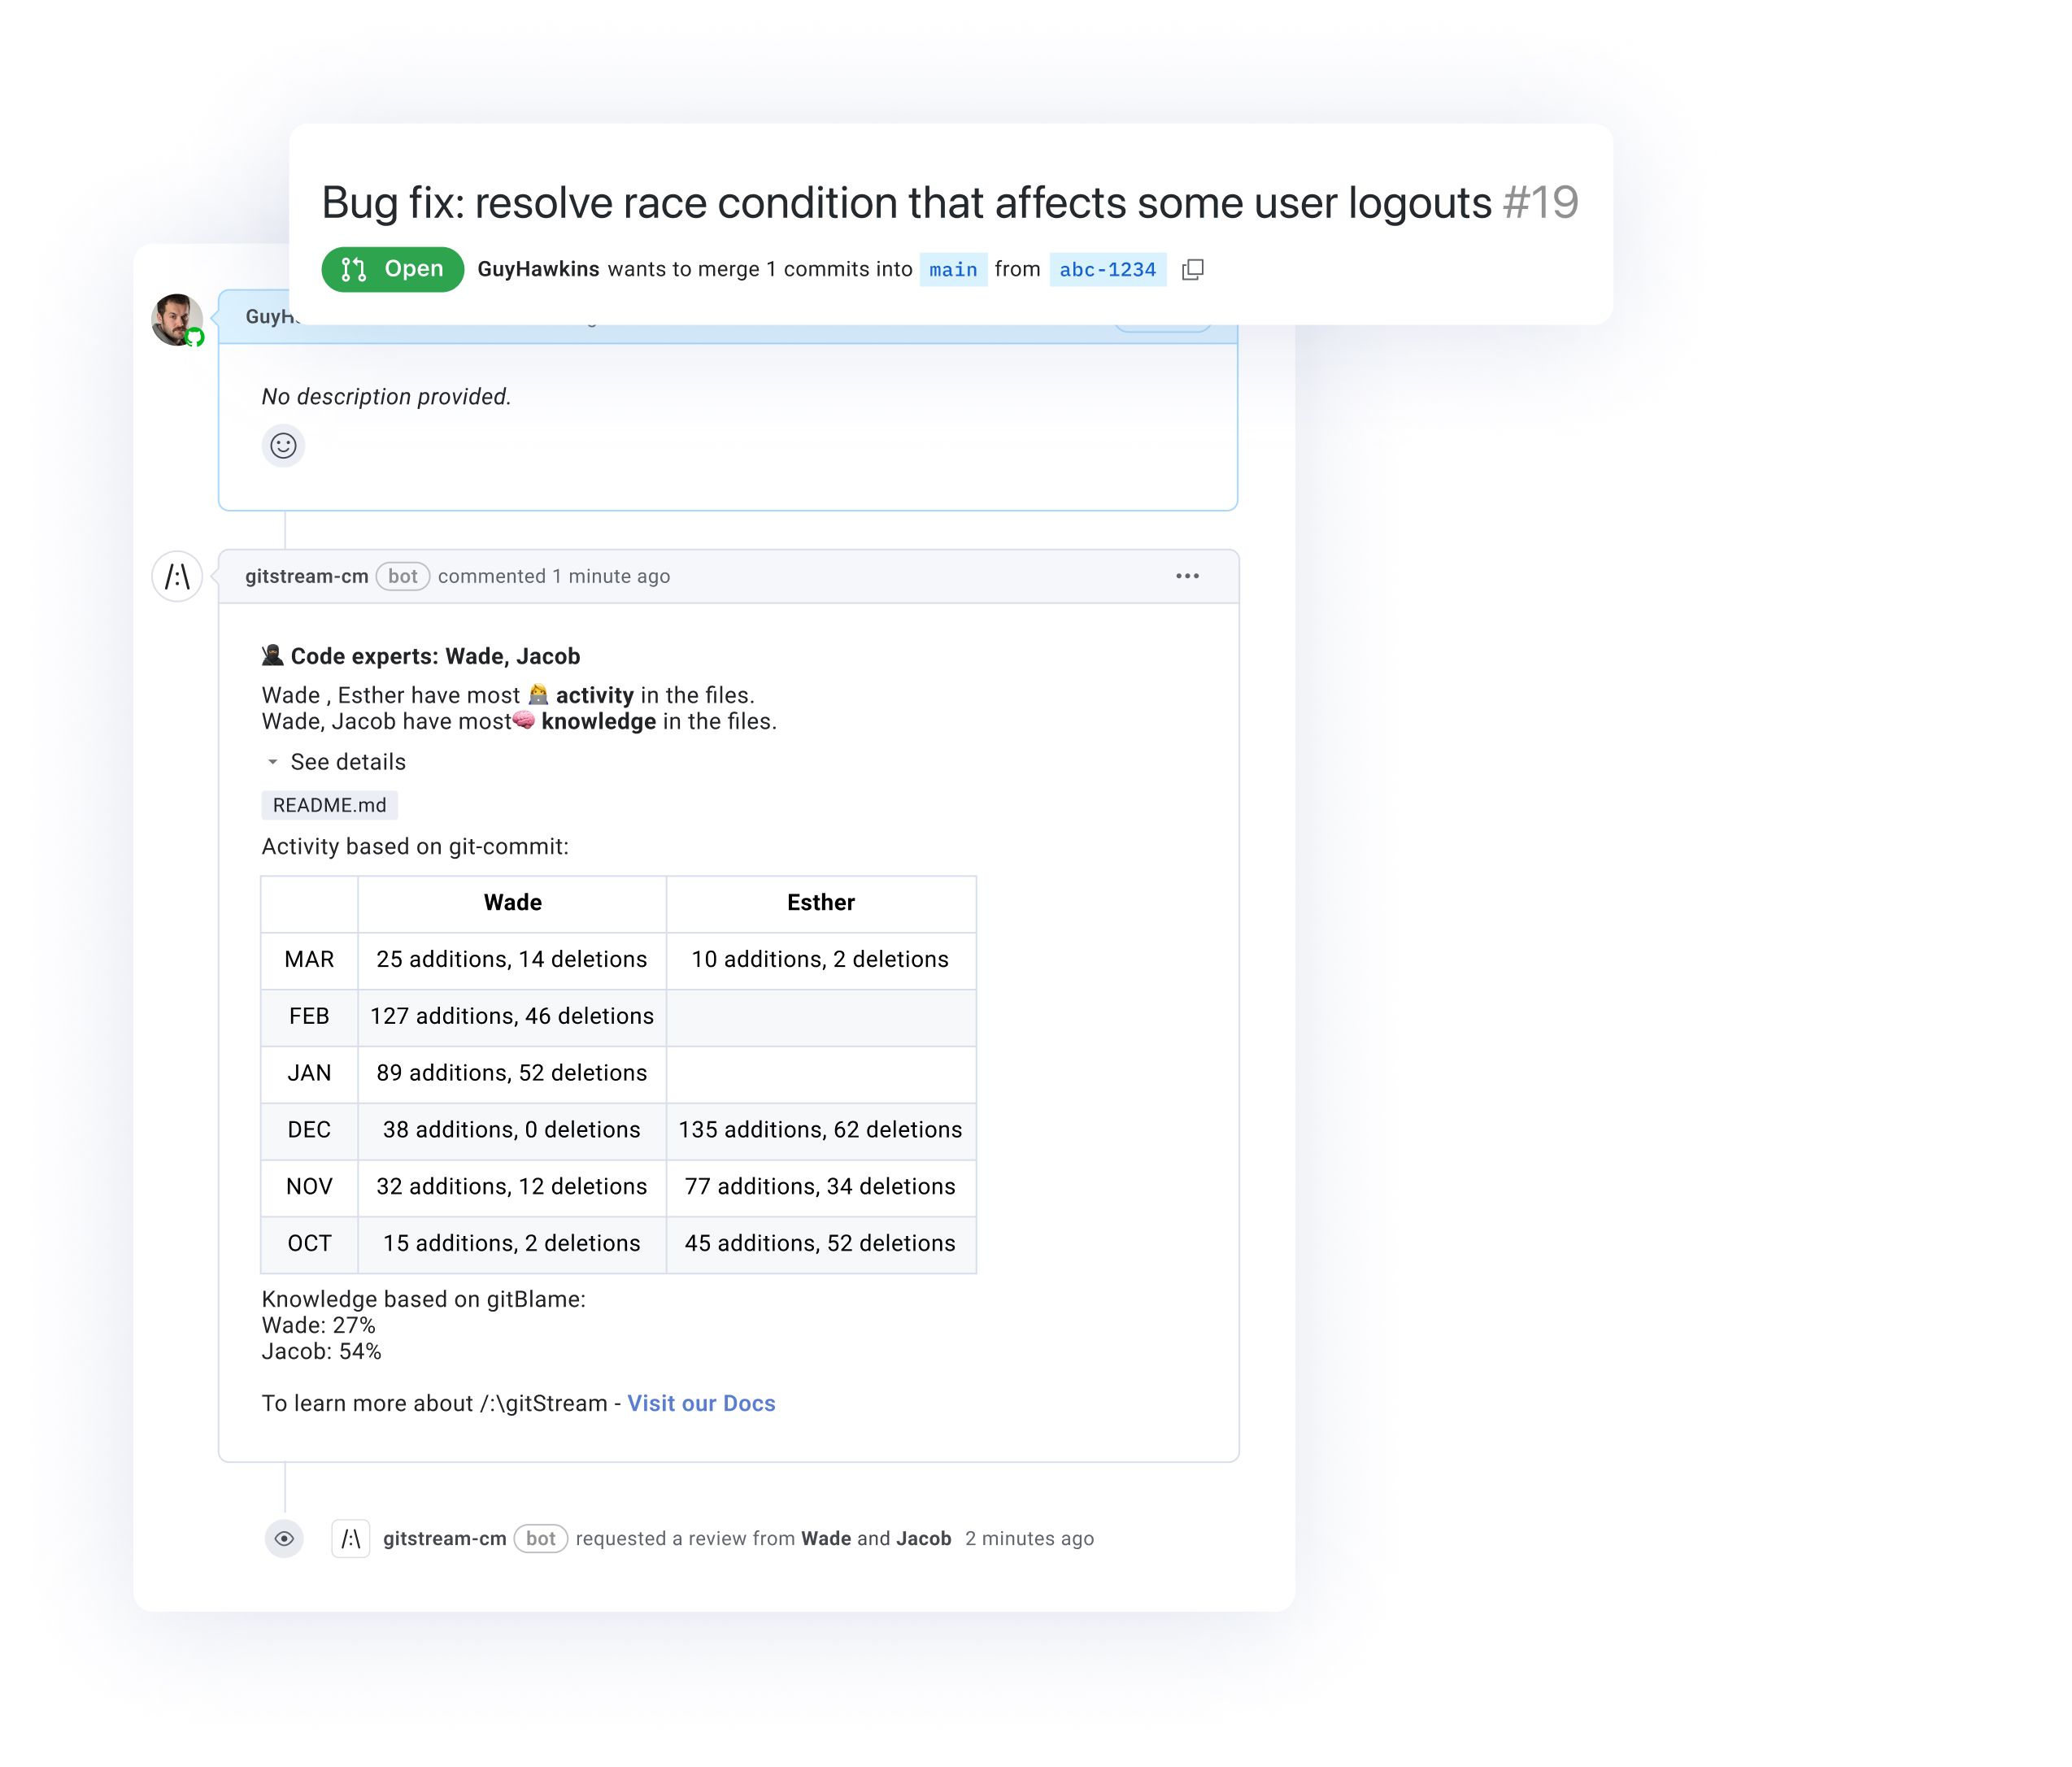
gitStream workflow automation helps pave a golden path toward higher merge frequency–not to mention happier developers–by automating the most frustrating parts of the PR review process. It drives both efficiency and quality using workflows for things like flagging deprecated components, finding and assigning the appropriate reviewer, and automatically labeling PRs missing tests.
If you’d like to learn more about DevOps Metrics or see the capabilities discussed in this blog in action, schedule a demo of LinearB today!
If you’d like to jump right in, you can get a totally free forever LinearB account right here.